Supervisory Banking Statistics
supervisorybankingstatistics_third_quarter_2016_201701.en
supervisorybankingstatistics_third_quarter_2016_201701.en

Create successful ePaper yourself
Turn your PDF publications into a flip-book with our unique Google optimized e-Paper software.
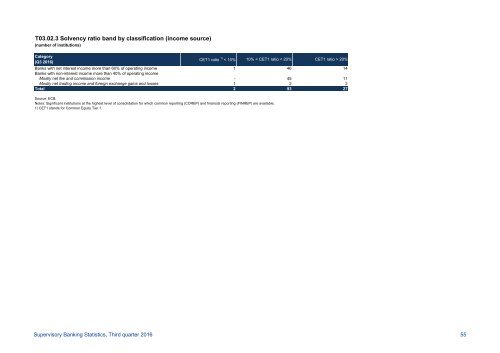
T03.02.3 Solvency ratio band by classification (income source)<br />
(number of institutions)<br />
Category<br />
(Q3 2016)<br />
CET1 ratio 1) < 10% 10% < CET1 ratio < 20% CET1 ratio > 20%<br />
Banks with net interest income more than 60% of operating income 1 46 14<br />
Banks with non-interest income more than 40% of operating income<br />
Mostly net fee and commission income - 45 11<br />
Mostly net trading income and foreign exchange gains and losses 1 2 2<br />
Total 2 93 27<br />
Source: ECB.<br />
Notes: Significant institutions at the highest level of consolidation for which common reporting (COREP) and financial reporting (FINREP) are available.<br />
1) CET1 stands for Common Equity Tier 1.<br />
<strong>Supervisory</strong> <strong>Banking</strong> <strong>Statistics</strong>, Third quarter 2016 55