Supervisory Banking Statistics
supervisorybankingstatistics_third_quarter_2016_201701.en
supervisorybankingstatistics_third_quarter_2016_201701.en

Create successful ePaper yourself
Turn your PDF publications into a flip-book with our unique Google optimized e-Paper software.
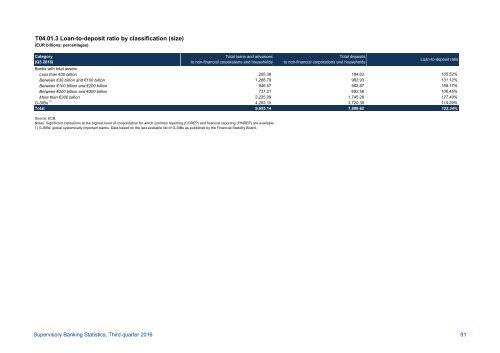
T04.01.3 Loan-to-deposit ratio by classification (size)<br />
(EUR billions; percentages)<br />
Category<br />
(Q3 2016)<br />
Total loans and advances<br />
to non-financial corporations and households<br />
Total deposits<br />
to non-financial corporations and households<br />
Loan-to-deposit ratio<br />
Banks with total assets<br />
Less than €30 billion 205.39 194.63 105.52%<br />
Between €30 billion and €100 billion 1,288.79 982.93 131.12%<br />
Between €100 billion and €200 billion 946.57 562.87 168.17%<br />
Between €200 billion and €300 billion 737.21 692.56 106.45%<br />
More than €300 billion 2,225.09 1,745.28 127.49%<br />
G-SIBs 1) 4,252.10 3,720.35 114.29%<br />
Total 9,655.14 7,898.62 122.24%<br />
Source: ECB.<br />
Notes: Significant institutions at the highest level of consolidation for which common reporting (COREP) and financial reporting (FINREP) are available.<br />
1) G-SIBs: global systemically important banks. Data based on the last available list of G-SIBs as published by the Financial Stability Board.<br />
<strong>Supervisory</strong> <strong>Banking</strong> <strong>Statistics</strong>, Third quarter 2016 91