Supervisory Banking Statistics
supervisorybankingstatistics_third_quarter_2016_201701.en
supervisorybankingstatistics_third_quarter_2016_201701.en

You also want an ePaper? Increase the reach of your titles
YUMPU automatically turns print PDFs into web optimized ePapers that Google loves.
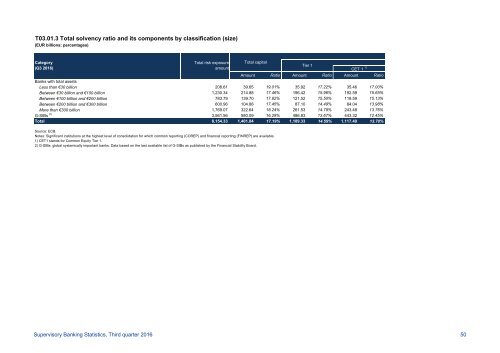
T03.01.3 Total solvency ratio and its components by classification (size)<br />
(EUR billions; percentages)<br />
Category<br />
(Q3 2016)<br />
Total risk exposure<br />
amount<br />
Total capital<br />
Amount Ratio Amount Ratio Amount Ratio<br />
Banks with total assets<br />
Less than €30 billion 208.61 39.65 19.01% 35.92 17.22% 35.46 17.00%<br />
Between €30 billion and €100 billion 1,230.34 214.88 17.46% 196.42 15.96% 192.59 15.65%<br />
Between €100 billion and €200 billion 783.79 139.70 17.82% 121.52 15.50% 118.59 15.13%<br />
Between €200 billion and €300 billion 600.96 104.88 17.45% 87.10 14.49% 84.04 13.98%<br />
More than €300 billion 1,769.07 322.64 18.24% 261.53 14.78% 243.48 13.76%<br />
G-SIBs 2) 3,561.56 580.09 16.29% 486.83 13.67% 443.32 12.45%<br />
Total 8,154.33 1,401.84 17.19% 1,189.33 14.59% 1,117.49 13.70%<br />
Source: ECB.<br />
Notes: Significant institutions at the highest level of consolidation for which common reporting (COREP) and financial reporting (FINREP) are available.<br />
1) CET1 stands for Common Equity Tier 1.<br />
2) G-SIBs: global systemically important banks. Data based on the last available list of G-SIBs as published by the Financial Stability Board.<br />
Tier 1<br />
CET 1 1)<br />
<strong>Supervisory</strong> <strong>Banking</strong> <strong>Statistics</strong>, Third quarter 2016 50