

SPA 3e_ Teachers Edition _ Ch 6

Create successful ePaper yourself
Turn your PDF publications into a flip-book with our unique Google optimized e-Paper software.
406<br />
C H A P T E R 6 • Sampling Distributions<br />
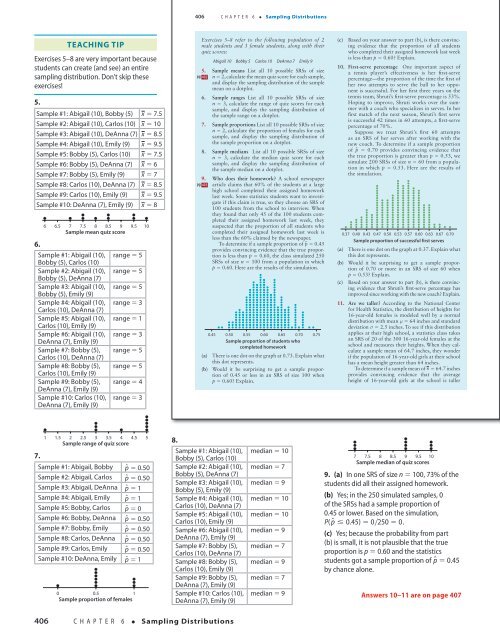
Exercises 5–8 refer to the following population of 2<br />
Teaching Tip<br />
male students and 3 female students, along with their<br />
quiz scores:<br />
Exercises 5–8 are very important because<br />
Abigail 10 Bobby 5 Carlos 10 DeAnna 7 Emily 9<br />
students can create (and see) an entire<br />
5. Sample means List all 10 possible SRSs of size<br />
sampling distribution. Don’t skip these<br />
pg 402 n 5 2, calculate the mean quiz score for each sample,<br />
and display the sampling distribution of the sample<br />
exercises!<br />
mean on a dotplot.<br />
6. Sample ranges List all 10 possible SRSs of size<br />
5.<br />
n 5 3, calculate the range of quiz scores for each<br />
sample, and display the sampling distribution of<br />
Sample #1: Abigail (10), Bobby (5) x 5 7.5<br />
the sample range on a dotplot.<br />
Sample #2: Abigail (10), Carlos (10) x 5 10<br />
7. Sample proportions List all 10 possible SRSs of size<br />
n 5 2, calculate the proportion of females for each<br />
Sample #3: Abigail (10), DeAnna (7) x 5 8.5<br />
sample, and display the sampling distribution of<br />
Sample #4: Abigail (10), Emily (9) x 5 9.5<br />
the sample proportion on a dotplot.<br />
8. Sample medians List all 10 possible SRSs of size<br />
Sample #5: Bobby (5), Carlos (10) x 5 7.5<br />
n 5 3, calculate the median quiz score for each<br />
Sample #6: Bobby (5), DeAnna (7) x 5 6<br />
sample, and display the sampling distribution of<br />
the sample median on a dotplot.<br />
Sample #7: Bobby (5), Emily (9) x 5 7<br />
9. Who does their homework? A school newspaper<br />
Sample #8: Carlos (10), DeAnna (7) x 5 8.5<br />
pg 403 article claims that 60% of the students at a large<br />
high school completed their assigned homework<br />
Sample #9: Carlos (10), Emily (9) x 5 9.5<br />
last week. Some statistics students want to investigate<br />
if this claim is true, so they choose an SRS of<br />
Sample #10: DeAnna (7), Emily (9) x 5 8<br />
100 students from the school to interview. When<br />
d d d<br />
they found that only 45 of the 100 students completed<br />
their assigned homework last week, they<br />
d d d d d d d<br />
6 6.5 7 7.5 8 8.5 9 9.5 10<br />
suspected that the proportion of all students who<br />
Sample mean quiz score<br />
completed their assigned homework last week is<br />
less than the 60% claimed by the newspaper.<br />
6.<br />
To determine if a sample proportion of p^ 5 0.45<br />
provides convincing evidence that the true proportion<br />
is less than p 5 0.60, the class simulated 250<br />
Sample #1: Abigail (10), range 5 5<br />
Bobby (5), Carlos (10)<br />
SRSs of size n 5 100 from a population in which<br />
p 5 0.60. Here are the results of the simulation.<br />
Sample #2: Abigail (10), range 5 5<br />
d<br />
d<br />
Bobby (5), DeAnna (7)<br />
d<br />
Sample #3: Abigail (10), range 5 5<br />
d d d d<br />
d d<br />
d d d<br />
Bobby (5), Emily (9)<br />
dddd d d d d<br />
d d d d<br />
ddd<br />
d d d d d<br />
d d d d d d<br />
d d d d d d d d<br />
d d d d d d d d<br />
d d d<br />
Sample #4: Abigail (10), range 5 3<br />
d d d<br />
d d d<br />
Carlos (10), DeAnna (7)<br />
d d d<br />
d d d dddd d d d d d<br />
d d d<br />
d d<br />
d<br />
d d d d<br />
d d d d d d<br />
d d d d d d d<br />
d d d d d d d d d d d d<br />
d d d d d d d d d d d d d d d<br />
d d d d d d d d d d d d d d d<br />
Sample #5: Abigail (10), range 5 1<br />
d d d d d d d d d d<br />
d d d d d d d d d<br />
d d d d d d d d d<br />
Carlos (10), Emily (9)<br />
dd dddddddddd dddddddddddddddd d dddddd d ddddddd<br />
d d d d d<br />
d d d d d d d d<br />
d d d d d d d d<br />
d dddddd d d dd d d d<br />
Sample #6: Abigail (10), range 5 3<br />
0.45 0.50 0.55 0.60 0.65 0.70 0.75<br />
DeAnna (7), Emily (9)<br />
Sample proportion of students who<br />
completed homework<br />
Sample #7: Bobby (5), range 5 5<br />
Carlos (10), DeAnna (7)<br />
(a) There is one dot on the graph at 0.73. Explain what<br />
this dot represents.<br />
Sample #8: Bobby (5), range 5 5<br />
(b) Would it be surprising to get a sample proportion<br />
of 0.45 or less in an SRS of size 100 when<br />
Carlos (10), Emily (9)<br />
Sample #9: Bobby (5), range 5 4<br />
p 5 0.60? Explain.<br />
DeAnna (7), Emily (9)<br />
Sample #10: Carlos (10), range 5 3<br />
DeAnna (7), Emily (9)<br />
d<br />
d dd<br />
d d d d<br />
1 1.5 2 2.5 3 3.5 4 4.5 5<br />
Starnes_<strong>3e</strong>_CH06_398-449_Final.indd 406<br />
Sample range of quiz score<br />
8.<br />
Sample #1: Abigail (10), median 5 10<br />
7.<br />
Bobby (5), Carlos (10)<br />
Sample #1: Abigail, Bobby p^ 5 0.50 Sample #2: Abigail (10), median 5 7<br />
Sample #2: Abigail, Carlos<br />
Bobby (5), DeAnna (7)<br />
p^ 5 0.50<br />
Sample #3: Abigail (10), median 5 9<br />
Sample #3: Abigail, DeAnna p^ 5 1<br />
Bobby (5), Emily (9)<br />
Sample #4: Abigail, Emily p^ 5 1<br />
Sample #4: Abigail (10), median 5 10<br />
Sample #5: Bobby, Carlos p^ 5 0<br />
Carlos (10), DeAnna (7)<br />
Sample #5: Abigail (10), median 5 10<br />
Sample #6: Bobby, DeAnna p^ 5 0.50 Carlos (10), Emily (9)<br />
Sample #7: Bobby, Emily p^ 5 0.50 Sample #6: Abigail (10), median 5 9<br />
Sample #8: Carlos, DeAnna p^ 5 0.50 DeAnna (7), Emily (9)<br />
Sample #9: Carlos, Emily Sample #7: Bobby (5), median 5 7<br />
p^ 5 0.50<br />
Carlos (10), DeAnna (7)<br />
Sample #10: DeAnna, Emily p^ 5 1<br />
Sample #8: Bobby (5), median 5 9<br />
Carlos (10), Emily (9)<br />
Sample #9: Bobby (5), median 5 7<br />
d d ddddd d dd DeAnna (7), Emily (9)<br />
0 0.5 1<br />
Sample #10: Carlos (10), median 5 9<br />
Sample proportion of females<br />
DeAnna (7), Emily (9)<br />
(c) Based on your answer to part (b), is there convincing<br />
evidence that the proportion of all students<br />
who completed their assigned homework last week<br />
is less than p 5 0.60? Explain.<br />
10. First-serve percentage One important aspect of<br />
a tennis player’s effectiveness is her first-serve<br />
percentage—the proportion of the time the first of<br />
her two attempts to serve the ball to her opponent<br />
is successful. For her first three years on the<br />
tennis team, Shruti’s first-serve percentage is 53%.<br />
Hoping to improve, Shruti works over the summer<br />
with a coach who specializes in serves. In her<br />
first match of the next season, Shruti’s first serve<br />
is successful 42 times in 60 attempts, a first-serve<br />
percentage of 70%.<br />
Suppose we treat Shruti’s first 60 attempts<br />
as an SRS of her serves after working with the<br />
new coach. To determine if a sample proportion<br />
of p^ 5 0.70 provides convincing evidence that<br />
the true proportion is greater than p 5 0.53, we<br />
simulate 200 SRSs of size n 5 60 from a population<br />
in which p 5 0.53. Here are the results of<br />
the simulation.<br />
d<br />
d<br />
d<br />
d<br />
d<br />
d<br />
d d<br />
d d<br />
d d d d<br />
d d d d<br />
d d d d<br />
d ddddddddd d d d d<br />
d d d d<br />
d d d d<br />
d d<br />
dd<br />
d d d d<br />
d d d d d d d<br />
d d d d d d d d<br />
d<br />
d d ddd d d d d d d d d<br />
d d d d d d d d d<br />
d d<br />
dd d d d d d d d d d d ddddddddddddddddd<br />
0.37 0.40 0.43 0.47 0.50 0.53 0.57 0.60 0.63 0.67 0.70<br />
Sample proportion of successful first serves<br />
d<br />
d<br />
d<br />
d<br />
d<br />
d<br />
d<br />
7 7.5 8 8.5 9 9.5 10<br />
Sample median of quiz scores<br />
9. (a) In one SRS of size n 5 100, 73% of the<br />
students did all their assigned homework.<br />
(b) Yes; in the 250 simulated samples, 0<br />
of the SRSs had a sample proportion of<br />
0.45 or lower. Based on the simulation,<br />
P( p^ ≤ 0.45) = 0∙250 = 0.<br />
(c) Yes; because the probability from part<br />
(b) is small, it is not plausible that the true<br />
proportion is p 5 0.60 and the statistics<br />
students got a sample proportion of p^ 5 0.45<br />
by chance alone.<br />
d d<br />
d<br />
d<br />
d<br />
d<br />
d<br />
d<br />
d<br />
d<br />
d<br />
d<br />
d<br />
d<br />
d<br />
d<br />
d<br />
d<br />
d<br />
d<br />
d<br />
d<br />
d<br />
d<br />
d<br />
d<br />
d<br />
d<br />
d<br />
d<br />
d<br />
d<br />
d<br />
d<br />
d<br />
d<br />
d<br />
d<br />
d<br />
d<br />
d<br />
d<br />
d<br />
d<br />
d<br />
d<br />
d<br />
d<br />
d<br />
d<br />
d<br />
d<br />
d<br />
d<br />
d<br />
d<br />
d<br />
d<br />
d<br />
d<br />
d<br />
d<br />
d<br />
d<br />
d<br />
d<br />
d<br />
d<br />
d<br />
d<br />
d<br />
d d d<br />
d d d d d<br />
(a) There is one dot on the graph at 0.37. Explain what<br />
this dot represents.<br />
(b) Would it be surprising to get a sample proportion<br />
of 0.70 or more in an SRS of size 60 when<br />
p 5 0.53? Explain.<br />
(c) Based on your answer to part (b), is there convincing<br />
evidence that Shruti’s first-serve percentage has<br />
improved since working with the new coach? Explain.<br />
11. Are we taller? According to the National Center<br />
for Health Statistics, the distribution of heights for<br />
16-year-old females is modeled well by a normal<br />
distribution with mean m 5 64 inches and standard<br />
deviation s 5 2.5 inches. To see if this distribution<br />
applies at their high school, a statistics class takes<br />
an SRS of 20 of the 300 16-year-old females at the<br />
school and measures their heights. When they calculate<br />
a sample mean of 64.7 inches, they wonder<br />
if the population of 16-year-old girls at their school<br />
has a mean height greater than 64 inches.<br />
To determine if a sample mean of x 5 64.7 inches<br />
provides convincing evidence that the average<br />
height of 16-year-old girls at the school is taller<br />
Answers 10–11 are on page 407<br />
18/08/16 4:59 PMStarnes_<strong>3e</strong>_CH0<br />
406<br />
C H A P T E R 6 • Sampling Distributions<br />
Starnes_<strong>3e</strong>_ATE_CH06_398-449_v3.indd 406<br />
11/01/17 3:53 PM

