

SPA 3e_ Teachers Edition _ Ch 6

Create successful ePaper yourself
Turn your PDF publications into a flip-book with our unique Google optimized e-Paper software.
ddd<br />
ddd<br />
dddd<br />
ddd<br />
ddd<br />
dd<br />
ddd<br />
ddd<br />
ddd<br />
Lesson 6.2<br />
Sampling Distributions:<br />
center and variability<br />
L e A r n i n g T A r g e T S<br />
d Determine if a statistic is an unbiased estimator of a population parameter.<br />
d Describe the relationship between sample size and the variability of a<br />
statistic.<br />
Learning Target Key<br />
The problems in the test bank are<br />
keyed to the learning targets using<br />
these numbers:<br />
d 6.2.1<br />
d 6.2.2<br />
Lesson 6.2<br />
AcT iviT y<br />
How many craft sticks are in the bag?<br />
In this activity, you will create a statistic for estimating<br />
the total number of craft sticks in a bag (N). The<br />
sticks are numbered 1, 2, 3, . . . , N. Near the end of the<br />
activity, your teacher will select a random sample of<br />
n 5 7 sticks and read the number on each stick to the<br />
class. The team that has the best estimate for the total<br />
number of sticks will win a prize.<br />
1. Form teams of three or four students. As a team,<br />
spend about 10 minutes brainstorming different<br />
ways to estimate the total number of sticks. Try to<br />
come up with at least three different statistics.<br />
2. Before your teacher provides the sample of sticks,<br />
use simulation to investigate the sampling distribution<br />
of each statistic. For the simulation, assume<br />
that there are N 5 100 sticks in the bag and that<br />
you will be selecting samples of size n 5 7.<br />
j Using your TI-83/84 calculator, select an SRS of<br />
size 7 using the command RandIntNoRep(lower:<br />
1,upper:100,n:7). [With older OS, use the command<br />
RandInt(lower:1,upper:100,n:7) and verify<br />
that there are no repeated numbers. If there are<br />
repeats, press ENTER to get a new sample.]<br />
j For each sample, calculate the value of each of<br />
your three statistics.<br />
Unbiased Estimators<br />
j<br />
j<br />
graph these values on a set of dotplots like those<br />
shown here.<br />
Perform as many trials of the simulation as possible.<br />
Statistic 3 Statistic 2 Statistic 1<br />
60<br />
70 80 90 100 110 120 130 140<br />
Estimated total<br />
3. Based on the simulated sampling distributions,<br />
which of your statistics is likely to produce the<br />
best estimate? Discuss as a team.<br />
4. Your teacher will now draw a sample of n 5 7<br />
sticks from the bag. On a piece of paper, write<br />
the names of your group members, your group’s<br />
estimate for the number of sticks in the bag (a<br />
number), and the statistic you used to calculate<br />
your estimate (a formula).<br />
In the craft sticks activity, the goal was to estimate the maximum value in a population,<br />
with the assumption that the members of the population are numbered 1, 2, . . . , N.<br />
Two possible statistics that might be used to estimate N are the sample maximum (max)<br />
and twice the sample median (2 3 median).<br />
Assuming that the population has N 5 100 members and we use SRSs of size n 5 7,<br />
Figure 6.2 shows the simulated sampling distributions of the sample maximum and<br />
twice the sample median.<br />
409<br />
Bell Ringer<br />
Suppose you wish to estimate the<br />
average (mean) height of all students at<br />
your school by taking a random sample<br />
of students and calculating the average<br />
height of the sample. Would you expect<br />
the sample mean to be closer to the<br />
true average height from a sample of<br />
4 students or 40 students?<br />
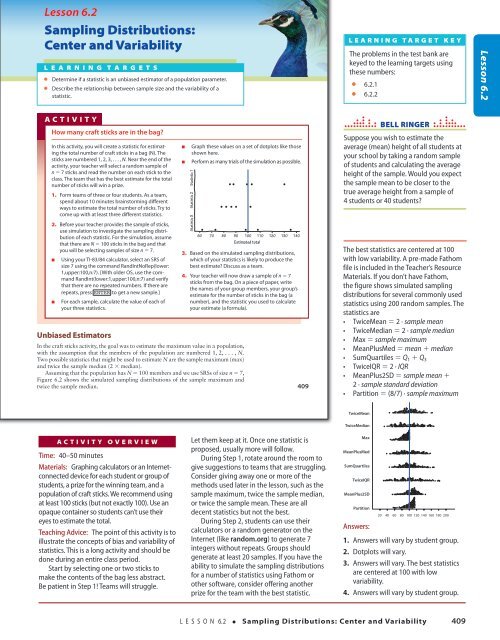
The best statistics are centered at 100<br />
with low variability. A pre-made Fathom<br />
file is included in the Teacher’s Resource<br />
Materials. If you don’t have Fathom,<br />
the figure shows simulated sampling<br />
distributions for several commonly used<br />
statistics using 200 random samples. The<br />
statistics are<br />
• TwiceMean 5 2 · sample mean<br />
• TwiceMedian 5 2 · sample median<br />
• Max 5 sample maximum<br />
• MeanPlusMed 5 mean 1 median<br />
• SumQuartiles 5 Q 1 1 Q 3<br />
• TwiceIQR 5 2 · IQR<br />
• MeanPlus2SD 5 sample mean 1<br />
2 · sample standard deviation<br />
• Partition 5 (8/7) · sample maximum<br />
TwiceMean<br />
d<br />
d<br />
dd dd ddd<br />
d<br />
dd<br />
d d ddd dddd d<br />
dd d<br />
ddddddddd<br />
dddd d d<br />
dd ddddd d<br />
dd d dd d ddd<br />
d<br />
18/08/16 4:59 PMStarnes_<strong>3e</strong>_CH06_398-449_Final.indd 409<br />
Activity Overview<br />
Time: 40–50 minutes<br />
Materials: Graphing calculators or an Internetconnected<br />
device for each student or group of<br />
students, a prize for the winning team, and a<br />
population of craft sticks. We recommend using<br />
at least 100 sticks (but not exactly 100). Use an<br />
opaque container so students can’t use their<br />
eyes to estimate the total.<br />
Teaching Advice: The point of this activity is to<br />
illustrate the concepts of bias and variability of<br />
statistics. This is a long activity and should be<br />
done during an entire class period.<br />
Start by selecting one or two sticks to<br />
make the contents of the bag less abstract.<br />
Be patient in Step 1! Teams will struggle.<br />
18/08/16 4:59 PM<br />
Let them keep at it. Once one statistic is<br />
proposed, usually more will follow.<br />
During Step 1, rotate around the room to<br />
give suggestions to teams that are struggling.<br />
Consider giving away one or more of the<br />
methods used later in the lesson, such as the<br />
sample maximum, twice the sample median,<br />
or twice the sample mean. These are all<br />
decent statistics but not the best.<br />
During Step 2, students can use their<br />
calculators or a random generator on the<br />
Internet (like random.org) to generate 7<br />
integers without repeats. Groups should<br />
generate at least 20 samples. If you have the<br />
ability to simulate the sampling distributions<br />
for a number of statistics using Fathom or<br />
other software, consider offering another<br />
prize for the team with the best statistic.<br />
TwiceMedian<br />
Max<br />
MeanPlusMed<br />
SumQuartiles<br />
TwiceIQR<br />
MeanPlus2SD<br />
Partition<br />
d<br />
d<br />
dddd<br />
d d<br />
d ddd dd<br />
ddd ddd dd<br />
ddd ddd dddd dd d dd d d dddddddd ddd<br />
d dddd ddd d dd dd<br />
d<br />
dd<br />
dd<br />
d<br />
ddd<br />
d<br />
d<br />
dddd dd<br />
ddd<br />
ddddd d<br />
d d ddddddd ddddddddd d d<br />
dd ddddd<br />
d<br />
d d dd dd dddd<br />
dddd ddd<br />
dddd d ddd dd d dd d d<br />
d<br />
dd<br />
d d dd<br />
d<br />
ddddddd dd ddddddd d dd<br />
dd<br />
dd ddd<br />
dd d d ddd d dd d<br />
ddd<br />
dd<br />
d ddd d<br />
dd<br />
d dd<br />
dd<br />
ddd<br />
dddd<br />
ddddd<br />
d<br />
ddd dd d ddddd d ddd ddd dd d ddd<br />
d d dddd<br />
d<br />
d<br />
ddddd<br />
dddd d d dd ddd<br />
ddddddddd ddd d<br />
dd<br />
ddddd dddd ddddddddddd ddddd<br />
d 20 40 60 80 100 120 140 160 180 200<br />
ddd<br />
d dddd dd dddd dd dd<br />
dddd d<br />
ddddd d<br />
ddd dd<br />
ddd d<br />
dd ddd dddd<br />
dddddddd d ddddd dddd dddddddd<br />
d<br />
d dd ddd<br />
d<br />
dd d<br />
ddd<br />
dd d dd d<br />
Answers:<br />
1. Answers will vary by student group.<br />
2. Dotplots will vary.<br />
3. Answers will vary. The best statistics<br />
are centered at 100 with low<br />
variability.<br />
4. Answers will vary by student group.<br />
dd<br />
d<br />
d<br />
d<br />
ddd dd<br />
dd<br />
dd<br />
d<br />
dd<br />
dd d d<br />
d<br />
ddd<br />
L E S S O N 6.2 • Sampling Distributions: Center and Variability 409<br />
Starnes_<strong>3e</strong>_ATE_CH06_398-449_v3.indd 409<br />
11/01/17 3:54 PM

