

SPA 3e_ Teachers Edition _ Ch 6

Create successful ePaper yourself
Turn your PDF publications into a flip-book with our unique Google optimized e-Paper software.
<strong>Ch</strong>apter 6 Practice Test<br />
449<br />
8. Scores on the mathematics part of the SAT exam in a<br />
recent year followed a normal distribution with mean<br />
515 and standard deviation 114. You choose an SRS<br />
of 100 students and calculate x5 mean SAT Math<br />
score. Which of the following are the mean and standard<br />
deviation of the sampling distribution of x?<br />
(a) Mean 5 515, SD 5 114<br />
114<br />
(b) Mean 5 515, SD 5<br />
"100<br />
(c) Mean 5 515 114<br />
, SD 5<br />
100 100<br />
(d) Mean 5 515<br />
100 , SD 5 114<br />
"100<br />
9. In a congressional district, 55% of the registered voters<br />
are Democrats. Which of the following is closest to<br />
the probability of getting less than 50% Democrats in<br />
a random sample of size 100?<br />
(a) 0.157 (b) 0.496 (c) 0.504 (d) 0.843<br />
10. A statistic is an unbiased estimator of a parameter<br />
when<br />
(a) the statistic is calculated from a random sample.<br />
(b) in all possible samples of a specific size, the distribution<br />
of the statistic has a shape that is approximately<br />
normal.<br />
(c) in all possible samples of a specific size, the values of<br />
the statistic are very close to the value of the parameter.<br />
(d) in all possible samples of a specific size, the values of<br />
the statistic are centered at the value of the parameter.<br />
Section II: Free Response<br />
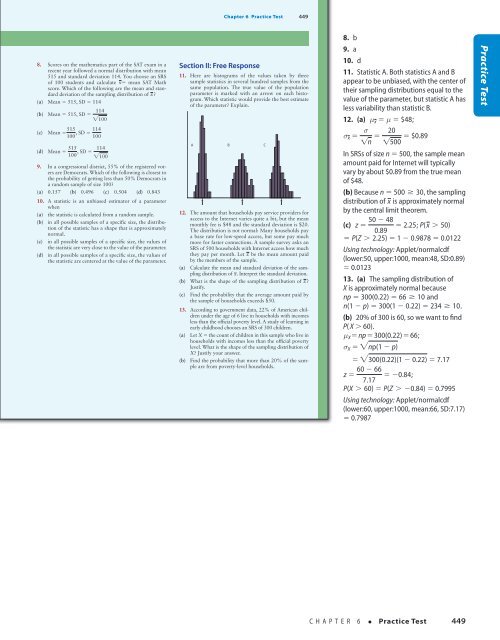
11. Here are histograms of the values taken by three<br />
sample statistics in several hundred samples from the<br />
same population. The true value of the population<br />
parameter is marked with an arrow on each histogram.<br />
Which statistic would provide the best estimate<br />
of the parameter? Explain.<br />
A B C<br />
12. The amount that households pay service providers for<br />
access to the Internet varies quite a bit, but the mean<br />
monthly fee is $48 and the standard deviation is $20.<br />
The distribution is not normal: Many households pay<br />
a base rate for low-speed access, but some pay much<br />
more for faster connections. A sample survey asks an<br />
SRS of 500 households with Internet access how much<br />
they pay per month. Let x be the mean amount paid<br />
by the members of the sample.<br />
(a) Calculate the mean and standard deviation of the sampling<br />
distribution of x. Interpret the standard deviation.<br />
(b) What is the shape of the sampling distribution of x?<br />
Justify.<br />
(c) Find the probability that the average amount paid by<br />
the sample of households exceeds $50.<br />
13. According to government data, 22% of American children<br />
under the age of 6 live in households with incomes<br />
less than the official poverty level. A study of learning in<br />
early childhood chooses an SRS of 300 children.<br />
(a) Let X 5 the count of children in this sample who live in<br />
households with incomes less than the official poverty<br />
level. What is the shape of the sampling distribution of<br />
X? Justify your answer.<br />
(b) Find the probability that more than 20% of the sample<br />
are from poverty-level households.<br />
8. b<br />
9. a<br />
10. d<br />
11. Statistic A. Both statistics A and B<br />
appear to be unbiased, with the center of<br />
their sampling distributions equal to the<br />
value of the parameter, but statistic A has<br />
less variability than statistic B.<br />
12. (a) m x = m = $48;<br />
s x = s !n = 20<br />
!500 = $0.89<br />
In SRSs of size n 5 500, the sample mean<br />
amount paid for Internet will typically<br />
vary by about $0.89 from the true mean<br />
of $48.<br />
(b) Because n = 500 ≥ 30, the sampling<br />
distribution of x is approximately normal<br />
by the central limit theorem.<br />
50 − 48<br />
(c) z = = 2.25; P( x > 50)<br />
0.89<br />
= P(Z > 2.25) = 1 − 0.9878 = 0.0122<br />
Using technology: Applet/normalcdf<br />
(lower:50, upper:1000, mean:48, SD:0.89)<br />
5 0.0123<br />
13. (a) The sampling distribution of<br />
X is approximately normal because<br />
np = 300(0.22) = 66 ≥ 10 and<br />
n(1 − p) = 300(1 − 0.22) = 234 ≥ 10.<br />
(b) 20% of 300 is 60, so we want to find<br />
P( X > 60).<br />
m X = np = 300(0.22) = 66;<br />
s X = "np(1 − p)<br />
= "300(0.22)(1 − 0.22) = 7.17<br />
60 − 66<br />
z = = −0.84;<br />
7.17<br />
P(X > 60) = P(Z > −0.84) = 0.7995<br />
Using technology: Applet/normalcdf<br />
(lower:60, upper:1000, mean:66, SD:7.17)<br />
5 0.7987<br />
Practice Test<br />
18/08/16 5:04 PMStarnes_<strong>3e</strong>_CH06_398-449_Final.indd 449<br />
18/08/16 5:04 PM<br />
C H A P T E R 6 • Practice Test 449<br />
Starnes_<strong>3e</strong>_ATE_CH06_398-449_v3.indd 449<br />
11/01/17 3:58 PM

