

SPA 3e_ Teachers Edition _ Ch 6

Create successful ePaper yourself
Turn your PDF publications into a flip-book with our unique Google optimized e-Paper software.
L E S S O N 6.5 • The Sampling Distribution of a Sample Mean 433<br />
DEFINITION Sampling distribution of the sample mean x<br />
The sampling distribution of the sample mean x describes the distribution of values taken<br />
by the sample mean x in all possible samples of the same size from the same population.<br />
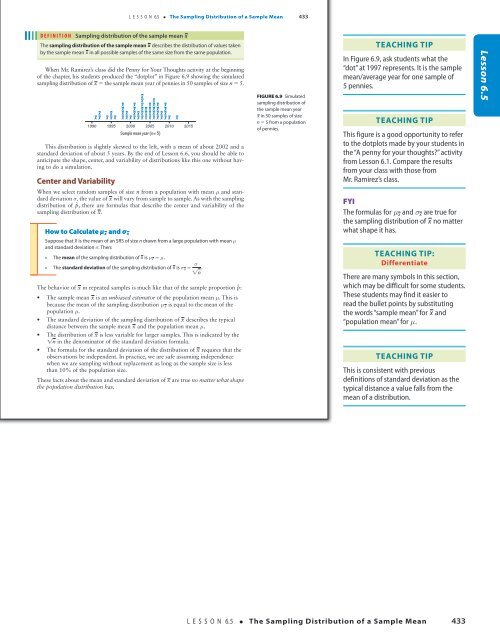
When Mr. Ramirez’s class did the Penny for Your Thoughts activity at the beginning<br />
of the chapter, his students produced the “dotplot” in Figure 6.9 showing the simulated<br />
sampling distribution of x 5 the sample mean year of pennies in 50 samples of size n 5 5.<br />
x<br />
xx<br />
xxxxxx<br />
x<br />
x<br />
x<br />
1990 1995 2000 2005 2010 2015<br />
Sample mean year (n = 5)<br />
This distribution is slightly skewed to the left, with a mean of about 2002 and a<br />
standard deviation of about 5 years. By the end of Lesson 6.6, you should be able to<br />
anticipate the shape, center, and variability of distributions like this one without having<br />
to do a simulation.<br />
Center and Variability<br />
When we select random samples of size n from a population with mean m and standard<br />
deviation s, the value of x will vary from sample to sample. As with the sampling<br />
distribution of p^ , there are formulas that describe the center and variability of the<br />
sampling distribution of x.<br />
How to Calculate μ x and σ x<br />
Suppose that x is the mean of an SRS of size n drawn from a large population with mean m<br />
and standard deviation s. Then:<br />
• The mean of the sampling distribution of x is m x = m.<br />
• The standard deviation of the sampling distribution of x is s x = s "n .<br />
The behavior of x in repeated samples is much like that of the sample proportion p^ :<br />
• The sample mean x is an unbiased estimator of the population mean m. This is<br />
because the mean of the sampling distribution m x is equal to the mean of the<br />
population m.<br />
• The standard deviation of the sampling distribution of x describes the typical<br />
distance between the sample mean x and the population mean m.<br />
• The distribution of x is less variable for larger samples. This is indicated by the<br />
!n in the denominator of the standard deviation formula.<br />
• The formula for the standard deviation of the distribution of x requires that the<br />
observations be independent. In practice, we are safe assuming independence<br />
when we are sampling without replacement as long as the sample size is less<br />
than 10% of the population size.<br />
These facts about the mean and standard deviation of x are true no matter what shape<br />
the population distribution has.<br />
FigUre 6.9 Simulated<br />
sampling distribution of<br />
the sample mean year<br />
x in 50 samples of size<br />
n 5 5 from a population<br />
of pennies.<br />
Teaching Tip<br />
In Figure 6.9, ask students what the<br />
“dot” at 1997 represents. It is the sample<br />
mean/average year for one sample of<br />
5 pennies.<br />
Teaching Tip<br />
This figure is a good opportunity to refer<br />
to the dotplots made by your students in<br />
the “A penny for your thoughts?” activity<br />
from Lesson 6.1. Compare the results<br />
from your class with those from<br />
Mr. Ramirez’s class.<br />
FYI<br />
The formulas for m x and s x are true for<br />
the sampling distribution of x no matter<br />
what shape it has.<br />
Teaching Tip:<br />
Differentiate<br />
There are many symbols in this section,<br />
which may be difficult for some students.<br />
These students may find it easier to<br />
read the bullet points by substituting<br />
the words “sample mean” for x and<br />
“population mean” for m.<br />
Teaching Tip<br />
This is consistent with previous<br />
definitions of standard deviation as the<br />
typical distance a value falls from the<br />
mean of a distribution.<br />
Lesson 6.5<br />
18/08/16 5:02 PMStarnes_<strong>3e</strong>_CH06_398-449_Final.indd 433<br />
18/08/16 5:02 PM<br />
L E S S O N 6.5 • The Sampling Distribution of a Sample Mean 433<br />
Starnes_<strong>3e</strong>_ATE_CH06_398-449_v3.indd 433<br />
11/01/17 3:56 PM

