

SPA 3e_ Teachers Edition _ Ch 6

You also want an ePaper? Increase the reach of your titles
YUMPU automatically turns print PDFs into web optimized ePapers that Google loves.
L E S S O N 6.1 • What Is a Sampling Distribution? 407<br />
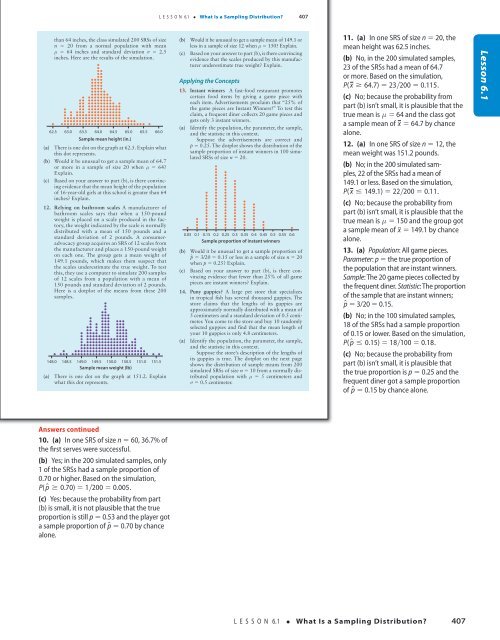
than 64 inches, the class simulated 200 SRSs of size<br />
n 5 20 from a normal population with mean<br />
m 5 64 inches and standard deviation s 5 2.5<br />
inches. Here are the results of the simulation.<br />
d<br />
d<br />
d<br />
d d<br />
d d<br />
d d<br />
d d d d<br />
d d d d<br />
d d d d<br />
d d d d<br />
d d d d d<br />
d d d d d d<br />
d d d d d d d d d<br />
d d d d d d d d d d<br />
d d d d d d d d d d d d<br />
d d d d d d d d d d d d d<br />
d d d d d d d d d d d d d d<br />
d d d d d d d d d d d d d d d d<br />
d d d d d d d d d d d d d d d d d<br />
d d d d d d d d d d d d d d d d d d d d<br />
d d d d d d d d d d d d d d d d d d d d d d d d<br />
d d d d d d d d d d d d d d d d d d d d d d d d dddd<br />
62.5 63.0 63.5 64.0 64.5 65.0 65.5 66.0<br />
Sample mean height (in.)<br />
(a) There is one dot on the graph at 62.5. Explain what<br />
this dot represents.<br />
(b) Would it be unusual to get a sample mean of 64.7<br />
or more in a sample of size 20 when m 5 64?<br />
Explain.<br />
(c) Based on your answer to part (b), is there convincing<br />
evidence that the mean height of the population<br />
of 16-year-old girls at this school is greater than 64<br />
inches? Explain.<br />
12. Relying on bathroom scales A manufacturer of<br />
bathroom scales says that when a 150-pound<br />
weight is placed on a scale produced in the factory,<br />
the weight indicated by the scale is normally<br />
distributed with a mean of 150 pounds and a<br />
standard deviation of 2 pounds. A consumeradvocacy<br />
group acquires an SRS of 12 scales from<br />
the manufacturer and places a 150-pound weight<br />
on each one. The group gets a mean weight of<br />
149.1 pounds, which makes them suspect that<br />
the scales underestimate the true weight. To test<br />
this, they use a computer to simulate 200 samples<br />
of 12 scales from a population with a mean of<br />
150 pounds and standard deviation of 2 pounds.<br />
Here is a dotplot of the means from these 200<br />
samples.<br />
d<br />
d<br />
d d<br />
d<br />
d<br />
d<br />
d<br />
d d<br />
d d d<br />
d d d d<br />
d d d d d d d<br />
d d d d d d d d<br />
d d d d d d d d d<br />
d d d d d d d d d d<br />
d d d d d d d d d d d d<br />
d d d d d d d d d d d d d<br />
d d d d d d d d d d d d d d d d<br />
d d d d d d d d d d d d d d d d d<br />
d d d d d d d d d d d d d d d d d d d<br />
d d d d d d d d d d d d d d d d d d d d<br />
d d d d d d d d d d d d d d d d d d d d d d d d<br />
d d d d d d d d d d d d d d d d d d d d d d d d dd d d<br />
148.0 148.5 149.0 149.5 150.0 150.5 151.0 151.5<br />
Sample mean weight (lb)<br />
(a) There is one dot on the graph at 151.2. Explain<br />
what this dot represents.<br />
d<br />
(b) Would it be unusual to get a sample mean of 149.1 or<br />
less in a sample of size 12 when m 5 150? Explain.<br />
(c) Based on your answer to part (b), is there convincing<br />
evidence that the scales produced by this manufacturer<br />
underestimate true weight? Explain.<br />
Applying the Concepts<br />
13. Instant winners A fast-food restaurant promotes<br />
certain food items by giving a game piece with<br />
each item. Advertisements proclaim that “25% of<br />
the game pieces are Instant Winners!” To test this<br />
claim, a frequent diner collects 20 game pieces and<br />
gets only 3 instant winners.<br />
(a) Identify the population, the parameter, the sample,<br />
and the statistic in this context.<br />
Suppose the advertisements are correct and<br />
p 5 0.25. The dotplot shows the distribution of the<br />
sample proportion of instant winners in 100 simulated<br />
SRSs of size n 5 20.<br />
d<br />
d<br />
d<br />
d<br />
d<br />
d<br />
d<br />
d<br />
d<br />
d<br />
d<br />
d<br />
d<br />
d<br />
d<br />
d<br />
d<br />
d<br />
d<br />
d<br />
d<br />
d<br />
d<br />
d<br />
d<br />
d<br />
d<br />
d<br />
d<br />
d<br />
d<br />
d<br />
d<br />
d<br />
d<br />
d<br />
d<br />
d<br />
d<br />
d<br />
d<br />
d<br />
d<br />
d<br />
d<br />
d<br />
d<br />
d<br />
d<br />
d<br />
d<br />
d<br />
d<br />
d<br />
d<br />
d<br />
d<br />
d<br />
d<br />
d<br />
d<br />
d<br />
d<br />
d<br />
d<br />
d<br />
d<br />
d<br />
d<br />
d<br />
d<br />
d<br />
d<br />
d<br />
d<br />
d<br />
d<br />
0.05 0.1 0.15 0.2 0.25 0.3 0.35 0.4 0.45 0.5 0.55 0.6<br />
Sample proportion of instant winners<br />
(b) Would it be unusual to get a sample proportion of<br />
p^ 5 3/20 5 0.15 or less in a sample of size n 5 20<br />
when p 5 0.25? Explain.<br />
(c) Based on your answer to part (b), is there convincing<br />
evidence that fewer than 25% of all game<br />
pieces are instant winners? Explain.<br />
14. Puny guppies? A large pet store that specializes<br />
in tropical fish has several thousand guppies. The<br />
store claims that the lengths of its guppies are<br />
approximately normally distributed with a mean of<br />
5 centimeters and a standard deviation of 0.5 centimeter.<br />
You come to the store and buy 10 randomly<br />
selected guppies and find that the mean length of<br />
your 10 guppies is only 4.8 centimeters.<br />
(a) Identify the population, the parameter, the sample,<br />
and the statistic in this context.<br />
Suppose the store’s description of the lengths of<br />
its guppies is true. The dotplot on the next page<br />
shows the distribution of sample means from 200<br />
simulated SRSs of size n 5 10 from a normally distributed<br />
population with m 5 5 centimeters and<br />
s 5 0.5 centimeter.<br />
d<br />
d<br />
d<br />
d<br />
d<br />
d<br />
d<br />
d<br />
d<br />
d<br />
d<br />
d<br />
d<br />
d<br />
d<br />
d<br />
d<br />
d<br />
d<br />
d<br />
d<br />
d<br />
d<br />
11. (a) In one SRS of size n 5 20, the<br />
mean height was 62.5 inches.<br />
(b) No, in the 200 simulated samples,<br />
23 of the SRSs had a mean of 64.7<br />
or more. Based on the simulation,<br />
P( x ≥ 64.7) = 23∙200 = 0.115.<br />
(c) No; because the probability from<br />
part (b) isn’t small, it is plausible that the<br />
true mean is m 5 64 and the class got<br />
a sample mean of x 5 64.7 by chance<br />
alone.<br />
12. (a) In one SRS of size n 5 12, the<br />
mean weight was 151.2 pounds.<br />
(b) No; in the 200 simulated samples,<br />
22 of the SRSs had a mean of<br />
149.1 or less. Based on the simulation,<br />
P( x ≤ 149.1) = 22∙200 = 0.11.<br />
(c) No; because the probability from<br />
part (b) isn’t small, it is plausible that the<br />
true mean is m 5 150 and the group got<br />
a sample mean of x 5 149.1 by chance<br />
alone.<br />
13. (a) Population: All game pieces.<br />
Parameter: p 5 the true proportion of<br />
the population that are instant winners.<br />
Sample: The 20 game pieces collected by<br />
the frequent diner. Statistic: The proportion<br />
of the sample that are instant winners;<br />
p^ 5 3/20 5 0.15.<br />
(b) No; in the 100 simulated samples,<br />
18 of the SRSs had a sample proportion<br />
of 0.15 or lower. Based on the simulation,<br />
P( p^ ≤ 0.15) = 18∙100 = 0.18.<br />
(c) No; because the probability from<br />
part (b) isn’t small, it is plausible that<br />
the true proportion is p 5 0.25 and the<br />
frequent diner got a sample proportion<br />
of p^ 5 0.15 by chance alone.<br />
Lesson 6.1<br />
18/08/16 4:59 PMStarnes_<strong>3e</strong>_CH06_398-449_Final.indd 407<br />
Answers continued<br />
10. (a) In one SRS of size n 5 60, 36.7% of<br />
the first serves were successful.<br />
(b) Yes; in the 200 simulated samples, only<br />
1 of the SRSs had a sample proportion of<br />
0.70 or higher. Based on the simulation,<br />
P( p^ ≥ 0.70) = 1∙200 = 0.005.<br />
(c) Yes; because the probability from part<br />
(b) is small, it is not plausible that the true<br />
proportion is still p 5 0.53 and the player got<br />
a sample proportion of p^ 5 0.70 by chance<br />
alone.<br />
18/08/16 4:59 PM<br />
L E S S O N 6.1 • What Is a Sampling Distribution? 407<br />
Starnes_<strong>3e</strong>_ATE_CH06_398-449_v3.indd 407<br />
11/01/17 3:53 PM

