Maintworld 3/2017
In this issue: Using Technology and Innovation to Manage Mega-Maintenance Challenges Identify the Root Cause of a Misalignment Condition Elements of a Good Preventive Maintenance Program
In this issue:
Using Technology and Innovation to Manage Mega-Maintenance Challenges
Identify the Root Cause of a Misalignment Condition
Elements of a Good Preventive Maintenance Program

Create successful ePaper yourself
Turn your PDF publications into a flip-book with our unique Google optimized e-Paper software.
CONDITION MONITORING<br />
How Do I Get Started?<br />
There are two common questions that<br />
many first-time users of ultrasound<br />
have. The first is, “How do I set baselines?”<br />
The second is, “How do I know if<br />
what I’m listening to is good or bad?”<br />
The Comparison Method<br />
One way to get a quick idea as to what is<br />
good and what is bad is by using the comparison<br />
approach. With this method, the<br />
inspector simply compares the decibel<br />
level readings at identical points on<br />
identical machines. Using this method,<br />
the inspector also begins to “train”<br />
their ear as to what rotating equipment<br />
sounds like, and it will become obvious<br />
that a bearing with a particular fault<br />
such as an inner race, or outer race defect,<br />
will sound much different than a<br />
bearing that is in a “good” condition.<br />
The baseline can then be set based on<br />
an average of decibel levels at the compared<br />
points. The software may even<br />
default to the first reading taken and<br />
downloaded. The baseline can then be<br />
changed as more readings are collected.<br />
The Historical Method<br />
The historical method is the preferred<br />
method for establishing baselines and<br />
alarm levels in bearing condition monitoring<br />
routes. Using this method, the inspector<br />
first establishes a route or database<br />
in the ultrasound software. The database<br />
is then loaded into the ultrasonic<br />
instrument. Data is then collected at the<br />
various points along the route. When the<br />
initial round of data has been collected,<br />
it may be necessary to collect data more<br />
frequently than needed in order to build<br />
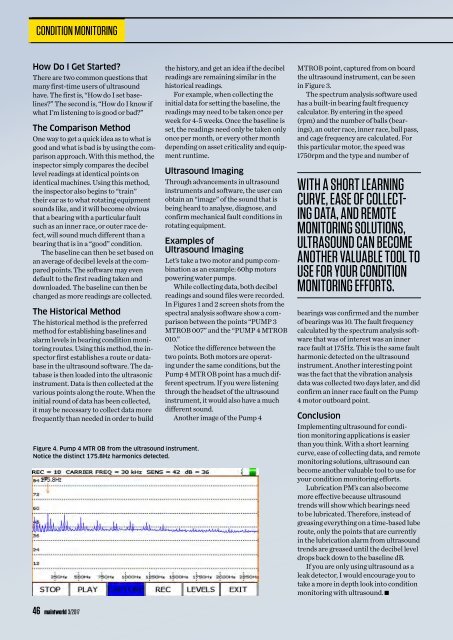
Figure 4. Pump 4 MTR OB from the ultrasound instrument.<br />
Notice the distinct 175.8Hz harmonics detected.<br />
the history, and get an idea if the decibel<br />
readings are remaining similar in the<br />
historical readings.<br />
For example, when collecting the<br />
initial data for setting the baseline, the<br />
readings may need to be taken once per<br />
week for 4-5 weeks. Once the baseline is<br />
set, the readings need only be taken only<br />
once per month, or every other month<br />
depending on asset criticality and equipment<br />
runtime.<br />
Ultrasound Imaging<br />
Through advancements in ultrasound<br />
instruments and software, the user can<br />
obtain an “image” of the sound that is<br />
being heard to analyse, diagnose, and<br />
confirm mechanical fault conditions in<br />
rotating equipment.<br />
Examples of<br />
Ultrasound Imaging<br />
Let’s take a two motor and pump combination<br />
as an example: 60hp motors<br />
powering water pumps.<br />
While collecting data, both decibel<br />
readings and sound files were recorded.<br />
In Figures 1 and 2 screen shots from the<br />
spectral analysis software show a comparison<br />
between the points “PUMP 3<br />
MTROB 007” and the “PUMP 4 MTROB<br />
010.”<br />
Notice the difference between the<br />
two points. Both motors are operating<br />
under the same conditions, but the<br />
Pump 4 MTR OB point has a much different<br />
spectrum. If you were listening<br />
through the headset of the ultrasound<br />
instrument, it would also have a much<br />
different sound.<br />
Another image of the Pump 4<br />
MTROB point, captured from on board<br />
the ultrasound instrument, can be seen<br />
in Figure 3.<br />
The spectrum analysis software used<br />
has a built-in bearing fault frequency<br />
calculator. By entering in the speed<br />
(rpm) and the number of balls (bearings),<br />
an outer race, inner race, ball pass,<br />
and cage frequency are calculated. For<br />
this particular motor, the speed was<br />
1750rpm and the type and number of<br />
WITH A SHORT LEARNING<br />
CURVE, EASE OF COLLECT-<br />
ING DATA, AND REMOTE<br />
MONITORING SOLUTIONS,<br />
ULTRASOUND CAN BECOME<br />
ANOTHER VALUABLE TOOL TO<br />
USE FOR YOUR CONDITION<br />
MONITORING EFFORTS.<br />
bearings was confirmed and the number<br />
of bearings was 10. The fault frequency<br />
calculated by the spectrum analysis software<br />
that was of interest was an inner<br />
race fault at 175Hz. This is the same fault<br />
harmonic detected on the ultrasound<br />
instrument. Another interesting point<br />
was the fact that the vibration analysis<br />
data was collected two days later, and did<br />
confirm an inner race fault on the Pump<br />
4 motor outboard point.<br />
Conclusion<br />
Implementing ultrasound for condition<br />
monitoring applications is easier<br />
than you think. With a short learning<br />
curve, ease of collecting data, and remote<br />
monitoring solutions, ultrasound can<br />
become another valuable tool to use for<br />
your condition monitoring efforts.<br />
Lubrication PM’s can also become<br />
more effective because ultrasound<br />
trends will show which bearings need<br />
to be lubricated. Therefore, instead of<br />
greasing everything on a time-based lube<br />
route, only the points that are currently<br />
in the lubrication alarm from ultrasound<br />
trends are greased until the decibel level<br />
drops back down to the baseline dB.<br />
If you are only using ultrasound as a<br />
leak detector, I would encourage you to<br />
take a more in depth look into condition<br />
monitoring with ultrasound.<br />
46 maintworld 3/<strong>2017</strong>