HELP Hydrocarbon Exploration and Licensing Policy

You also want an ePaper? Increase the reach of your titles
YUMPU automatically turns print PDFs into web optimized ePapers that Google loves.
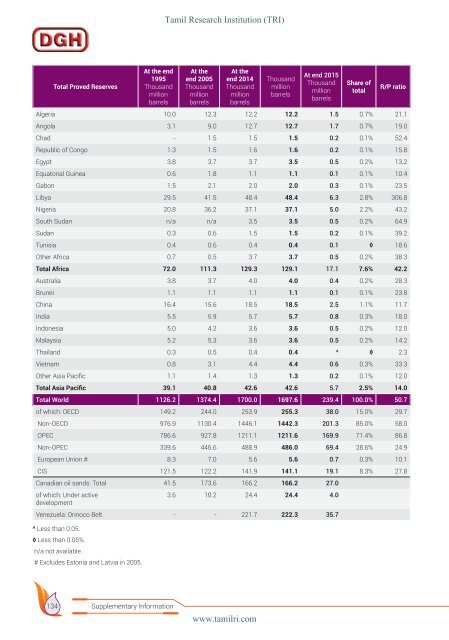
Tamil Research Institution (TRI)<br />
Total Proved Reserves<br />
At the end<br />
1995<br />
Thous<strong>and</strong><br />
million<br />
barrels<br />
At the<br />
end 2005<br />
Thous<strong>and</strong><br />
million<br />
barrels<br />
At the<br />
end 2014<br />
Thous<strong>and</strong><br />
million<br />
barrels<br />
Thous<strong>and</strong><br />
million<br />
barrels<br />
At end 2015<br />
Thous<strong>and</strong><br />
million<br />
barrels<br />
Share of<br />
total<br />
R/P ratio<br />
Algeria 10.0 12.3 12.2 12.2 1.5 0.7% 21.1<br />
Angola 3.1 9.0 12.7 12.7 1.7 0.7% 19.0<br />
Chad - 1.5 1.5 1.5 0.2 0.1% 52.4<br />
Republic of Congo 1.3 1.5 1.6 1.6 0.2 0.1% 15.8<br />
Egypt 3.8 3.7 3.7 3.5 0.5 0.2% 13.2<br />
Equatorial Guinea 0.6 1.8 1.1 1.1 0.1 0.1% 10.4<br />
Gabon 1.5 2.1 2.0 2.0 0.3 0.1% 23.5<br />
Libya 29.5 41.5 48.4 48.4 6.3 2.8% 306.8<br />
Nigeria 20.8 36.2 37.1 37.1 5.0 2.2% 43.2<br />
South Sudan n/a n/a 3.5 3.5 0.5 0.2% 64.9<br />
Sudan 0.3 0.6 1.5 1.5 0.2 0.1% 39.2<br />
Tunisia 0.4 0.6 0.4 0.4 0.1 ◊ 18.6<br />
Other Africa 0.7 0.5 3.7 3.7 0.5 0.2% 38.3<br />
Total Africa 72.0 111.3 129.3 129.1 17.1 7.6% 42.2<br />
Australia 3.8 3.7 4.0 4.0 0.4 0.2% 28.3<br />
Brunei 1.1 1.1 1.1 1.1 0.1 0.1% 23.8<br />
China 16.4 15.6 18.5 18.5 2.5 1.1% 11.7<br />
India 5.5 5.9 5.7 5.7 0.8 0.3% 18.0<br />
Indonesia 5.0 4.2 3.6 3.6 0.5 0.2% 12.0<br />
Malaysia 5.2 5.3 3.6 3.6 0.5 0.2% 14.2<br />
Thail<strong>and</strong> 0.3 0.5 0.4 0.4 ^ ◊ 2.3<br />
Vietnam 0.8 3.1 4.4 4.4 0.6 0.3% 33.3<br />
Other Asia Pacific 1.1 1.4 1.3 1.3 0.2 0.1% 12.0<br />
Total Asia Pacific 39.1 40.8 42.6 42.6 5.7 2.5% 14.0<br />
Total World 1126.2 1374.4 1700.0 1697.6 239.4 100.0% 50.7<br />
of which: OECD 149.2 244.0 253.9 255.3 38.0 15.0% 29.7<br />
Non-OECD 976.9 1130.4 1446.1 1442.3 201.3 85.0% 58.0<br />
OPEC 786.6 927.8 1211.1 1211.6 169.9 71.4% 86.8<br />
Non-OPEC 339.6 446.6 488.9 486.0 69.4 28.6% 24.9<br />
European Union # 8.3 7.0 5.6 5.6 0.7 0.3% 10.1<br />
CIS 121.5 122.2 141.9 141.1 19.1 8.3% 27.8<br />
Canadian oil s<strong>and</strong>s: Total 41.5 173.6 166.2 166.2 27.0<br />
of which: Under active<br />
development<br />
3.6 10.2 24.4 24.4 4.0<br />
Venezuela: Orinoco Belt - - 221.7 222.3 35.7<br />
^ Less than 0.05.<br />
◊ Less than 0.05%.<br />
n/a not available.<br />
# Excludes Estonia <strong>and</strong> Latvia in 2005.<br />
134<br />
Supplementary Information<br />
www.tamilri.com