

Biennial Report 2016/2017

Create successful ePaper yourself
Turn your PDF publications into a flip-book with our unique Google optimized e-Paper software.
<strong>Report</strong>s<br />
less energetic or less numerous), Fig. 3 shows<br />
the orientation dependent excess power density,<br />
i.e. corrected for the background, for nitrogen gas<br />
and steel substrate using two passive thermal<br />
probes with different acceptance angles.<br />
Additionally, calculated values for a point source<br />
are provided. As can be clearly seen, the<br />
measured flux is arriving directly from the<br />
direction of the substrate with the angular<br />
dependence following a cosine function. Thus, a<br />
point source is present and any power density<br />
arriving not directly from the substrate is rather<br />
weak (5 mW/cm 2 or less) and could be well within<br />
variations of the local plasma environment.<br />
As the plasma is generated at the top of the<br />
chamber above the substrate and is diffusing out<br />
from there, local density gradients will be present,<br />
which will translate into a variation of directional,<br />
local power density from the plasma. Rotating the<br />
probe without HV leads to a similar variation of<br />
the baseline intensity by 5 – 10%.<br />
For a next step, the variation of the pulse voltage<br />
for different pulse frequencies (nitrogen, Cu<br />
substrate) was performed. An increase faster than<br />
linear is observed for the increasing pulse voltage,<br />
especially for the highest voltage of 5 kV which<br />
corresponds to a combination of increased<br />
secondary electron energy with reduced collisions<br />
and a higher ion flux during the PIII pulses as the<br />
plasma sheath is expanding faster for higher<br />
voltages.<br />
The combined data of such experiments for four<br />
different gas-substrate combinations are shown in<br />
Fig. 4. The variation observed with substrate<br />
material and gas precursor employed in PIII is in<br />
agreement with available literature data [5]. For<br />
the nitrogen gas, a plasma composition of about<br />
Power Density (mW/cm 2 )<br />
Pulse Voltage (kV)<br />
400 0 1 2 3 4 5 6<br />
300<br />
200<br />
100<br />
0<br />
N 2<br />
, 15 µs, 5 kHz<br />
distance 26 cm<br />
Al<br />
Cu<br />
stainless steel<br />
45 Cu, 15 µs, 5 kHz<br />
distance 26 cm<br />
30<br />
15<br />
N 2<br />
Ar<br />
0<br />
0 1 2 3 4 5 6<br />
Pulse Voltage (kV)<br />
Figure 4: Power density for different gases and substrate<br />
materials; as a guide for the eye, straight lines representing<br />
a linear dependency are indicated. The measurements were<br />
performed with 15 µs pulses at 5 kHz.<br />
90% molecular ions and 10% atomic ions is<br />
present, thus the effective ion energy leading to<br />
the emission of secondary electrons corresponds<br />
to about 50% of the pulse voltage.<br />
Using a homogeneous substrate in PIII allows a<br />
direct correlation of the primary current through<br />
the pulse generator (as well as the current<br />
through the substrate) with the emission of<br />
secondary electrons. For fundamental<br />
investigations, this setup is ideal. In contrast,<br />
direct measurements of a variety of materials<br />
necessitate a flexible substrate holder for<br />
changing substrates where no secondary<br />
electrons from the holder (comprising of a<br />
different material) can reach the PTP.<br />
The experiment for measuring secondary electron<br />
emission coefficients is ideally suited for dynamic<br />
investigations as the ion flux of about 10 15 /cm 2 s<br />
leads to typical sputter rates of 0.5 – 1.0 µm/h.<br />
Combining this value with the time resolution of<br />
1 minute, a conservative depth resolution of<br />
10 nm can be realized. As PIII experiments are<br />
naturally conducted from 5 to 50 kV, the incident<br />
ion flux will lead to excessive heating at higher<br />
voltages. Thus, reduced voltages between<br />
0.5 and 10 kV are more suitable for dynamic<br />
measurements, with the lower energies being of<br />
considerable interest in magnetron or HIPIMS<br />
discharges. The lower limit is normally given by<br />
the specifications of the employed pulse<br />
generator for the PIII experiments.<br />
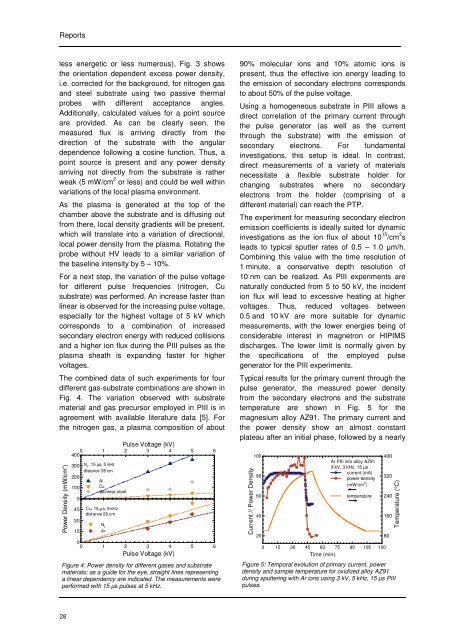
Typical results for the primary current through the<br />
pulse generator, the measured power density<br />
from the secondary electrons and the substrate<br />
temperature are shown in Fig. 5 for the<br />
magnesium alloy AZ91. The primary current and<br />
the power density show an almost constant<br />
plateau after an initial phase, followed by a nearly<br />
Current // Power Density<br />
100<br />
80<br />
60<br />
40<br />
20<br />
Ar PIII into alloy AZ91<br />
3 kV, 3 kHz, 15 µs<br />
current (mA)<br />
power density<br />
(mW/cm 2 )<br />
temperature<br />
0 15 30 45 60 75 90 105 120<br />
Time (min)<br />
400<br />
320<br />
240<br />
160<br />
Figure 5: Temporal evolution of primary current, power<br />
density and sample temperature for oxidized alloy AZ91<br />
during sputtering with Ar ions using 3 kV, 5 kHz, 15 µs PIII<br />
pulses.<br />
80<br />
Temperature (°C)<br />
28