Chapter 4 - Department of Business
Chapter 4 - Department of Business
Chapter 4 - Department of Business

Create successful ePaper yourself
Turn your PDF publications into a flip-book with our unique Google optimized e-Paper software.
216<br />
DEPARTMENT OF BUSINESS AND EMPLOYMENT<br />
<strong>Chapter</strong> 4<br />
Northern Territory Regional Pr<strong>of</strong>i les - Central Region<br />
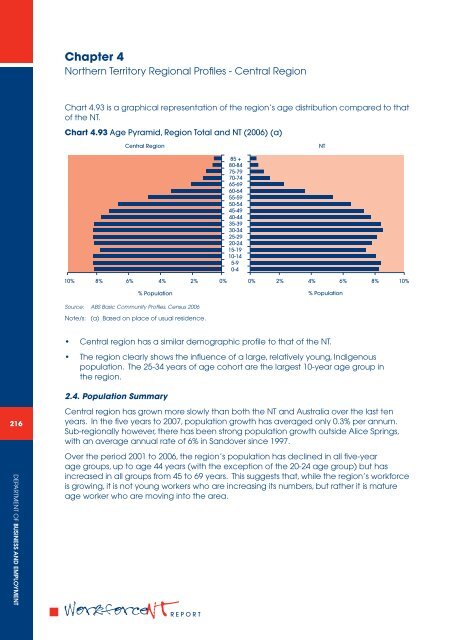
Chart 4.93 is a graphical representation <strong>of</strong> the region’s age distribution compared to that<br />
<strong>of</strong> the NT.<br />
Chart 4.93 Age Pyramid, Region Total and NT (2006) (a)<br />
Central Region<br />
10% 8% 6% 4% 2% 0%<br />
% Population<br />
Source: ABS Basic Community Pr<strong>of</strong>iles, Census 2006<br />
Note/s: (a) Based on place <strong>of</strong> usual residence.<br />
Central region has a similar demographic pr<strong>of</strong>ile to that <strong>of</strong> the NT.<br />
The region clearly shows the influence <strong>of</strong> a large, relatively young, Indigenous<br />
population. The 25-34 years <strong>of</strong> age cohort are the largest 10-year age group in<br />
the region.<br />
2.4. Population Summary<br />
Central region has grown more slowly than both the NT and Australia over the last ten<br />
years. In the five years to 2007, population growth has averaged only 0.3% per annum.<br />
Sub-regionally however, there has been strong population growth outside Alice Springs,<br />
with an average annual rate <strong>of</strong> 6% in Sandover since 1997.<br />
Over the period 2001 to 2006, the region’s population has declined in all five-year<br />
age groups, up to age 44 years (with the exception <strong>of</strong> the 20-24 age group) but has<br />
increased in all groups from 45 to 69 years. This suggests that, while the region’s workforce<br />
is growing, it is not young workers who are increasing its numbers, but rather it is mature<br />
age worker who are moving into the area.<br />
REPORT<br />
85 +<br />
80-84<br />
75-79<br />
70-74<br />
65-69<br />
60-64<br />
55-59<br />
50-54<br />
45-49<br />
40-44<br />
35-39<br />
30-34<br />
25-29<br />
20-24<br />
15-19<br />
10-14<br />
5-9<br />
0-4<br />
NT<br />
0% 2% 4% 6% 8% 10%<br />
% Population