Chapter 4 - Department of Business
Chapter 4 - Department of Business
Chapter 4 - Department of Business

Create successful ePaper yourself
Turn your PDF publications into a flip-book with our unique Google optimized e-Paper software.
124<br />
DEPARTMENT OF BUSINESS AND EMPLOYMENT<br />
<strong>Chapter</strong> 4<br />
Northern Territory Regional Pr<strong>of</strong>i les - East Arnhem Region<br />
The number <strong>of</strong> employed people in the region has increased by 14% over the 2001<br />
- 2006 period, compared to employment growth for the NT <strong>of</strong> 3.9%. Unemployment<br />
in the region has also grown in the period, from a 4.4% unemployment rate in 2001<br />
to 7.9% in 2006. The increase in the number <strong>of</strong> employed people and the number <strong>of</strong><br />
people looking for work is positive and has raised the participation rate to 53% from<br />
49% in 2001.<br />
4.2. Labour Force and Participation<br />
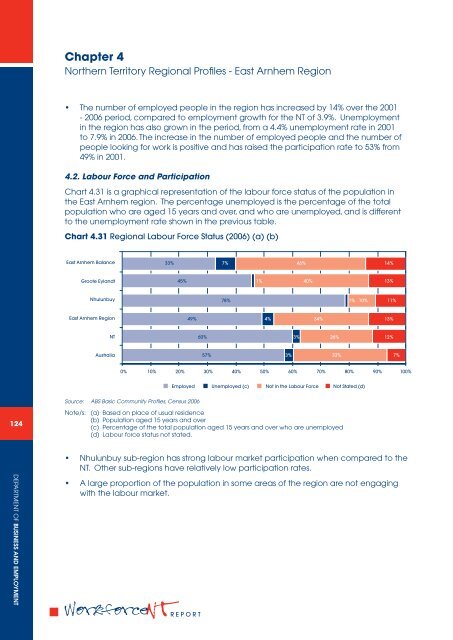
Chart 4.31 is a graphical representation <strong>of</strong> the labour force status <strong>of</strong> the population in<br />
the East Arnhem region. The percentage unemployed is the percentage <strong>of</strong> the total<br />
population who are aged 15 years and over, and who are unemployed, and is different<br />
to the unemployment rate shown in the previous table.<br />
Chart 4.31 Regional Labour Force Status (2006) (a) (b)<br />
East Arnhem Balance<br />
Groote Eylandt<br />
Nhulunbuy<br />
East Arnhem Region<br />
NT<br />
Australia<br />
33%<br />
45%<br />
49%<br />
0% 10% 20% 30% 40% 50% 60% 70% 80% 90% 100%<br />
Source: ABS Basic Community Pr<strong>of</strong>iles, Census 2006<br />
Note/s: (a) Based on place <strong>of</strong> usual residence<br />
(b) Population aged 15 years and over<br />
(c) Percentage <strong>of</strong> the total population aged 15 years and over who are unemployed<br />
(d) Labour force status not stated.<br />
Nhulunbuy sub-region has strong labour market participation when compared to the<br />
NT. Other sub-regions have relatively low participation rates.<br />
A large proportion <strong>of</strong> the population in some areas <strong>of</strong> the region are not engaging<br />
with the labour market.<br />
REPORT<br />
60%<br />
7%<br />
78%<br />
1%<br />
46%<br />
57% 3%<br />
33%<br />
7%<br />
40%<br />
1%<br />
10%<br />
14%<br />
13%<br />
4% 34%<br />
13%<br />
Employed Unemployed (c) Not in the Labour Force Not Stated (d)<br />
3%<br />
26%<br />
11%<br />
12%