Chapter 4 - Department of Business
Chapter 4 - Department of Business
Chapter 4 - Department of Business

Create successful ePaper yourself
Turn your PDF publications into a flip-book with our unique Google optimized e-Paper software.
84<br />
DEPARTMENT OF BUSINESS AND EMPLOYMENT<br />
<strong>Chapter</strong> 4<br />
Northern Territory Regional Pr<strong>of</strong>i les - Darwin Region<br />
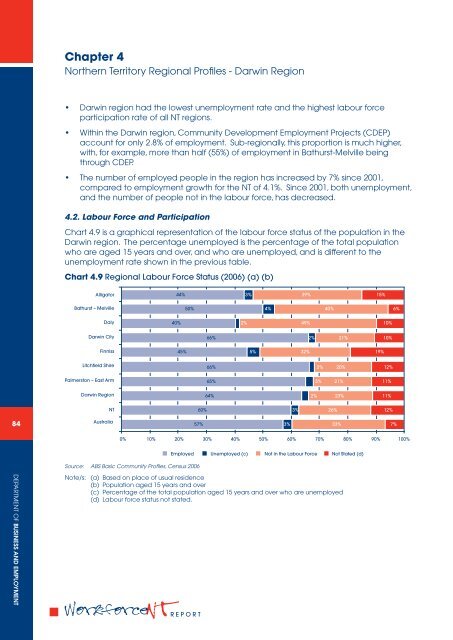
Darwin region had the lowest unemployment rate and the highest labour force<br />
participation rate <strong>of</strong> all NT regions.<br />
Within the Darwin region, Community Development Employment Projects (CDEP)<br />
account for only 2.8% <strong>of</strong> employment. Sub-regionally, this proportion is much higher,<br />
with, for example, more than half (55%) <strong>of</strong> employment in Bathurst-Melville being<br />
through CDEP.<br />
The number <strong>of</strong> employed people in the region has increased by 7% since 2001,<br />
compared to employment growth for the NT <strong>of</strong> 4.1%. Since 2001, both unemployment,<br />
and the number <strong>of</strong> people not in the labour force, has decreased.<br />
4.2. Labour Force and Participation<br />
Chart 4.9 is a graphical representation <strong>of</strong> the labour force status <strong>of</strong> the population in the<br />
Darwin region. The percentage unemployed is the percentage <strong>of</strong> the total population<br />
who are aged 15 years and over, and who are unemployed, and is different to the<br />
unemployment rate shown in the previous table.<br />
Chart 4.9 Regional Labour Force Status (2006) (a) (b)<br />
Alligator<br />
Bathurst – Melville<br />
Daly<br />
Darwin City<br />
Finniss<br />
Litchfield Shire<br />
Palmerston – East Arm<br />
Darwin Region<br />
NT<br />
Australia<br />
44%<br />
40%<br />
45%<br />
50%<br />
0% 10% 20% 30% 40% 50% 60% 70% 80% 90% 100%<br />
Source: ABS Basic Community Pr<strong>of</strong>iles, Census 2006<br />
Note/s: (a) Based on place <strong>of</strong> usual residence<br />
(b) Population aged 15 years and over<br />
(c) Percentage <strong>of</strong> the total population aged 15 years and over who are unemployed<br />
(d) Labour force status not stated.<br />
REPORT<br />
60%<br />
57%<br />
66%<br />
65%<br />
64%<br />
2%<br />
3%<br />
39%<br />
49%<br />
49%<br />
25%<br />
66% 2%<br />
5%<br />
4%<br />
Employed Unemployed (c) Not in the Labour Force Not Stated (d)<br />
3%<br />
3%<br />
32%<br />
2%<br />
2%<br />
3%<br />
40%<br />
26%<br />
20%<br />
21%<br />
33%<br />
21%<br />
23%<br />
24%<br />
15%<br />
19%<br />
10%<br />
10%<br />
12%<br />
11%<br />
11%<br />
12%<br />
6%<br />
7%