Chapter 4 - Department of Business
Chapter 4 - Department of Business
Chapter 4 - Department of Business

Create successful ePaper yourself
Turn your PDF publications into a flip-book with our unique Google optimized e-Paper software.
126<br />
DEPARTMENT OF BUSINESS AND EMPLOYMENT<br />
<strong>Chapter</strong> 4<br />
Northern Territory Regional Pr<strong>of</strong>i les - East Arnhem Region<br />
5. EMPLOYMENT BY INDUSTRY<br />
Employment by industry data shows the industry sectors where people are employed,<br />
and where employment opportunities lie within the region. The data is influenced by<br />
factors such as the rate <strong>of</strong> economic growth, structural change in the economy, the<br />
effects <strong>of</strong> technology, labour market flexibility and changes in local and global demand.<br />
The employment by industry groupings are as per the ABS Australian and New Zealand<br />
Standard Industrial Classification (ANZSIC) codes, levels one and three.<br />
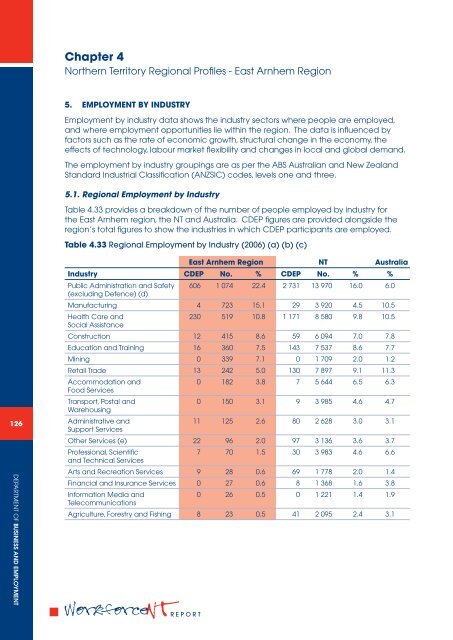
5.1. Regional Employment by Industry<br />
Table 4.33 provides a breakdown <strong>of</strong> the number <strong>of</strong> people employed by industry for<br />
the East Arnhem region, the NT and Australia. CDEP figures are provided alongside the<br />
region’s total figures to show the industries in which CDEP participants are employed.<br />
Table 4.33 Regional Employment by Industry (2006) (a) (b) (c)<br />
East Arnhem Region NT Australia<br />
Industry CDEP No. % CDEP No. % %<br />
Public Administration and Safety<br />
(excluding Defence) (d)<br />
606 1 074 22.4 2 731 13 970 16.0 6.0<br />
Manufacturing 4 723 15.1 29 3 920 4.5 10.5<br />
Health Care and<br />
Social Assistance<br />
230 519 10.8 1 171 8 580 9.8 10.5<br />
Construction 12 415 8.6 59 6 094 7.0 7.8<br />
Education and Training 16 360 7.5 143 7 537 8.6 7.7<br />
Mining 0 339 7.1 0 1 709 2.0 1.2<br />
Retail Trade 13 242 5.0 130 7 897 9.1 11.3<br />
Accommodation and<br />
Food Services<br />
0 182 3.8 7 5 644 6.5 6.3<br />
Transport, Postal and<br />
Warehousing<br />
0 150 3.1 9 3 985 4.6 4.7<br />
Administrative and<br />
Support Services<br />
11 125 2.6 80 2 628 3.0 3.1<br />
Other Services (e) 22 96 2.0 97 3 136 3.6 3.7<br />
Pr<strong>of</strong>essional, Scientific<br />
and Technical Services<br />
7 70 1.5 30 3 983 4.6 6.6<br />
Arts and Recreation Services 9 28 0.6 69 1 778 2.0 1.4<br />
Financial and Insurance Services 0 27 0.6 8 1 368 1.6 3.8<br />
Information Media and<br />
Telecommunications<br />
0 26 0.5 0 1 221 1.4 1.9<br />
Agriculture, Forestry and Fishing 8 23 0.5 41 2 095 2.4 3.1<br />
REPORT