Chapter 4 - Department of Business
Chapter 4 - Department of Business
Chapter 4 - Department of Business

You also want an ePaper? Increase the reach of your titles
YUMPU automatically turns print PDFs into web optimized ePapers that Google loves.
<strong>Chapter</strong> 4<br />
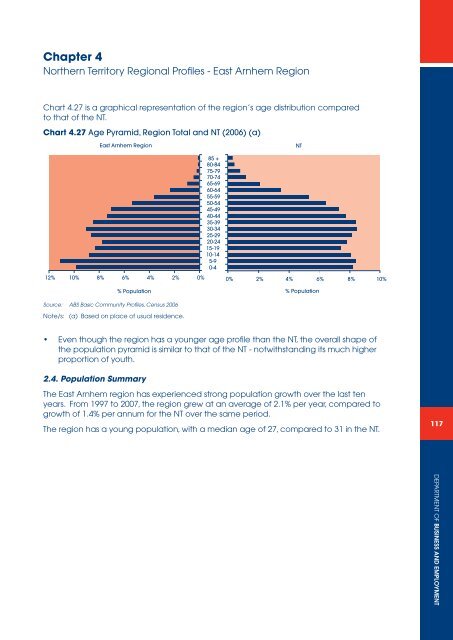
Northern Territory Regional Pr<strong>of</strong>i les - East Arnhem Region<br />
Chart 4.27 is a graphical representation <strong>of</strong> the region’s age distribution compared<br />
to that <strong>of</strong> the NT.<br />
Chart 4.27 Age Pyramid, Region Total and NT (2006) (a)<br />
12%<br />
10%<br />
East Arnhem Region<br />
8%<br />
6%<br />
Source: ABS Basic Community Pr<strong>of</strong>iles, Census 2006<br />
Note/s: (a) Based on place <strong>of</strong> usual residence.<br />
Even though the region has a younger age pr<strong>of</strong>ile than the NT, the overall shape <strong>of</strong><br />
the population pyramid is similar to that <strong>of</strong> the NT - notwithstanding its much higher<br />
proportion <strong>of</strong> youth.<br />
2.4. Population Summary<br />
4%<br />
% Population<br />
2%<br />
85 +<br />
80-84<br />
75-79<br />
70-74<br />
65-69<br />
60-64<br />
55-59<br />
50-54<br />
45-49<br />
40-44<br />
35-39<br />
30-34<br />
25-29<br />
20-24<br />
15-19<br />
10-14<br />
5-9<br />
0-4<br />
0% 0% 2% 4% 6% 8% 10%<br />
The East Arnhem region has experienced strong population growth over the last ten<br />
years. From 1997 to 2007, the region grew at an average <strong>of</strong> 2.1% per year, compared to<br />
growth <strong>of</strong> 1.4% per annum for the NT over the same period.<br />
The region has a young population, with a median age <strong>of</strong> 27, compared to 31 in the NT.<br />
NT<br />
% Population<br />
117<br />
DEPARTMENT OF BUSINESS AND EMPLOYMENT