I. Table of Contents - ISS
I. Table of Contents - ISS
I. Table of Contents - ISS
Create successful ePaper yourself
Turn your PDF publications into a flip-book with our unique Google optimized e-Paper software.
tatiana\Bank Book\Public Bank Book\FINAL <strong>ISS</strong> PUBLIC Bank IM - Press Release to EMTN_1.doc 9 Nov 2005 10:32 6/91<br />
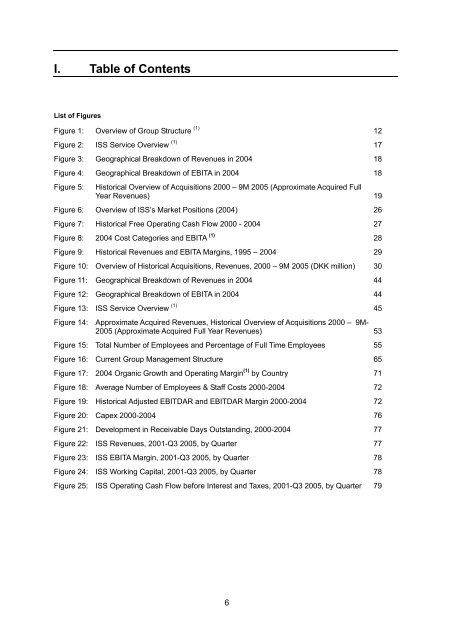
I. <strong>Table</strong> <strong>of</strong> <strong>Contents</strong><br />
List <strong>of</strong> Figures<br />
Figure 1: Overview <strong>of</strong> Group Structure (1) 12<br />
Figure 2: <strong>ISS</strong> Service Overview (1) 17<br />
Figure 3: Geographical Breakdown <strong>of</strong> Revenues in 2004 18<br />
Figure 4: Geographical Breakdown <strong>of</strong> EBITA in 2004 18<br />
Figure 5: Historical Overview <strong>of</strong> Acquisitions 2000 – 9M 2005 (Approximate Acquired Full<br />
Year Revenues) 19<br />
Figure 6: Overview <strong>of</strong> <strong>ISS</strong>’s Market Positions (2004) 26<br />
Figure 7: Historical Free Operating Cash Flow 2000 - 2004 27<br />
Figure 8: 2004 Cost Categories and EBITA (1) 28<br />
Figure 9: Historical Revenues and EBITA Margins, 1995 – 2004 29<br />
Figure 10: Overview <strong>of</strong> Historical Acquisitions, Revenues, 2000 – 9M 2005 (DKK million) 30<br />
Figure 11: Geographical Breakdown <strong>of</strong> Revenues in 2004 44<br />
Figure 12: Geographical Breakdown <strong>of</strong> EBITA in 2004 44<br />
Figure 13: <strong>ISS</strong> Service Overview (1) 45<br />
Figure 14: Approximate Acquired Revenues, Historical Overview <strong>of</strong> Acquisitions 2000 – 9M-<br />
2005 (Approximate Acquired Full Year Revenues) 53<br />
Figure 15: Total Number <strong>of</strong> Employees and Percentage <strong>of</strong> Full Time Employees 55<br />
Figure 16: Current Group Management Structure 65<br />
Figure 17: 2004 Organic Growth and Operating Margin (1) by Country 71<br />
Figure 18: Average Number <strong>of</strong> Employees & Staff Costs 2000-2004 72<br />
Figure 19: Historical Adjusted EBITDAR and EBITDAR Margin 2000-2004 72<br />
Figure 20: Capex 2000-2004 76<br />
Figure 21: Development in Receivable Days Outstanding, 2000-2004 77<br />
Figure 22: <strong>ISS</strong> Revenues, 2001-Q3 2005, by Quarter 77<br />
Figure 23: <strong>ISS</strong> EBITA Margin, 2001-Q3 2005, by Quarter 78<br />
Figure 24: <strong>ISS</strong> Working Capital, 2001-Q3 2005, by Quarter 78<br />
Figure 25: <strong>ISS</strong> Operating Cash Flow before Interest and Taxes, 2001-Q3 2005, by Quarter 79<br />
6


