

Grove School Renewal Charter FINAL Version - 2019

You also want an ePaper? Increase the reach of your titles
YUMPU automatically turns print PDFs into web optimized ePapers that Google loves.
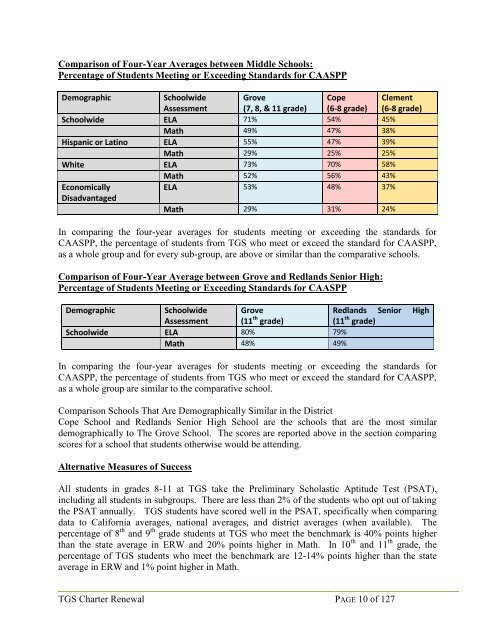
Comparison of Four-Year Averages between Middle <strong>School</strong>s:<br />
Percentage of Students Meeting or Exceeding Standards for CAASPP<br />
Demographic<br />
<strong>School</strong>wide<br />
Assessment<br />
<strong>Grove</strong><br />
(7, 8, & 11 grade)<br />
Cope<br />
(6-8 grade)<br />
Clement<br />
(6-8 grade)<br />
<strong>School</strong>wide ELA 71% 54% 45%<br />
Math 49% 47% 38%<br />
Hispanic or Latino ELA 55% 47% 39%<br />
Math 29% 25% 25%<br />
White ELA 73% 70% 58%<br />
Math 52% 56% 43%<br />
Economically<br />
ELA 53% 48% 37%<br />
Disadvantaged<br />
Math 29% 31% 24%<br />
In comparing the four-year averages for students meeting or exceeding the standards for<br />
CAASPP, the percentage of students from TGS who meet or exceed the standard for CAASPP,<br />
as a whole group and for every sub-group, are above or similar than the comparative schools.<br />
Comparison of Four-Year Average between <strong>Grove</strong> and Redlands Senior High:<br />
Percentage of Students Meeting or Exceeding Standards for CAASPP<br />
Demographic<br />
<strong>School</strong>wide <strong>Grove</strong><br />
Redlands Senior High<br />
Assessment (11 th grade)<br />
(11 th grade)<br />
<strong>School</strong>wide ELA 80% 79%<br />
Math 48% 49%<br />
In comparing the four-year averages for students meeting or exceeding the standards for<br />
CAASPP, the percentage of students from TGS who meet or exceed the standard for CAASPP,<br />
as a whole group are similar to the comparative school.<br />
Comparison <strong>School</strong>s That Are Demographically Similar in the District<br />
Cope <strong>School</strong> and Redlands Senior High <strong>School</strong> are the schools that are the most similar<br />
demographically to The <strong>Grove</strong> <strong>School</strong>. The scores are reported above in the section comparing<br />
scores for a school that students otherwise would be attending.<br />
Alternative Measures of Success<br />
All students in grades 8-11 at TGS take the Preliminary Scholastic Aptitude Test (PSAT),<br />
including all students in subgroups. There are less than 2% of the students who opt out of taking<br />
the PSAT annually. TGS students have scored well in the PSAT, specifically when comparing<br />
data to California averages, national averages, and district averages (when available). The<br />
percentage of 8 th and 9 th grade students at TGS who meet the benchmark is 40% points higher<br />
than the state average in ERW and 20% points higher in Math. In 10 th and 11 th grade, the<br />
percentage of TGS students who meet the benchmark are 12-14% points higher than the state<br />
average in ERW and 1% point higher in Math.<br />
TGS <strong>Charter</strong> <strong>Renewal</strong> PAGE 10 of 127