SLSNZ NATIONAL Beach & Coastal Safety Report
New Zealand has one of the highest fatal drowning rates in the OECD1. This report is our way of drawing a line in the sand. We, Surf Life Saving New Zealand, are saying “enough is enough”. No more unnecessary deaths from drowning on our beaches and along our coastline.
New Zealand has one of the highest fatal drowning rates in the OECD1. This report is our way of drawing a line in the sand. We, Surf Life Saving New Zealand, are saying “enough is enough”. No more unnecessary deaths from drowning on our beaches and along our coastline.

Create successful ePaper yourself
Turn your PDF publications into a flip-book with our unique Google optimized e-Paper software.
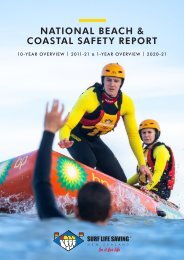
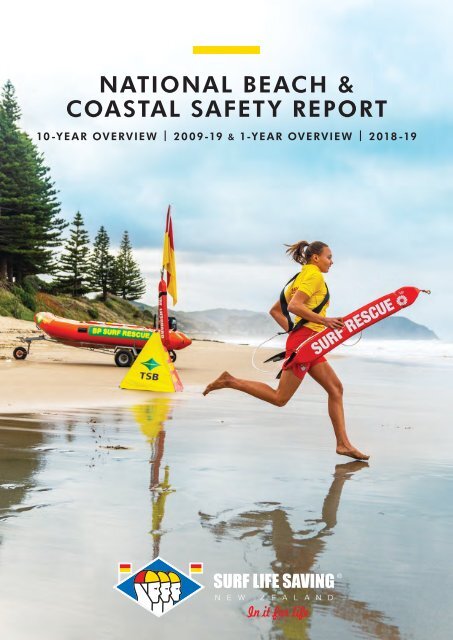
<strong>NATIONAL</strong> BEACH &<br />
COASTAL SAFETY REPORT<br />
10-YEAR OVERVIEW | 2009-19 & 1-YEAR OVERVIEW | 2018-19
KEY FINDINGS<br />
KEY FINDINGS<br />
10-YEAR OVERVIEW | 2009-19<br />
10 YEA R O V E RVI E W | 2 0 0 9 - 1 9<br />
We call on those who have the authority, the legal or the moral responsibility,<br />
to work with us and our drowning prevention partners to stop the death toll from<br />
getting worse, and to reduce it to a level where we can be proud as an island nation<br />
to say ‘we have no preventable drownings on our beach and coastal areas’.<br />
1<br />
Fatal Drownings in New Zealand<br />
Have INCREASED.<br />
There has been a 37% increase in <strong>Beach</strong> and<br />
<strong>Coastal</strong> Fatal Drownings over the last 5 years, when<br />
compared to the previous 5 years.<br />
2<br />
Our Fatal Drownings are 70%<br />
HIGHER Than Australia.<br />
New Zealand has a 70% higher <strong>Beach</strong> and <strong>Coastal</strong><br />
Fatal Drowning rate per capita than Australia.<br />
3<br />
1:15<br />
For Every Child or Young<br />
Adolescent That Fatally Drowned,<br />
15 Were Hospitalised for<br />
Non-Fatal Drowning Injuries.<br />
Children are grossly over-represented in the<br />
non-fatal drowning statistics. For every child or<br />
young adolescent that fatally drowns,there are15<br />
that are hospitalised having suffered from<br />
non-fatal drowning .<br />
4<br />
Males are Fatally Drowning<br />
MORE Than Females.<br />
89%<br />
MALE<br />
11%<br />
FEMALE<br />
Of those who died from drowning over the last 10<br />
years, males represent 89% and females only 11%.<br />
Men are fatally drowning more on our beaches and<br />
coastline than females.<br />
5<br />
2.0<br />
Pasifika had the HIGHEST Fatal<br />
Drowning Rate Over the Last<br />
10 years.<br />
6<br />
Almost 50% of Fatal Drownings<br />
Occured in Summer.<br />
7<br />
Northland has New Zealand’s<br />
HIGHEST Fatal Drowning Rate<br />
3.91<br />
8<br />
Adults are Fatally Drowning<br />
MORE Than Children and Young<br />
Adolescents.<br />
1.5<br />
1.0<br />
0.5<br />
0.0<br />
All Others Maori Pacific Peoples<br />
Over the last 10 years Pacific Peoples had the<br />
highest Fatal Drowning rate (1.69 per 100,000 pop)<br />
of any ethnicity, closely followed by Maori<br />
(1.27 pero 100,000 pop).<br />
Over the last 10 years, there were 144 Fatal<br />
<strong>Beach</strong> and <strong>Coastal</strong> Drownings during the<br />
Summer months of December, January and<br />
February. This figure represents nearly half of<br />
the total annual fatal drownings recorded,<br />
highlighting the increased risk associated with<br />
the busy Summer season.<br />
The rate of fatal drownings per 100,000pop in<br />
Northland is 3.91, whereas Auckland (with a much<br />
larger population), has a fatal drowning rate of only<br />
0.63. Therefore the risk of drowning on the beach<br />
and coastline of Northland is more than 6 times<br />
greater than Auckland.<br />
Adults over the age of 15 have a higher probability<br />
of <strong>Beach</strong> and <strong>Coastal</strong> Fatal Drowning, than children<br />
and young adolescents. 35-44 being the category<br />
with the most Fatal Drownings recorded.<br />
9<br />
Surf <strong>Beach</strong>es Pose the HIGHEST<br />
Risk for <strong>Beach</strong> and <strong>Coastal</strong> Fatal<br />
Drowning in New Zealand.<br />
10<br />
Over the Last 10 Years, the<br />
HIGHEST RISK Activities on a<br />
<strong>Beach</strong> and <strong>Coastal</strong> Environment<br />
Have Been:<br />
However...<br />
Last Year the HIGHEST RISK<br />
Activities Were:<br />
Over the last 10 years, 39% of beach and coastal<br />
fatal drownings occured at a surf beach in<br />
New Zealand.<br />
Swimming/Wading Falls (trips/slips) Boating Rock Fishing Watercraft Swimming/Wading<br />
SURF LIFE SAVING NEW ZEALAND <strong>NATIONAL</strong> BEACH AND COASTAL SAFETY REPORT SURF LIFE SAVING NEW ZEALAND KEY FINDINGS INFOGRAPHICS<br />
02 03
DROWNING SNAPSHOT<br />
10-YEAR OVERVIEW | 2009-19<br />
CONTENTS<br />
LOCATION<br />
39%<br />
SURF BEACH<br />
ACTIVITY<br />
22%<br />
SWIMMING/WADING<br />
320 89%<br />
MALE<br />
BEACH &<br />
COASTAL FATAL<br />
DROWNINGS<br />
15%<br />
ROCKY<br />
FORESHORE<br />
20%<br />
FALLS<br />
11%<br />
FEMALE<br />
14%<br />
HARBOUR<br />
15%<br />
BOATING<br />
Key Findings Infographics 02<br />
Synopsis 06<br />
Key Findings 07<br />
Northland 38<br />
SECTION ONE:<br />
09<br />
Auckland 40<br />
CAPABILITY<br />
Waikato 42<br />
Bay of Plenty 44<br />
Capability 10 Gisborne 46<br />
Surf Life Saving Patrol<br />
Locations 12<br />
Hawke's Bay<br />
Taranaki<br />
48<br />
50<br />
Surf Lifeguard Capability 13 Manawatu-Wanganui 52<br />
Rescues Per Region 14 Wellington 54<br />
Assists Per Region 15 Tasman 56<br />
Major First Aid Incidents 16 Marlborough 58<br />
Minor First Aid Incidents 17 West Coast 60<br />
Searches Per Region 18 Canterbury 62<br />
Preventative Actions 19 Otago 64<br />
Southland 66<br />
SECTION T WO:<br />
21<br />
FATAL DROWNING<br />
SECTION SIX:<br />
69<br />
10 YEAR ACTIVITY<br />
10 Year National Overview 22 OVERVIEW 2009-19<br />
SECTION THREE:<br />
FATAL DROWNING<br />
ANALYSIS - 2018/19<br />
29<br />
1 Year National Overview 30<br />
SECTION FOUR:<br />
NON-FATAL<br />
DROWNING<br />
33<br />
Non-Fatal Drownings Overview 34<br />
Comparison of Fatal and<br />
Non-Fatal Drownings on <strong>Beach</strong>es 35<br />
SECTION FIVE:<br />
REGIONAL OVERVIEWS<br />
37<br />
Snapshot: Swimming/Wading 70<br />
Snapshot: Falls 71<br />
Snapshot: Boating 72<br />
Snapshot: Watercraft 73<br />
Snapshot: Snorkelling 74<br />
Key Terms 76<br />
References 78
SYNOPSIS<br />
KEY FINDINGS<br />
New Zealand has one of the highest fatal<br />
drowning rates in the OECD 1 .<br />
Each one leaves families and communities devastated. Our<br />
drowning toll is something every New Zealander should see<br />
as a national tragedy and one we all have a responsibility to<br />
address (Water <strong>Safety</strong> New Zealand, 2019b).<br />
Drowning is not just a tragedy for those involved, but<br />
each drowning has a considerable economic impact too.<br />
The social cost to New Zealand of one water drowning<br />
fatality has been estimated at $4.729 million and this can<br />
be expected to be higher for children under 5 years-old who<br />
live longer (Water <strong>Safety</strong> New Zealand, 2019a).<br />
Each year, more than three million people visit beaches<br />
and 1.5 million go boating (Water <strong>Safety</strong> New Zealand,<br />
2015). These people are exposed to a risk of drowning,<br />
that Surf Life Saving New Zealand (<strong>SLSNZ</strong>) is committed to<br />
reducing. <strong>SLSNZ</strong> is the leading beach and coastal safety,<br />
drowning prevention and rescue authority in New Zealand.<br />
The purpose of the organisation is to enable everyone to<br />
enjoy New Zealand’s beaches safely with a vision of zero<br />
preventable drownings.<br />
The New Zealand coastline varies dramatically. The west<br />
coast is exposed to the energetic Tasman Sea whereas the<br />
east coast faces the South Pacific Ocean, which at times<br />
can be just as dangerous. The coastline of New Zealand<br />
is approximately 15,000km in length, the ninth longest<br />
coastline of any nation in the world. New Zealand beaches<br />
and coastal areas are known to be some of the most<br />
beautiful. However, our nation has a shocking annual beach<br />
and coastal drowning toll.<br />
During the last 10 years, there has been an average of 32<br />
fatal drownings per year, which is a 70% higher beach and<br />
coastal drowning rate per capita, compared to Australia.<br />
Despite some drowning trends in New Zealand being on<br />
the decline (Water <strong>Safety</strong> New Zealand, 2019b), beach and<br />
coastal drownings are on the increase.<br />
In order to help understand the problem in more detail,<br />
<strong>SLSNZ</strong> has produced this report, which although based on<br />
a similar report that our sister organisation Surf Life Saving<br />
Australia has been producing for some time, is the first of its<br />
kind here in New Zealand. It is designed to complement the<br />
National Drowning <strong>Report</strong> produced by Water <strong>Safety</strong> New<br />
Zealand and to contribute to the New Zealand Water <strong>Safety</strong><br />
Sector Strategy. The report provides an analysis of fatal and<br />
non-fatal drownings and rescues where a fatal or non-fatal<br />
drowning has been averted. It compares data from 2018-<br />
19 with the 10-year average from July 2009 - June 2019.<br />
It also provides both a national and regional overview with<br />
a breakdown of who is drowning, where they are drowning<br />
and what they are doing when they drown.<br />
The report in itself does not provide answers, it simply<br />
provides the data in such a way that highlights the problem<br />
and will aid further analysis to help provide potential<br />
solutions. <strong>SLSNZ</strong> will continue to undertake a comprehensive<br />
<strong>Coastal</strong> Risk Assessment process using information gained<br />
from more in-depth studies of each fatal and non-fatal<br />
drowning as well as rescues. Using this information,<br />
<strong>SLSNZ</strong> will work with Central and Local Government, key<br />
landowners and stakeholders to clarify the responsibility<br />
for beach and coastal safety and then, using an evidencebased,<br />
collaborative and partnership approach, provide<br />
targeted safety interventions at local, regional and national<br />
levels that lead towards a safer future for all those that visit<br />
and recreate on beaches along New Zealand’s coastline.<br />
This report is our way of drawing a line in the sand.<br />
We, Surf Life Saving New Zealand, are saying “enough<br />
is enough”. No more unnecessary deaths from<br />
drowning on our beaches and along our coastline.<br />
We call on those who have the authority, the legal or the<br />
moral responsibility, to work with us and our drowning<br />
prevention partners to stop the death toll from getting<br />
worse, and to reduce it to a level where we can be proud as<br />
an island nation to say ‘we have no preventable drownings<br />
on our beach and coastal areas’.<br />
The National <strong>Beach</strong> and <strong>Coastal</strong> <strong>Safety</strong> <strong>Report</strong> only documents<br />
incidents that have occurred within the coastal zone. The coastal<br />
zone is defined as “Tidal waters (estuary, harbour, marina and<br />
river/harbour bar); ocean up to 1km offshore; or inland up to five<br />
times the width of the inlet/river”.<br />
“Boating” is defined as either a powered vessel or a sailing boat.<br />
“Watercraft” is defined as a piece of non-powered recreational<br />
equipment used in water, e.g. surfboards, stand-up paddleboards,<br />
body boards, windsurfers or kayaks.<br />
• <strong>Beach</strong> and <strong>Coastal</strong> Fatal Drownings are increasing. In<br />
the last five years, there has been a 37% rise compared to<br />
the previous five years (27 to 37 per year). Even allowing<br />
for population growth, the fatal drowning rate has still risen<br />
by 21% (0.70 to 0.85 per 100,000 pop).<br />
• New Zealand now has a 70% higher beach and<br />
coastal drowning rate per capita, compared to Australia.<br />
• It is adults over the age of 15, not children who are<br />
significantly more likely to die from beach and coastal<br />
drowning. Although marginally more than the other age<br />
categories, those from 35-44 are the most ‘at risk’.<br />
• Children and adolescents (0-14 years old) are grossly<br />
over-represented in the fatal to non-fatal drowning<br />
statistics. For every child and adolescent that fatally drowns,<br />
there are 15 that are hospitalised having suffered from nonfatal<br />
drowning.<br />
• Of those who do die from drowning, males represent<br />
89% and females only 11%. In 2018-19 the percentage of<br />
men dropped slightly, but in general, men are still much<br />
more likely to drown on our beaches and the coastline than<br />
women. This is also true of non-fatal drownings.<br />
• Over the last 10 years, Pacific Peoples had the highest<br />
drowning rate (1.69 per 100,000pop) of any ethnicity,<br />
closely followed by Maori (1.27 per 100,000pop).<br />
• Over the last 10 years, there were 144 beach and<br />
coastal drowning fatalities during the three summer<br />
months of December, January and February. This figure<br />
represents nearly half of the total annual beach and coastal<br />
drowning fatalities recorded, highlighting the increased risk<br />
associated with the busy summer season.<br />
• Over the last 10 years, swimming/wading, falling<br />
(trips/slips) and boating have been the highest risk<br />
activities on the coast. Last year rock fishing and watercraft<br />
recreation were the joint highest risk activities, followed by<br />
swimming/wading.<br />
• With an average number of six fatal drownings per<br />
year, Northland is statistically the region which poses<br />
the greatest risk to beach visitors. While Auckland has a<br />
higher average number of fatal drownings per year (n =<br />
10), the rate of drownings per 100,000 in Northland is 3.91,<br />
whereas Auckland (with a much larger population), has a<br />
drowning rate of only 0.63. Therefore, the risk of drowning<br />
on the beach or coast in Northland is more than six times<br />
greater than Auckland 2 .<br />
• Over the last 10 years, Surf Lifeguards have carried<br />
out more than 11,000 rescues. That is a huge number of<br />
fatal drownings that have been potentially averted because<br />
of the vital role that <strong>SLSNZ</strong> performs.<br />
• <strong>SLSNZ</strong> also saves lives on the beaches as well as<br />
in the sea. All Surf Lifeguards are first aid trained and<br />
many are trained as First Responders. Over the last 10<br />
years, Surf Lifeguards have treated nearly 20,000 people<br />
who have required both minor and major first aid. <strong>SLSNZ</strong> is<br />
currently partnering with St John Ambulance to increase the<br />
level of care it provides the New Zealand public.<br />
• As part of the ‘National Search and Rescue<br />
Framework’, Volunteer <strong>SLSNZ</strong> Clubs are regularly called<br />
upon by the Police to respond to incidents out of hours.<br />
These call outs have significantly increased in recent years<br />
as more and more people require our services.<br />
New Zealand has one of the<br />
highest <strong>Beach</strong> and <strong>Coastal</strong> Fatal<br />
Drowning Rate in the OECD 1 . Our<br />
Fatal Drowning Toll is something<br />
every New Zealander should see as<br />
a national tragedy and we all have a<br />
responsibility to address.<br />
1 The Organisation for Economic Co-operation and Development (OECD) is a<br />
group of 34 member countries that discuss and develop economic and social<br />
policy. OECD members are democratic countries that support free-market<br />
economies.<br />
2 The population figures are based on those residing in the region, and do not<br />
include visitors. To gain a true picture of the ‘drowning risk’ in any area, future<br />
reports will attempt to allow for the seasonal influx of visitors.<br />
SURF LIFE SAVING NEW ZEALAND <strong>NATIONAL</strong> BEACH & COASTAL SAFETY REPORT SURF LIFE SAVING NEW ZEALAND SYNOPSIS & KEY FINDINGS<br />
06 07
CAPABILITY<br />
SECTION ONE<br />
10-YEAR OVERVIEW | 2009-19<br />
948,130<br />
PREVENTATIVE<br />
ACTIONS<br />
11,065<br />
RESCUES<br />
5002<br />
ASSISTS<br />
INVOLVING<br />
3,649,523<br />
MEMBERS OF THE PUBLIC<br />
40<br />
EMERGENCY<br />
CALLOUT SQUADS<br />
2,910<br />
SEARCHES<br />
19,614<br />
FIRST AID<br />
TREATMENTS
CAPABILITY<br />
CAPABILITY<br />
Surf Life Saving New Zealand has provided a Surf Lifeguard<br />
service to the NZ public for 109 years. The service consists<br />
of 74 volunteer Surf Life Saving Clubs and Contract Surf<br />
Lifeguard Service. When combined, these services patrol a<br />
total of 89 locations country-wide. Between 2018-19 there<br />
were 4903 qualified Surf Lifeguards, with 982 gaining their<br />
Surf Lifeguard Award during the season. Beyond the red and<br />
yellow flags, <strong>SLSNZ</strong> provides surveillance at many remote<br />
beaches and coastlines through a fleet of Inflatable Rescue<br />
Boats (IRB), Rescue Water Craft (RWC), All-Terrain Vehicles<br />
(ATV) and 4x4’s, and delivers an invaluable Search and<br />
Rescue service, through a network of club-based volunteer<br />
Emergency Callout Squads.<br />
VOLUNTEER SURF LIFEGUARDS<br />
Seasonal patrols are provided by 74 volunteer Surf Life<br />
Saving Clubs, with patrols typically occurring between<br />
Labour weekend (October) and Easter (April). Over the past<br />
few years, <strong>SLSNZ</strong> clubs have strategically adapted season<br />
lengths and daily patrol timings to meet the ever-changing<br />
demands of the communities they serve. The recommended<br />
Surf Lifeguard service requirements are evidence-based<br />
and derived from coastal risk assessments, which have<br />
been tailored towards existing patrol locations nationally.<br />
The coastal risk assessments also recommend new patrol<br />
locations, based upon risk-adjusted water use values for<br />
each site. <strong>SLSNZ</strong> works with SLS clubs, communities and<br />
stakeholders to deliver services to areas with the greatest<br />
need.<br />
Volunteer clubs use standardised equipment that includes<br />
Rescue Tubes, Rescue Boards, IRB and RWC to perform<br />
rescues and preventative actions, that stop the public getting<br />
into dangerous situations. The organisation also provides a<br />
number of surveillance patrols to increase service coverage.<br />
All Terrain Vehicles and 4x4 vehicles equipped with first aid<br />
and rescue equipment, ensure coverage is extended across<br />
larger stretches of coastline and remote beaches. Beyond<br />
the surf zone, a number of RWC provide rapid response to<br />
remote areas and rocky foreshores and participate in both<br />
surveillance and Search and Rescue activities.<br />
CONTRACT SURF LIFEGUARD SERVICE<br />
The Contract Surf Lifeguard Service is funded by Regional<br />
Councils and Local Territorial Authorities. Patrols primarily<br />
run on weekdays (Monday-Friday) through the summer<br />
school holidays (December-February). An evidence-based<br />
delivery model for the Contract Surf Lifeguard Service is<br />
also being used to expand services to meet community<br />
need. In some areas, surveillance-based patrolling methods<br />
have been used to extend patrolling hours into the evening,<br />
an approach that has been effective for preventing Surf<br />
Lifeguard fatigue. On-call based services have also been<br />
successfully trialled in the Bay of Plenty, to extend patrols<br />
in response to periods of prolonged settled weather and<br />
dangerous swimming conditions, as well as providing<br />
additional safety services to the public.<br />
SEARCH AND RESCUE<br />
Emergency Callout Squads are used to assist Search and<br />
Rescue agencies or sometimes Maritime New Zealand, in<br />
NZ Police tasked incidents. There are currently 40 active<br />
Emergency Callout Squads nationally. In 2018-19 there<br />
were a total of 57 Category 1 Search and Rescue operations,<br />
which saved a combined total of 36 lives.<br />
SURF LIFEGUARD INTERVENTIONS 2009-2019<br />
The interventions performed whilst Surf Lifeguards have<br />
been protecting our beaches in the last decade have<br />
saved countless lives. This exact figure at present cannot<br />
be quantified, however through these actions <strong>SLSNZ</strong> and<br />
it’s Volunteer Surf Lifeguards have likely saved more than<br />
11,000 lives.<br />
Table 1<br />
Surf Lifeguard Interventions 2009-19 (last 10yrs)<br />
SURF LIFEGUARD<br />
INTERVENTION<br />
TOTALS<br />
(2009-19)<br />
Rescues / Lives Saved 11,065<br />
Assists (new category since 2016/17) 5,002<br />
Preventative Actions<br />
Number of Public in Preventatives: 3,649,523<br />
948,130<br />
Searches 2,910<br />
Major First Aid Incidents 12,962<br />
Minor First Aid Incidents 6,652<br />
TOTAL INTERVENTIONS 986,721<br />
Figure 01<br />
2018–19: Qualifications Held by Surf Lifeguards<br />
There were a total of 4,903 proficient Surf Lifeguards in 2018-19, of which 982 were new recipients of the Surf Lifeguard<br />
Award. <strong>SLSNZ</strong> Surf Lifeguards currently hold a total of 9,655 awards, with 2,397 first aid awards and 1,591 craft<br />
qualifications (IRB and RWC).<br />
Figure 02<br />
2018-19: Patrolling Surf Lifeguards per Region<br />
Lifeguards (n)<br />
800<br />
700<br />
600<br />
500<br />
400<br />
300<br />
200<br />
100<br />
0<br />
FIRST AID<br />
2,397<br />
Male Lifeguards<br />
Female Lifeguards<br />
BOARD<br />
RESCUE<br />
MODULE<br />
540<br />
PATROL<br />
SUPPORT<br />
50<br />
ADVANCED<br />
LIFEGUARD<br />
AWARD<br />
320<br />
SURF LIFEGUARD<br />
AWARD<br />
4,903<br />
RADIO<br />
OPERATOR<br />
CERTIFICATE<br />
338<br />
IRB<br />
CREWSPERSONS<br />
MODULE<br />
536<br />
AUK BOP CAN GIS HKB MWT MBH NSN NTL OTA STL TKI WKO WGN WTC<br />
Region<br />
SENIOR<br />
LIFEGUARD<br />
AWARD<br />
PATROL<br />
CAPTAIN<br />
117<br />
SENIOR<br />
LIFEGUARD<br />
AWARD<br />
IRB DRIVER<br />
1,025<br />
RESCUE<br />
WATER<br />
CRAFT<br />
OPERATORS<br />
AWARD<br />
30<br />
SURF LIFE SAVING NEW ZEALAND<br />
10<br />
<strong>NATIONAL</strong> BEACH & COASTAL SAFETY REPORT<br />
SECTION ONE<br />
11<br />
CAPABILITY
SURF LIFE SAVING PATROL LOCATIONS<br />
SURF LIFEGUARD CAPABILITY<br />
Figure 03<br />
2018–19: Surf Life Saving Patrol Locations per Region<br />
There are a total of 74 Surf Life Saving Clubs in New Zealand who provide voluntary patrols, during varying season lengths<br />
between Labour and Easter weekends.<br />
SAVING PATROL LOCATIONS PER REGION<br />
Northland<br />
6<br />
Figure 04<br />
2018-19: Total Volunteer Surf Life Saving Patrols and Contract Surf Lifeguard Service per Region<br />
There are a total of 74 Surf Life Saving Clubs in New Zealand which provide voluntary patrols, up to a maximum season<br />
length between Labour and Easter weekends. The Contract Surf Lifeguard Service (Monday-Friday) provides 80 Lifeguard<br />
Patrols nationally.<br />
13<br />
Auckland<br />
Bay of Plenty<br />
14<br />
15<br />
12<br />
Volunteer Surf Life Saving Patrols<br />
Contract Surf Lifeguard Service<br />
5<br />
10<br />
Taranaki<br />
Waikato<br />
Gisborne<br />
5<br />
Patrols (n)<br />
9<br />
6<br />
Hawke’s Bay<br />
5<br />
3<br />
4 Manawatu-Wanganui<br />
1 Nelson<br />
ND Tasman<br />
0<br />
NTL AUK WKO BOP GIS TKI MWT HKB WGN NSN MBH WTC CAN OTA STL<br />
Region<br />
Wellington<br />
8<br />
Marlborough<br />
1<br />
2<br />
West Coast<br />
Canterbury<br />
10<br />
Figure 05<br />
2018-19: Equipment Used in a Rescue<br />
Figure 06<br />
2018-19: Patrolling Surf Lifeguards<br />
6%<br />
3%<br />
1<br />
Southland<br />
Otago<br />
6<br />
0 40 80 160 Kilometers<br />
16%<br />
38%<br />
Rescue<br />
Tube<br />
38%<br />
38%<br />
IRB<br />
38%<br />
Rescue Tube<br />
IRB<br />
Rescue Board<br />
RWC<br />
No Gear<br />
57%<br />
MALE<br />
43%<br />
FEMALE<br />
SURF LIFE SAVING NEW ZEALAND<br />
12<br />
<strong>NATIONAL</strong> BEACH & COASTAL SAFETY REPORT<br />
SECTION ONE<br />
13<br />
CAPABILITY
RESCUES PER REGION<br />
ASSISTS PER REGION<br />
“Rescue - Where a person requires immediate help to return to shore (or place of safety)<br />
and who without intervention would have suffered distress, injury or drowning”<br />
“Assist - Where a person requires assistance to return to shore but would most likely be<br />
able to get themselves out of danger if unaided”<br />
Figure 07<br />
ESCUES 2018–19: PER Rescues REGION<br />
per Region<br />
Figure 08<br />
2018–19: People Assisted to <strong>Safety</strong> per Region<br />
ASSISTS PER REGION<br />
Northland<br />
39<br />
Northland<br />
92<br />
186<br />
Auckland<br />
Bay of Plenty<br />
55<br />
311<br />
Auckland<br />
Bay of Plenty<br />
160<br />
182<br />
Waikato<br />
Gisborne<br />
19<br />
243<br />
Waikato<br />
Gisborne<br />
70<br />
17<br />
Taranaki<br />
28<br />
Taranaki<br />
Hawke’s Bay<br />
29<br />
Hawke’s Bay<br />
48<br />
20 Manawatu-Wanganui<br />
10 Nelson<br />
ND Tasman<br />
9 Manawatu-Wanganui<br />
36 Nelson<br />
ND Tasman<br />
Wellington<br />
11<br />
Wellington<br />
114<br />
Marlborough<br />
0<br />
Marlborough<br />
0<br />
0<br />
West Coast<br />
Canterbury<br />
76<br />
Key to Rescues per Region<br />
1 - 15 Rescues<br />
0<br />
West Coast<br />
Canterbury<br />
371<br />
Key to Assists per Region<br />
1 - 50 Assists<br />
16 - 25 Rescues<br />
51 - 100 Assists<br />
26 - 50 Rescues<br />
101 - 200 Assists<br />
51 - 100 Rescues<br />
201 - 300 Assists<br />
> 101 Rescues<br />
> 301 Assists<br />
Otago<br />
58<br />
ND<br />
No Data<br />
Otago<br />
79<br />
ND<br />
No Data<br />
0<br />
Southland<br />
0 40 80 160 Kilometers<br />
0<br />
Southland<br />
0 40 80 160 Kilometers<br />
SURF LIFE SAVING NEW ZEALAND<br />
14<br />
<strong>NATIONAL</strong> BEACH & COASTAL SAFETY REPORT<br />
SECTION ONE<br />
15<br />
CAPABILITY
MAJOR FIRST AID INCIDENTS PER REGION<br />
MINOR FIRST AID INCIDENTS PER REGION<br />
“Major First Aid - Any incident where a patient is administered some form of advanced<br />
medical treatment, or requires hospitalization”<br />
“Minor First Aid - Where a patient is administered some form of<br />
minor medical treatment”<br />
Figure 09<br />
R FIRST 2018–19: Major AID First INCIDENTS Aid Incidents per RegionPER REGION<br />
Figure 10<br />
MINOR FIRST<br />
2018–19:<br />
AID<br />
Minor First<br />
INCIDENTS<br />
Aid Incidents per Region<br />
PER REGION<br />
Northland<br />
15<br />
Northland<br />
142<br />
96<br />
Auckland<br />
Bay of Plenty<br />
55<br />
468<br />
Auckland<br />
Bay of Plenty<br />
388<br />
96<br />
Waikato<br />
Gisborne<br />
3<br />
821<br />
Waikato<br />
Gisborne<br />
30<br />
7<br />
Taranaki<br />
32<br />
Taranaki<br />
Hawke’s Bay<br />
8<br />
Hawke’s Bay<br />
49<br />
4 Manawatu-Wanganui<br />
3 Nelson<br />
ND Tasman<br />
18 Manawatu-Wanganui<br />
20 Nelson<br />
ND Tasman<br />
Wellington<br />
19<br />
Wellington<br />
132<br />
Marlborough<br />
0<br />
Marlborough<br />
27<br />
0<br />
West Coast<br />
Canterbury 13<br />
Key to Major First Aid Incidents<br />
1 - 5 Incidents<br />
0<br />
West Coast<br />
Canterbury<br />
135<br />
Key to Minor First Aid Incidents<br />
1 - 20 Incidents<br />
6 - 10 Incidents<br />
21 - 50 Incidents<br />
11 - 20 Incidents<br />
51 - 150 Incidents<br />
21 - 60 Incidents<br />
151 - 500 Incidents<br />
> 61 Incidents<br />
> 501 Incidents<br />
Otago<br />
7<br />
ND<br />
No Data<br />
Otago<br />
34<br />
ND<br />
No Data<br />
1<br />
Southland<br />
0 40 80 160 Kilometers<br />
3<br />
Southland<br />
0 40 80 160 Kilometers<br />
SURF LIFE SAVING NEW ZEALAND<br />
16<br />
<strong>NATIONAL</strong> BEACH & COASTAL SAFETY REPORT<br />
SECTION ONE<br />
17<br />
CAPABILITY
SEARCHES PER REGION<br />
PREVENTATIVE ACTIONS PER REGION<br />
“Search - Any organised search for a missing person or group either at sea or on land.<br />
Searches include body recoveries”<br />
“Preventative Action - Direct action taken to reduce or eliminate the probability of a<br />
specific rescue, first aid or other reportable incident occuring”<br />
Figure 11<br />
EARCHES<br />
2018–19: Patrol<br />
PER<br />
Searches<br />
REGION<br />
per Region<br />
Figure 12<br />
PREVENTATIVE<br />
2018–19:<br />
ACTIONS<br />
Preventative Actions<br />
PER<br />
per<br />
REGION<br />
Region<br />
Northland<br />
12<br />
Northland 3,787<br />
158<br />
Auckland<br />
Bay of Plenty<br />
57<br />
20,117 Auckland<br />
Bay of Plenty 13,888<br />
88<br />
Waikato<br />
Gisborne<br />
2<br />
34,388 Waikato<br />
Gisborne 2,728<br />
1<br />
Taranaki<br />
12,183<br />
Taranaki<br />
Hawke’s Bay<br />
7<br />
Hawke’s Bay 3,450<br />
9 Manawatu-Wanganui<br />
6 Nelson<br />
ND Tasman<br />
1,140 Manawatu-Wanganui<br />
58 Nelson<br />
ND Tasman<br />
Wellington<br />
19<br />
Wellington 3,088<br />
Marlborough<br />
0<br />
Marlborough<br />
128<br />
0<br />
West Coast<br />
Canterbury 16<br />
Key to Searches per Region<br />
1 - 5 Searches<br />
0<br />
West Coast<br />
Canterbury 18,134<br />
Key to Preventative Actions per Region<br />
1 - 1,000 Actions<br />
6 - 10 Searches<br />
1,001 - 5,000 Actions<br />
11 - 20 Searches<br />
5,001 - 15,000 Actions<br />
21 - 60 Searches<br />
15,001 - 25,000 Actions<br />
> 61 Searches<br />
> 25,000 Actions<br />
Otago<br />
5<br />
ND<br />
No Data<br />
Otago 5,197<br />
ND<br />
No Data<br />
0<br />
Southland<br />
0 40 80 160 Kilometers<br />
21<br />
Southland<br />
0 40 80 160 Kilometers<br />
SURF LIFE SAVING NEW ZEALAND<br />
18<br />
<strong>NATIONAL</strong> BEACH & COASTAL SAFETY REPORT<br />
SECTION ONE<br />
19<br />
CAPABILITY
FATA L D R O W N I N G<br />
ANALYSIS<br />
SECTION TWO<br />
10-YEAR OVERVIEW | 2009-19<br />
320 89%<br />
MALE<br />
BEACH &<br />
COASTAL FATAL<br />
DROWNINGS<br />
11%<br />
FEMALE<br />
LOCATION<br />
39%<br />
SURF BEACH<br />
15%<br />
ROCKY<br />
FORESHORE<br />
14%<br />
HARBOUR<br />
ACTIVITY<br />
22%<br />
SWIMMING/WADING<br />
20%<br />
FALLS<br />
15%<br />
BOATING
<strong>NATIONAL</strong> OVERVIEW<br />
10-YEAR OVERVIEW | 2009-19<br />
<strong>NATIONAL</strong> OVERVIEW<br />
10-YEAR OVERVIEW | 2009-19<br />
Each fatal drowning is a tragedy in its own right; it affects<br />
not only close family and friends but the wider community.<br />
The research presented here aims to report and categorise<br />
fatal drownings, to better inform strategic decision making<br />
for preventative educational programmes and community<br />
engagement initiatives. The following section focuses on<br />
fatal drownings that have occured between 2009-19.<br />
Between 2009-19 there were 320 fatal drownings.<br />
Auckland has the highest number of fatal drownings<br />
(n=96), followed by Northland (n=55) and Waikato (n=31).<br />
Surf beaches were the most dangerous environment with<br />
125 fatalities, followed by fatalities that occurred 0-1 km<br />
from shore (n=51) and within harbours (n=46) respectively.<br />
The majority of beach and coastal fatal drownings occurred<br />
while swimming/wading (n=71) followed by incidents due to<br />
falls (n=65) and boating (n=47).<br />
Figure 13<br />
2009-19: Total Number of New Zealand <strong>Beach</strong> and <strong>Coastal</strong> Fatal Drownings per Year (n=320); Comparison of New<br />
Zealand vs Australian <strong>Beach</strong> and <strong>Coastal</strong> Fatal Drowning Rates per 100,000 pop.<br />
Fatal Drownings (n)<br />
50<br />
45<br />
40<br />
35<br />
30<br />
25<br />
20<br />
15<br />
10<br />
5<br />
0<br />
Fatal Drownings<br />
NZ Fatal Drowning Rate<br />
AUS Fatal Drowning Rate<br />
2009-10 2010-11 2011-12 2012-13 2013-14 2014-15 2015-16 2016-17 2017-18 2018-19<br />
Year<br />
Figure 14<br />
2009-14 and 2014-19 Five-Year Average <strong>Beach</strong> and<br />
<strong>Coastal</strong> Fatal Drownings and Average Fatal Drowning<br />
Rate per 100,000 pop.<br />
2009-14<br />
AVERAGE<br />
DROWNING RATE<br />
0.70<br />
PER 100,000 POPULATION<br />
AVERAGE FATAL<br />
DROWNINGS<br />
27<br />
PER YEAR<br />
2014-19<br />
AVERAGE<br />
DROWNING RATE<br />
0.85<br />
PER 100,000 POPULATION<br />
AVERAGE FATAL<br />
DROWNINGS<br />
37<br />
PER YEAR<br />
The New Zealand beach and coastal fatal drowning<br />
numbers and fatal drowning rates per 100,000 pop. for<br />
2009-19 are shown above. The 2018-19 fatal drowning<br />
rate per 100,000 population in NZ is 0.70, which is below<br />
the 10-year average (0.78 per 100,000 pop.). The New<br />
Zealand 10-year average beach and coastal fatal drowning<br />
rate per 100,000 pop. is 70% higher than the Australian 10-<br />
year average fatal drowning rate per 100,000 pop. When<br />
comparing the first half of the decade (2009-14) to the latter<br />
(2014-2019), nationally there has been an increase from 27<br />
(2009-14) fatal drownings on average to 37 per year (2014-<br />
19).<br />
1.2<br />
1.0<br />
0.8<br />
0.6<br />
0.4<br />
0.2<br />
0.0<br />
Fatal Drowning Rate<br />
(per 100,000 pop.)<br />
The New Zealand 10-year<br />
average beach and coastal fatal<br />
drowning rate is 70% higher than<br />
the Australian 10-year average,<br />
and is on the increase.<br />
Figure 15<br />
2009-19: Total <strong>Beach</strong> and <strong>Coastal</strong> Fatal Drownings and Fatal Drowning Rate per 100,000 Population for the 16<br />
Regions (n=320)<br />
Between 2009-19 there were 320 fatal drownings. Auckland (n=96) experiences the highest fatal drowning number<br />
per region, followed by Northland (n=55). However, Northland had the highest average fatal drowning rate per<br />
region (3.29 per 100,000 pop.).<br />
Fatal Drownings (n)<br />
100<br />
80<br />
65<br />
40<br />
20<br />
0<br />
AUK<br />
NTL<br />
WKO<br />
Fatal Drownings<br />
Average Fatal Drowning Rate<br />
WGN<br />
Figure 16<br />
2009-19: Age Groups and Gender Represented in<br />
<strong>Beach</strong> and <strong>Coastal</strong> Fatal Drownings (n=320)<br />
Age groups above 15 years old have a fatal drowning<br />
toll over 44. The 35-44 age group has the highest fatal<br />
drowning number (n=58). The fatal drowning rate for<br />
males is greater than females across all age groups. The<br />
35-44 and 45-54 age groups have the highest Female fatal<br />
drowning rates. The 15-24 and 35-44 age groups have the<br />
highest Male fatal drowning rate.<br />
Fatal Drownings (n)<br />
60<br />
50<br />
40<br />
30<br />
20<br />
10<br />
Male<br />
Female<br />
BOP<br />
CAN<br />
HKB<br />
OTA<br />
STL<br />
Region<br />
89%<br />
MALE<br />
0<br />
0-4 5-14 15-24 25-34 35-44 45-54 55-64 65+<br />
Age<br />
More adults are fatally 11%<br />
11%<br />
drowning than children FEMALE<br />
TKI<br />
WTC<br />
MWT<br />
TAS<br />
More males are fatally<br />
drowning than females<br />
89%<br />
MBH<br />
MALE<br />
GIS<br />
NSN<br />
3.5<br />
3.0<br />
2.5<br />
2.0<br />
1.5<br />
1.0<br />
0.5<br />
0.0<br />
Fatal Drowning Rate<br />
(per 100,000 pop.)<br />
MALE<br />
11%<br />
89%<br />
FEMALE<br />
FEMALE<br />
SURF LIFE SAVING NEW ZEALAND<br />
22<br />
<strong>NATIONAL</strong> BEACH & COASTAL SAFETY REPORT<br />
SECTION TWO FATAL DROWNING ANALYSIS / 10 YEAR OVERVIEW 2009-19<br />
23
<strong>NATIONAL</strong> OVERVIEW<br />
10-YEAR OVERVIEW | 2009-19<br />
<strong>NATIONAL</strong> OVERVIEW<br />
10-YEAR OVERVIEW | 2009-19<br />
Figure 17<br />
2009-19 (10-Year Average) and 2018-19: Total <strong>Beach</strong> and <strong>Coastal</strong> Fatal Drownings by Ethnicity<br />
When analysing total fatal drownings per ethnicity, NZ Europeans represented the highest number (n=11) of total fatal<br />
drownings on average per year (2009-19), followed by Maori (n=9) and Pacific People (n=5). In 2018-19, the Asian fatal<br />
drowning total (n=6) was the only total that exceeded the 10-year average. NZ European (n=9), Maori (n=7) and Pacific<br />
Peoples (n=3) all had fatal drowning totals that dropped below their 10-year averages.<br />
Fatal Drownings (n)<br />
Rate (per 100,000 pop.)<br />
12<br />
10<br />
8<br />
6<br />
4<br />
2<br />
0<br />
2.0<br />
1.5<br />
1.04<br />
0.5<br />
0<br />
Average Fatal Drownings per Year (2009-19)<br />
Total Fatal Drownings (2018-19)<br />
ASIAN MAORI NZ EUROPEAN PACIFIC PEOPLES OTHER*<br />
Fatal Drowning Rate (2009-19)<br />
Fatal Drowning Rate (2018-19)<br />
Ethnicity<br />
Figure 18<br />
2009-19 (10-year average) and 2018-19: <strong>Beach</strong> and <strong>Coastal</strong> Fatal Drowning Rates by Ethnicity<br />
Between 2009-19, Pacific Peoples recorded the highest fatal drowning rate (1.69 per 100,000 pop.) of any ethnicity,<br />
followed by Maori (1.27 per 100,000 pop.) and Asian ethnicities (0.92 per 100,000 pop.). In 2018/19, Maori represented<br />
the highest fatal drowning rate of any ethnicity (0.92 per 100,000 pop.), closely followed by Asian (0.85 per 100,000 pop.)<br />
and Pacific Peoples (0.79 per 100,000 pop.). However, in 2018-19 all ethnicities recorded a drop in their fatal drowning<br />
rates when compared to the 10-year average.<br />
ASIAN MAORI NZ EUROPEAN PACIFIC PEOPLES OTHER*<br />
Ethnicity<br />
Between 2009-19, Pacific Peoples recorded the highest fatal<br />
drowning rate (1.69 per 100,000 pop.) of any ethnicity<br />
(*represents all other ethnicities)<br />
(*represents all other ethnicities)<br />
Figure 19<br />
2009-19: <strong>Beach</strong> and <strong>Coastal</strong> Fatal Drownings by Month (n=320)<br />
The highest percentage of beach and coastal fatal drownings occurred in January (n=56), followed by December (n=44)<br />
and February (n=44). Between 2009-19, 55% of drownings occurred outside of the summer months.<br />
Fatal Drownings (n)<br />
20<br />
15<br />
10<br />
5<br />
0<br />
Fatal Drownings<br />
Summer Season<br />
JUL AUG SEPT OCT NOV DEC JAN FEB MAR APR MAY JUN<br />
Figure 20<br />
2009-19 (10-year average) and 2018-199 <strong>Beach</strong> and <strong>Coastal</strong> Fatal Drownings per Activity<br />
The listed activities below represent the top eight causes of fatal drowning on beach and coastal areas (2009-19) and inform<br />
our national coastal safety priorities. In 2018-19, the number of drowning deaths while snorkelling, rock fishing, shell/net<br />
fishing, attempting a rescue and using watercraft were above the 10-year average. Swimming/wading, boating and fallrelated<br />
incidents were below the 10-year average.<br />
SWIMMING / WADING<br />
FALL<br />
BOATING<br />
WATERCRAFT<br />
2009-19<br />
7<br />
2009-19<br />
7<br />
2009-19<br />
5<br />
2009-19<br />
3<br />
2018-19<br />
6<br />
2018-19<br />
3<br />
2018-19<br />
0<br />
2018-19<br />
7<br />
Year<br />
SNORKELLING<br />
2009-19<br />
3<br />
ROCK FISHING<br />
2009-19<br />
3<br />
NET / SHELL FISHING<br />
2009-19<br />
2<br />
ATTEMPTING A RESCUE<br />
2009-19<br />
2<br />
2018-19<br />
5<br />
2018-19<br />
7<br />
2018-19<br />
1<br />
2018-19<br />
2<br />
SURF LIFE SAVING NEW ZEALAND<br />
<strong>NATIONAL</strong> BEACH & COASTAL SAFETY REPORT<br />
SECTION TWO FATAL DROWNING ANALYSIS / 10 YEAR OVERVIEW 2009-19<br />
24 25
2009-19 NZ FATAL DROWNINGS PER REGION<br />
10 YEAR OVERVIEW | 2009-19<br />
Fatal Drownings Per Region<br />
Northland<br />
55<br />
96<br />
Auckland<br />
Bay of Plenty<br />
23<br />
34<br />
Waikato<br />
Gisborne<br />
2<br />
8<br />
Taranaki<br />
Hawke’s Bay<br />
16<br />
4<br />
4<br />
Manawatu-Wanganui<br />
Tasman<br />
ND<br />
Nelson<br />
Wellington<br />
27<br />
Marlborough<br />
3<br />
7<br />
West Coast<br />
Canterbury<br />
18<br />
Key to 2009-19 Fatal Drownings<br />
1 - 5 Fatal Drownings<br />
6 - 15 Fatal Drownings<br />
16 - 25 Fatal Drownings<br />
26 - 50 Fatal Drownings<br />
> 51 Fatal Drownings<br />
Otago<br />
13<br />
ND<br />
No Data<br />
10<br />
Southland<br />
0 40 80 160 Kilometers<br />
SURF LIFE SAVING NEW ZEALAND <strong>NATIONAL</strong> BEACH AND COASTAL SAFETY REPORT SECTION TWO FATAL DROWNING ANALYSIS / 10 YEAR OVERVIEW 2009-19<br />
26 27
FATA L D R O W N I N G<br />
ANALYSIS<br />
SECTION THREE<br />
1-YEAR OVERVIEW | 2018-19<br />
33<br />
82%<br />
MALE<br />
BEACH &<br />
COASTAL FATAL<br />
DROWNINGS<br />
18%<br />
FEMALE<br />
LOCATION<br />
49%<br />
SURF BEACH<br />
18%<br />
ROCKY<br />
FORESHORE<br />
9%<br />
HARBOUR<br />
ACTIVITY<br />
21%<br />
ROCK FISHING<br />
21%<br />
WATERCRAFT<br />
18%<br />
SWIMMING/WADING
<strong>NATIONAL</strong> OVERVIEW<br />
1-YEAR OVERVIEW | 2018-19<br />
<strong>NATIONAL</strong> OVERVIEW<br />
1-YEAR OVERVIEW | 2018-19<br />
In 2018-19 there were 33 fatal drownings on beach and coastal areas. Auckland had the highest fatalities<br />
per region (n=9), followed by Northland (n=7) and Waikato (n=5).<br />
The majority of fatalities occurred while rock fishing (n=7) and using a watercraft (n=7), followed by<br />
swimming/wading (n=6).<br />
Surf beaches were the most dangerous environment with nearly half (n=16) of all fatalities occurring here.<br />
Figure 22<br />
2018-19: Total <strong>Beach</strong> and <strong>Coastal</strong> Fatal Drownings per Region (n=33)<br />
8-19 FATAL DROWNINGS PER REGION<br />
LOCATION<br />
49%<br />
SURF BEACH<br />
ACTIVITY<br />
2 Southland<br />
21%<br />
ROCK FISHING<br />
33<br />
9 Auckland 82%<br />
MALE<br />
5 Waikato<br />
18%<br />
BEACH &<br />
COASTAL FATAL<br />
DROWNINGS<br />
0<br />
18%<br />
ROCKY<br />
FORESHORE<br />
West Coast<br />
0<br />
21%<br />
WATERCRAFT<br />
0<br />
Otago 4<br />
Taranaki<br />
Northland<br />
FEMALE<br />
0 Manawatu-Wanganui<br />
ND Nelson<br />
Tasman<br />
9%<br />
HARBOUR<br />
18%<br />
SWIMMING/WADING<br />
0 40 80 160 Kilometers<br />
7<br />
Marlborough 1<br />
Canterbury 0<br />
Key to 2018-19 Fatal Drownings<br />
ND<br />
Bay of Plenty<br />
Wellington<br />
3<br />
1 - 2 Fatalities<br />
3 - 4 Fatalities<br />
5 - 7 Fatalities<br />
8 - 9 Fatalities<br />
> 10 Fatalities<br />
No Data<br />
1<br />
Hawke’s Bay<br />
Gisborne<br />
1<br />
0<br />
Figure 23<br />
2018-19: <strong>Beach</strong> and <strong>Coastal</strong> Fatal Drownings by Age<br />
and Gender (n=33)<br />
The age group representing the highest rate of fatal<br />
drownings is the 45-54 age group (0.18 rate per<br />
100,000 pop.). Within this age group (45-54) females made<br />
up almost half (44%) of the fatal drownings (n=4). Between<br />
2018-19, 82% of fatal drownings were male (n=27).<br />
Fatal Drownings (n)<br />
10<br />
8<br />
6<br />
4<br />
2<br />
0<br />
Male<br />
Female<br />
0-4 5-14 15-24 25-34 35-44 45-54 55-64 65+<br />
9%<br />
15%<br />
6%<br />
Rock Fishing<br />
Watercraft<br />
Swimming/Wading<br />
6%<br />
Age Groups<br />
3%<br />
22%<br />
Rock<br />
Fishing<br />
18%<br />
Snorkelling<br />
Fall<br />
Scuba Diving<br />
22%<br />
21%<br />
0.2<br />
0.16<br />
0.12<br />
0.08<br />
0.04<br />
0.0<br />
Attempting a Rescue<br />
Net/Shell Fishing<br />
Fatal Drowning Rate<br />
(per 100,000 pop.)<br />
Figure 24<br />
2018-19: <strong>Beach</strong> and <strong>Coastal</strong> Fatal Drownings by<br />
Activity (n=33)<br />
The majority of beach and coastal fatal drownings<br />
occurred while rock fishing (n=7) and using watercraft<br />
(n=7), followed by swimming/wading (n=6).<br />
Figure 25<br />
2018-19: <strong>Beach</strong> and <strong>Coastal</strong> Fatal Drownings by Month<br />
(n=33)<br />
Of the 33 fatal drownings, the majority (42%) occurred<br />
in January (n=8) and February (n=6). The yellow line<br />
indicates the 10-year average fatal drownings per month.<br />
June recorded 15% of all fatal drownings (n=5), with more<br />
than double the amount of fatal drownings when compared<br />
to the 10-year average (n=2).<br />
Fatal Drownings (n)<br />
8<br />
7<br />
6<br />
5<br />
4<br />
3<br />
2<br />
1<br />
Fatal Drownings (2018-19)<br />
Average Fatal Drownings (2009-19)<br />
0<br />
JUL AUG SEPT OCT NOV DEC JAN FEB MAR APR MAY JUN<br />
Month<br />
Figure 26<br />
2018-19: Location of <strong>Beach</strong> and <strong>Coastal</strong> Fatal<br />
Drownings (n=33)<br />
The majority of fatal drownings occurred at a surf<br />
beach (n=16), on rocky foreshores (n=6) or in<br />
harbours (n=3).<br />
9%<br />
6%<br />
3%<br />
3%<br />
3%<br />
9%<br />
49%<br />
Surf<br />
<strong>Beach</strong><br />
18%<br />
Surf <strong>Beach</strong><br />
Rocky Foreshore<br />
0-1km from Shore<br />
Harbour<br />
Estuary<br />
Calm Water <strong>Beach</strong><br />
49%<br />
Marinas<br />
Rivers<br />
SURF LIFE SAVING NEW ZEALAND<br />
<strong>NATIONAL</strong> BEACH & COASTAL SAFETY REPORT<br />
SECTION THREE FATAL DROWNING ANALYSIS / 1 YEAR OVERVIEW 2018-19<br />
30 31
N O N - FATA L<br />
DROWNING ANALYSIS<br />
SECTION FOUR<br />
10-YEAR OVERVIEW | 2009-19<br />
NON-FATAL DROWNING<br />
A subset of drowning, the process of experiencing<br />
respiratory impairment from submersion/<br />
immersion in liquid, where the outcome is<br />
classified as morbidity and no morbidity.<br />
253<br />
NON-FATAL<br />
DROWNING<br />
INCIDENTS<br />
AVERAGE NON-FATAL<br />
DROWNINGS<br />
PER YEAR<br />
25<br />
37%<br />
UNDER THE AGE OF<br />
25<br />
1:1.86<br />
RATIO FATAL : NON-FATAL<br />
DROWNING INCIDENTS<br />
(all ages)<br />
1:15<br />
0-14 YEARS OLD RATIO<br />
FATAL : NON-FATAL<br />
DROWNING INCIDENTS
NON-FATAL DROWNING OVERVIEW<br />
10-YEAR OVERVIEW | 2009-19<br />
COMPARISON OF NON-FATAL AND<br />
FATAL DROWNINGS ON NEW ZEALAND<br />
BEACHES BETWEEN 2009-19<br />
The focus of drowning prevention research has long<br />
been on fatal drowning. However, this is only part of the<br />
total drowning toll. Non-fatal drowning incidents are more<br />
difficult to quantify but are still significant and can often<br />
result in life-changing injuries and illnesses. The social cost<br />
to New Zealand of one severe water-related injury resulting<br />
in hospitalisation has been estimated at $472,900 (WSNZ,<br />
2019).<br />
Between 2009 and 2019, there were 253 cases of nonfatal<br />
drownings recorded on beaches, representing an<br />
average of 25 non-fatal beach drowning cases per year.<br />
For this report, we have assumed beach specific non-fatal<br />
data includes both surf and calm water beach types.<br />
*The non-fatal drowning data used in this report is based<br />
on hospital stays of at least 24 hours and has been provided<br />
by WSNZ’s as recorded in DrownBase. A large amount of<br />
environmental coding is set to ‘large body of water’ which<br />
does not allow for more specific data breakdown. There<br />
are likely more non-fatal cases that have occurred within<br />
the coastal environment; however, due to the hospital<br />
coding limitations highlighted above, many cases are<br />
indeterminable at this stage.<br />
To calculate the ratio of fatal to non-fatal drowning<br />
incidents, the total number (n=136*) of fatal beach drowning<br />
incidents (surf beach and calm water beach) was compared<br />
with the total number of non-fatal beach incidents (n=253).<br />
The average ratio of fatal to non-fatal drowning incidents<br />
from 2009-19 is 1:1.86. This figure indicates that for every<br />
fatal beach drowning, there are 1.86 non-fatal beach<br />
TOTAL FATAL<br />
DROWNINGS<br />
drowning incidents. The rate is highly variable across age<br />
groups – children and young adolescences (0-14) show the<br />
highest ratio (1:15), which indicates that for every fatal beach<br />
drowning, there are 15 non-fatal drowning incidents. On the<br />
other end of the spectrum, the 55 – 64 age group represents<br />
the lowest ratio (1.28), indicating that for every fatal beach<br />
drowning death, there are 1.28 non-fatal drownings.<br />
TOTAL NON-FATAL<br />
DROWNINGS<br />
NON-FATAL<br />
DROWNING INCIDENTS<br />
253<br />
BETWEEN 2009-19<br />
37%<br />
AVERAGE NON-FATAL<br />
DROWNING INCIDENTS<br />
25<br />
PER YEAR<br />
UNDER THE AGE OF<br />
25<br />
70%<br />
MALE<br />
30%<br />
FEMALE<br />
136 * 253<br />
RATIO FATAL : NON-FATAL<br />
1 : 1.86<br />
0-14 YEARS OLD RATIO<br />
FATAL : NON-FATAL 1 : 15<br />
55-64 YEARS OLD RATIO<br />
FATAL : NON-FATAL 1 : 1.28<br />
Figure 27<br />
2009-19: Non-Fatal Drowning Incidents on <strong>Beach</strong>es by Year and Gender (n=253)<br />
Figure 28<br />
2009-19: Fatal and Non-Fatal Drowning Incidents on <strong>Beach</strong>es by Year (n=389)<br />
Non-Fatal Drownings (n)<br />
50<br />
40<br />
30<br />
20<br />
10<br />
0<br />
Female<br />
Male<br />
2009-10 2010-11 2011-12 2012-13 2013-14 2014-15 2015-16 2016-17 2017-18 2018-19<br />
Year<br />
Drownings (n)<br />
60<br />
50<br />
40<br />
30<br />
20<br />
10<br />
0<br />
Non-Fatal Drownings<br />
Fatal Drownings<br />
2009-10 2010-11 2011-12 2012-13 2013-14 2014-15 2015-16 2016-17 2017-18 2018-19<br />
Year<br />
SURF LIFE SAVING NEW ZEALAND<br />
<strong>NATIONAL</strong> BEACH & COASTAL SAFETY REPORT<br />
SECTION FOUR NON-FATAL DROWNING ANALYSIS / 10 YEAR OVERVIEW 2009-19<br />
34 35
REGIONAL OVERVIEWS<br />
NZ Regions<br />
SECTION FIVE<br />
Northland<br />
Auckland<br />
Bay of Plenty<br />
Waikato<br />
Gisborne<br />
Taranaki<br />
Hawke’s Bay<br />
Manawatu-Wanganui<br />
Tasman<br />
Nelson<br />
Wellington<br />
Marlborough<br />
West Coast<br />
Canterbury<br />
Otago<br />
Southland
NORTHLAND<br />
FATAL DROWNING SNAPSHOT<br />
Figure 29<br />
2009-19: Northland <strong>Beach</strong> and <strong>Coastal</strong> Fatal<br />
Drownings (n=55)<br />
In 2018-19, there were seven fatal drownings in Northland.<br />
This figure was above the 10-year average of six. The 2018-<br />
19 fatal drowning rate per 100,000 pop. was 3.91, which is<br />
above the average 10-year rate (3.29); and higher than the<br />
rest of the country.<br />
Fatal Drownings (n)<br />
10<br />
9<br />
8<br />
7<br />
6<br />
5<br />
4<br />
3<br />
2<br />
1<br />
0<br />
2009-10<br />
2010-11<br />
Fatal Drownings<br />
Fatal Drowning Rate<br />
2011-12<br />
2012-13<br />
2013-14<br />
2014-15<br />
Year<br />
2015-16<br />
2016-17<br />
2017-18<br />
2018-19<br />
6.0<br />
5.0<br />
4.0<br />
3.0<br />
2.0<br />
1.0<br />
0.0<br />
Fatal Drowning Rate<br />
(per 100,000 pop.)<br />
Swimming/Wading<br />
Watercraft<br />
Net/Shell Fishing<br />
Fall<br />
Boating<br />
Snorkelling<br />
Rock Fishing<br />
Attempting a Rescue<br />
Figure 31<br />
Comparison of <strong>Beach</strong> and <strong>Coastal</strong> Fatal Drowning Rates per Activity: 2009-19 (10-year average) and 2018-19<br />
In 2018-19 fatal drownings per 100,000 pop. were lower than the 10-year average (2009-19) in swimming/wading,<br />
snorkelling, net/shell fishing and attempting a rescue activities. However, annual drowning rates per 100,000 pop. (2018-19)<br />
were up in falls, boating, watercraft and rock fishing activities when compared to the 10-year average.<br />
SWIMMING / WADING<br />
SNORKELLING<br />
FALL<br />
BOATING<br />
WATERCRAFT<br />
2009-19<br />
0.85<br />
2009-19<br />
0.29<br />
2009-19<br />
0.23<br />
2009-19<br />
0.25<br />
2018-19<br />
0.56<br />
2018-19<br />
0.56<br />
2018-19<br />
0.56<br />
2018-19<br />
2.23<br />
Figure 30<br />
2009-19: <strong>Beach</strong> and <strong>Coastal</strong> Fatal Drownings by<br />
Activity (n=55)<br />
Within the Northland region, the majority of beach and<br />
coastal fatalities occurred when swimming/wading (n=14),<br />
watercraft (n=12) and net/shell fishing (n=9).<br />
7%<br />
7%<br />
9%<br />
7%<br />
7%<br />
16%<br />
ROCK FISHING<br />
2009-19<br />
0.54<br />
2009-19<br />
0.24<br />
NET / SHELL FISHING<br />
2009-19<br />
0.24<br />
ATTEMPTING A RESCUE<br />
2009-19<br />
0.72<br />
25%<br />
22%<br />
2018-19<br />
0.00<br />
2018-19<br />
0.56<br />
2018-19<br />
0.00<br />
2018-19<br />
0.00<br />
10-YEAR OVERVIEW | 2009-19 1-YEAR OVERVIEW | 2018-19<br />
55<br />
Attempting a Rescue<br />
Boating<br />
Diving / Jumping<br />
Fall<br />
Net / Shell Fishing<br />
Rock Fishing<br />
Scuba Diving<br />
Snorkeling<br />
Swimming / Wading<br />
Watercraft<br />
TOTAL FATAL DROWNINGS: 55<br />
AVERAGE FATAL DROWNINGS<br />
6<br />
PER YEAR<br />
KEY DEMOGRAPHIC<br />
YEAR OLD MALE<br />
SWIMMERS/WADERS<br />
87%<br />
MALE<br />
13%<br />
FEMALE<br />
AVERAGE FATALITY<br />
3.29<br />
PER 100,000 POPULATION<br />
45+ 45+<br />
YEAR OLD<br />
MALE BOATERS<br />
FATAL DROWNINGS<br />
AVERAGE FATALITY<br />
7 3.91<br />
FATAL DROWNINGS BY LOCATION<br />
14%<br />
FATAL DROWNINGS BY ACTIVITY<br />
14%<br />
15%<br />
15%<br />
14%<br />
Surf <strong>Beach</strong><br />
0-1 Km from Shore<br />
14%<br />
Watercraft<br />
Fall<br />
57%<br />
Surf <strong>Beach</strong><br />
57%<br />
Watercraft<br />
PER 100,000 POPULATION<br />
Estuary<br />
Rivers<br />
Swimming/Wading<br />
Net/Shell Fishing<br />
57%<br />
57%<br />
38<br />
SURF LIFE SAVING NEW ZEALAND <strong>NATIONAL</strong> BEACH AND COASTAL SAFETY REPORT
AUCKLAND<br />
FATAL DROWNING SNAPSHOT<br />
Figure 32<br />
2009–19: Auckland <strong>Beach</strong> and <strong>Coastal</strong> Fatal<br />
Drownings (n=96)<br />
In 2018-19, there were nine fatal drownings in Auckland.<br />
This was just under the 10-year average of 10. The 2018-19<br />
fatal drowning rate per 100,000 was 0.53, this is below the<br />
average 10-year rate (0.63).<br />
Fatal Drownings (n)<br />
20<br />
15<br />
10<br />
5<br />
0<br />
2009-10<br />
Fatal Drownings<br />
Fatal Drowning Rate<br />
2010-11<br />
2011-12<br />
2012-13<br />
2013-14<br />
2014-15<br />
Year<br />
2015-16<br />
2016-17<br />
2017-18<br />
2018-19<br />
1.2<br />
1.0<br />
0.8<br />
0.6<br />
0.4<br />
0.2<br />
0.0<br />
Fatal Drowning Rate<br />
(per 100,000 pop.)<br />
Figure 33<br />
2009-19: <strong>Beach</strong> and <strong>Coastal</strong> Fatal Drownings by<br />
Activity (n=96)<br />
Within the Auckland region, the majority of beach and<br />
coastal fatalities occurred when swimming/wading (n=26),<br />
boating (n=24) and through falls (n=21).<br />
8%<br />
23%<br />
6%<br />
4%<br />
3% 2%<br />
26%<br />
28%<br />
Swimming/Wading<br />
Boating<br />
Fall<br />
Watercraft<br />
Rock Fishing<br />
Attempting a Rescue<br />
Snorkelling<br />
Net/Shell Fishing<br />
Figure 34<br />
Comparison of <strong>Beach</strong> and <strong>Coastal</strong> Fatal Drowning Rates per Activity: 2009-19 (10-year average) and 2018-19<br />
Fatal drownings per 100,000 population in 2018-19 were lower than the 10 year average in swimming/wading, falls,<br />
boating and net/shell fishing. However annual drowning rates (2018-19) were up in watercraft, snorkelling, rock fishing and<br />
attempting a rescue activities when compared to the 10-year average.<br />
SWIMMING / WADING<br />
FALL<br />
BOATING<br />
WATERCRAFT<br />
2009-19<br />
0.17<br />
2009-19<br />
0.14<br />
2009-19<br />
0.16<br />
2009-19<br />
0.04<br />
2018-19<br />
0.12<br />
2018-19<br />
0.00<br />
2018-19<br />
0.00<br />
2018-19<br />
0.06<br />
SNORKELLING<br />
ROCK FISHING<br />
2009-19<br />
0.02<br />
2009-19<br />
0.03<br />
NET / SHELL FISHING<br />
2009-19<br />
0.02<br />
ATTEMPTING A RESCUE<br />
2009-19<br />
0.05<br />
2018-19<br />
0.06<br />
2018-19<br />
0.18<br />
2018-19<br />
0.00<br />
2018-19<br />
0.06<br />
10-YEAR OVERVIEW | 2009-19 1-YEAR OVERVIEW | 2018-19<br />
96<br />
Attempting a Rescue<br />
Boating<br />
Diving / Jumping<br />
Fall<br />
Net / Shell Fishing<br />
Rock Fishing<br />
Scuba Diving<br />
Snorkeling<br />
93%<br />
MALE<br />
7%<br />
FEMALE<br />
Swimming / Wading<br />
Watercraft<br />
TOTAL FATAL DROWNINGS: 96<br />
AVERAGE FATAL DROWNINGS<br />
10<br />
PER YEAR<br />
AVERAGE FATALITY<br />
0.63<br />
PER 100,000 POPULATION<br />
KEY DEMOGRAPHIC<br />
15-34 45+<br />
YEAR OLD MALE YEAR OLD<br />
SWIMMERS/WADERS MALE BOATERS<br />
FATAL DROWNINGS<br />
AVERAGE FATALITY<br />
9 0.53<br />
FATAL DROWNINGS BY LOCATION<br />
FATAL DROWNINGS BY ACTIVITY<br />
11%<br />
11%<br />
11%<br />
11%<br />
11%<br />
11%<br />
Rock Fishing<br />
Swimming/Wading<br />
Scuba Diving<br />
78%<br />
Surf <strong>Beach</strong><br />
34%<br />
PER 100,000 POPULATION<br />
78%<br />
Surf <strong>Beach</strong> Harbour Estuary<br />
22%<br />
34%<br />
Snorkelling<br />
Watercraft<br />
Attempting a Rescue<br />
40<br />
SURF LIFE SAVING NEW ZEALAND <strong>NATIONAL</strong> BEACH AND COASTAL SAFETY REPORT
WAIKATO<br />
FATAL DROWNING SNAPSHOT<br />
Figure 35<br />
2009-19: Waikato <strong>Beach</strong> and <strong>Coastal</strong> Fatal Drownings<br />
In 2018-19, there were five fatal drownings in Waikato. This<br />
figure was above the 10-year average (2009-19) of three.<br />
The 2018-19 fatal drowning rate per 100,000 pop. was<br />
1.07, which is higher than the 10-year average drowning<br />
rate (0.78).<br />
Fatal Drownings (n)<br />
10<br />
9<br />
8<br />
7<br />
6<br />
5<br />
4<br />
3<br />
2<br />
1<br />
0<br />
2009-10<br />
Fatal Drownings<br />
Fatal Drowning Rate<br />
2010-11<br />
Figure 36<br />
2009-19: <strong>Beach</strong> and <strong>Coastal</strong> Fatal Drownings by<br />
Activity (n=34)<br />
Within the Waikato region, the majority of beach and<br />
coastal fatalities occurred when swimming/wading (n=8)<br />
and due to falls (n=5).<br />
Swimming/Wading<br />
Fall<br />
Boating<br />
Net/Shell Fishing<br />
Rock Fishing<br />
Snorkelling<br />
Attempting a Rescue<br />
Watercraft<br />
Figure 37<br />
Comparison of <strong>Beach</strong> and <strong>Coastal</strong> Fatal Drowning Rates per Activity: 2009-19 (10-year average) and 2018-19<br />
In 2018-19 fatal drownings per 100,000 pop. were lower than the 10-year average (2009-19) in the following activities;<br />
boating, watercraft, snorkelling, net/shell fishing and falls. However, annual drowning rates per 100,000 pop. (2018-19)<br />
were up in swimming/wading, rock fishing and attempting a rescue activities when compared to the 10-year average.<br />
SWIMMING / WADING<br />
FALL<br />
2011-12<br />
BOATING<br />
2012-13<br />
WATERCRAFT<br />
2013-14<br />
2014-15<br />
Year<br />
2009-19<br />
0.18<br />
2009-19<br />
0.12<br />
2009-19<br />
0.09<br />
2009-19<br />
0.02<br />
2015-16<br />
2016-17<br />
2017-18<br />
2018-19<br />
0.43<br />
2018-19<br />
0.00<br />
2018-19<br />
0.00<br />
2018-19<br />
0.00<br />
2018-19<br />
2.0<br />
1.8<br />
1.6<br />
1.4<br />
1.2<br />
1.0<br />
0.8<br />
0.6<br />
0.4<br />
0.2<br />
0.0<br />
Fatal Drowning Rate<br />
(per 100,000 pop.)<br />
13%<br />
13%<br />
13%<br />
4% 3% 13%<br />
SNORKELLING<br />
ROCK FISHING<br />
25%<br />
Swimming/<br />
Wading<br />
2009-19<br />
0.10<br />
2009-19<br />
0.09<br />
NET / SHELL FISHING<br />
2009-19<br />
0.11<br />
ATTEMPTING A RESCUE<br />
2009-19<br />
0.02<br />
25%<br />
16%<br />
2018-19<br />
0.00<br />
2018-19<br />
0.43<br />
2018-19<br />
0.00<br />
2018-19<br />
0.21<br />
10-YEAR OVERVIEW | 2009-19 1-YEAR OVERVIEW | 2018-19<br />
34<br />
Attempting a Rescue<br />
Boating<br />
Diving / Jumping<br />
Fall<br />
AVERAGE FATAL DROWNINGS<br />
3<br />
PER YEAR<br />
Net / Shell Fishing<br />
Rock Fishing<br />
Scuba Diving<br />
Snorkeling<br />
91%<br />
MALE<br />
9%<br />
FEMALE<br />
Swimming / Wading<br />
Watercraft<br />
TOTAL FATAL DROWNINGS: 34<br />
AVERAGE FATALITY<br />
0.78<br />
PER 100,000 POPULATION<br />
KEY DEMOGRAPHIC<br />
15-34 15-44<br />
YEAR OLD MALE YEAR OLD<br />
SWIMMERS/WADERS NET/SHELL FISHERMEN<br />
FATAL DROWNINGS<br />
AVERAGE FATALITY<br />
5 1.07<br />
FATAL DROWNINGS BY LOCATION<br />
FATAL DROWNINGS BY ACTIVITY<br />
40%<br />
20%<br />
20%<br />
80%<br />
Surf <strong>Beach</strong><br />
Surf <strong>Beach</strong><br />
40% 40%<br />
Swimming/<br />
Wading<br />
PER 100,000 POPULATION<br />
80%<br />
Rocky Foreshore<br />
40%<br />
Rock Fishing Swimming/Wading Attempting a Rescue<br />
42<br />
SURF LIFE SAVING NEW ZEALAND <strong>NATIONAL</strong> BEACH AND COASTAL SAFETY REPORT
BAY OF PLENTY<br />
FATAL DROWNING SNAPSHOT<br />
Figure 38<br />
2009-19: Bay of Plenty <strong>Beach</strong> and <strong>Coastal</strong> Fatal<br />
Drownings<br />
In 2018-19, beach and coastal drownings in the Bay of<br />
Plenty dropped below the 10-year average (2009-19). The<br />
2018-19 fatal drowning rate per 100,000 pop. was 0.33,<br />
which was lower than the 10-year average rate (0.80).<br />
Fatal Drownings (n)<br />
5<br />
4<br />
3<br />
2<br />
1<br />
0<br />
2009-10<br />
Fatal Drownings<br />
2010-11<br />
Figure 39<br />
2009-19: <strong>Beach</strong> and <strong>Coastal</strong> Fatal Drownings by<br />
Activity (n=23)<br />
Within the Bay of Plenty region, the majority of beach and<br />
coastal fatalities occurred due to falls (n=8), boating (n=5)<br />
and swimming/wading (n=3).<br />
Fall<br />
Boating<br />
Swimming/Wading<br />
Snorkelling<br />
Rock Fishing<br />
Watercraft<br />
Attempting a Rescue<br />
Figure 40<br />
Comparison of <strong>Beach</strong> and <strong>Coastal</strong> Fatal Drowning Rates per Activity: 2009-19 (10-year average) and 2018-19<br />
In 2018-19 fatal drownings per 100,000 pop. were lower than the 10-year average in most activities, watercraft related<br />
activities were the exception.<br />
SWIMMING / WADING<br />
FALL<br />
2011-12<br />
BOATING<br />
2012-13<br />
WATERCRAFT<br />
2013-14<br />
Fatal Drowning Rate<br />
2014-15<br />
Year<br />
2009-19<br />
0.10<br />
2009-19<br />
0.80<br />
2009-19<br />
0.18<br />
2015-16<br />
2009-19<br />
0.07<br />
2016-17<br />
2017-18<br />
2018-19<br />
0.00<br />
2018-19<br />
0.00<br />
2018-19<br />
0.00<br />
2018-19<br />
0.33<br />
2018-19<br />
2.0<br />
1.8<br />
1.6<br />
1.4<br />
1.2<br />
1.0<br />
0.8<br />
0.6<br />
0.4<br />
0.2<br />
0.0<br />
Fatal Drowning Rate<br />
(per 100,000 pop.)<br />
9%<br />
9%<br />
13%<br />
8%<br />
4%<br />
SNORKELLING<br />
ROCK FISHING<br />
35%<br />
Fall<br />
22%<br />
2009-19<br />
0.07<br />
2009-19<br />
0.07<br />
NET / SHELL FISHING<br />
2009-19<br />
0.00<br />
ATTEMPTING A RESCUE<br />
2009-19<br />
0.04<br />
35%<br />
2018-19<br />
0.00<br />
2018-19<br />
0.00<br />
2018-19<br />
0.00<br />
2018-19<br />
0.00<br />
10-YEAR OVERVIEW | 2009-19 1-YEAR OVERVIEW | 2018-19<br />
23<br />
Attempting a Rescue<br />
Boating<br />
Diving / Jumping<br />
Fall<br />
AVERAGE FATAL DROWNINGS<br />
2<br />
PER YEAR<br />
KEY DEMOGRAPHIC<br />
45+<br />
YEAR OLD MALES<br />
Net / Shell Fishing<br />
Rock Fishing<br />
Scuba Diving<br />
Snorkeling<br />
86%<br />
MALE<br />
14%<br />
FEMALE<br />
Swimming / Wading<br />
Watercraft<br />
TOTAL FATAL DROWNINGS: 23<br />
AVERAGE FATALITY<br />
0.80<br />
PER 100,000 POPULATION<br />
FALLS<br />
FATAL DROWNINGS<br />
AVERAGE FATALITY<br />
1 0.33<br />
FATAL DROWNINGS BY LOCATION<br />
100%<br />
Harbour<br />
FATAL DROWNINGS BY ACTIVITY<br />
100%<br />
Watercraft<br />
PER 100,000 POPULATION<br />
44<br />
SURF LIFE SAVING NEW ZEALAND <strong>NATIONAL</strong> BEACH AND COASTAL SAFETY REPORT
GISBORNE<br />
FATAL DROWNING SNAPSHOT<br />
Figure 41<br />
2009-19: Gisborne <strong>Beach</strong> and <strong>Coastal</strong> Fatal Drownings<br />
There were a total of two fatal drownings in the Gisborne<br />
region between 2009-19. These drownings occurred in back<br />
to back years (2013-14, 2014-15).<br />
Fatal Drownings (n)<br />
2<br />
1<br />
0<br />
2009-10<br />
Fatal Drownings<br />
Fatal Drowning Rate<br />
2010-11<br />
2011-12<br />
2012-13<br />
2013-14<br />
2014-15<br />
Year<br />
2015-16<br />
2016-17<br />
2017-18<br />
2018-19<br />
2.5<br />
2.0<br />
1.5<br />
1.0<br />
0.5<br />
0.0<br />
Fatal Drowning Rate<br />
(per 100,000 pop.)<br />
Figure 42<br />
2009-19: <strong>Beach</strong> and <strong>Coastal</strong> Fatal Drownings by<br />
Activity (n=2)<br />
Within the Gisborne region, one fatal drowning was related<br />
to snorkelling, and one was attributed to diving/jumping.<br />
Snorkelling<br />
Diving/Jumping<br />
Figure 43<br />
Comparison of <strong>Beach</strong> and <strong>Coastal</strong> Fatal Drowning Rates per Activity: 2009-19 (10-year average) and 2018-19<br />
In 2018-19, fatal drowning rates (per 100,000 pop.) were lower than the 10-year average in all activities.<br />
50%<br />
50%<br />
Diving/<br />
Jumping<br />
50%<br />
Snorkelling<br />
50%<br />
10-YEAR OVERVIEW | 2009-19 1-YEAR OVERVIEW | 2018-19<br />
Attempting a Rescue<br />
Boating<br />
Diving / Jumping<br />
Fall<br />
Net / Shell Fishing<br />
Rock Fishing<br />
Scuba Diving<br />
Snorkeling<br />
2<br />
Swimming / Wading<br />
Watercraft<br />
FATAL DROWNINGS<br />
AVERAGE FATALITY<br />
0 0.00<br />
FATAL DROWNINGS BY LOCATION<br />
ZERO<br />
Fatal<br />
Drownings<br />
PER 100,000 POPULATION<br />
SNORKELLING<br />
SWIMMING / WADING<br />
FALL<br />
BOATING<br />
WATERCRAFT<br />
2009-19<br />
0.00<br />
2009-19<br />
0.00<br />
2009-19<br />
0.00<br />
2009-19<br />
0.00<br />
2018-19<br />
0.00<br />
2018-19<br />
0.00<br />
2018-19<br />
0.00<br />
0.00<br />
ROCK FISHING<br />
2009-19<br />
0.21<br />
2009-19<br />
0.00<br />
NET / SHELL FISHING<br />
2009-19<br />
0.00<br />
ATTEMPTING A RESCUE<br />
2009-19<br />
2018-19 0.00<br />
JUMPING/DIVING<br />
2009-19<br />
0.21<br />
2018-19<br />
0.00<br />
2018-19<br />
0.00<br />
2018-19<br />
0.00<br />
2018-19<br />
0.00<br />
2018-19<br />
0.00<br />
TOTAL FATAL DROWNINGS: 2<br />
AVERAGE FATAL DROWNINGS AVERAGE FATALITY<br />
HAWKE’S BAY<br />
FATAL DROWNING SNAPSHOT<br />
Figure 44<br />
2009-19: Hawke’s Bay <strong>Beach</strong> and <strong>Coastal</strong> Fatal<br />
Drownings<br />
In 2018-19, there was a single fatal drowning in Hawke’s<br />
Bay, which is below the 10-year average of (n=2). The 2018-<br />
19 fatal drowning rate per 100,000 pop. was one, which is<br />
lower than the average 10-year rate (1.0).<br />
Fatal Drownings (n)<br />
5<br />
4<br />
3<br />
2<br />
1<br />
0<br />
2009-10<br />
Fatal Drownings<br />
Fatal Drowning Rate<br />
2010-11<br />
Figure 45<br />
2009-19: <strong>Beach</strong> and <strong>Coastal</strong> Fatal Drownings by<br />
Activity (n=16)<br />
Within the Hawke’s Bay region, the majority of beach and<br />
coastal fatalities occurred when attempting a rescue (n=4),<br />
due to falls (n=4) and swimming/wading (n=3).<br />
Attempting a Rescue<br />
Fall<br />
Swimming/Wading<br />
Boating<br />
Rock Fishing<br />
Figure 46<br />
Comparison of <strong>Beach</strong> and <strong>Coastal</strong> Fatal Drowning Rates per Activity: 2009-19 (10-year average) and 2018-19<br />
In 2018-19, fatal drowning rates (per 100,000 pop.) were lower than the 10-year average in all activities. However, scuba<br />
diving, had a rate of 0.60, which was higher than the average 10-year fatal drowning rate (0.19).<br />
SWIMMING / WADING<br />
FALL<br />
2011-12<br />
BOATING<br />
2012-13<br />
WATERCRAFT<br />
2013-14<br />
2014-15<br />
Year<br />
2009-19<br />
0.18<br />
2009-19<br />
0.25<br />
2009-19<br />
0.13<br />
2015-16<br />
2009-19<br />
0.00<br />
2016-17<br />
2017-18<br />
2018-19<br />
2018-19<br />
0.00<br />
2018-19<br />
0.00<br />
2018-19<br />
0.00<br />
2018-19<br />
0.00<br />
3.0<br />
2.5<br />
2.0<br />
1.5<br />
1.0<br />
0.5<br />
0.0<br />
Fatal Drowning Rate<br />
(per 100,000 pop.)<br />
21%<br />
14%<br />
7%<br />
SNORKELLING<br />
29%<br />
Attempting<br />
a Rescue<br />
ROCK FISHING<br />
NET / SHELL FISHING<br />
29%<br />
2009-19<br />
0.00<br />
2009-19<br />
0.06<br />
2009-19<br />
0.00<br />
ATTEMPTING A RESCUE<br />
2009-19<br />
0.25<br />
29%<br />
2018-19<br />
0.00<br />
2018-19<br />
0.00<br />
2018-19<br />
0.00<br />
2018-19<br />
0.00<br />
10-YEAR OVERVIEW | 2009-19 1-YEAR OVERVIEW | 2018-19<br />
Attempting a Rescue<br />
Boating<br />
Diving / Jumping<br />
Fall<br />
AVERAGE FATAL DROWNINGS<br />
2<br />
PER YEAR<br />
KEY DEMOGRAPHIC<br />
35-54<br />
YEAR OLD MALES<br />
Net / Shell Fishing<br />
Rock Fishing<br />
Scuba Diving<br />
Snorkeling<br />
81%<br />
MALE<br />
19%<br />
FEMALE<br />
16<br />
Swimming / Wading<br />
Watercraft<br />
TOTAL FATAL DROWNINGS: 16<br />
AVERAGE FATALITY<br />
1.00<br />
PER 100,000 POPULATION<br />
SCUBA DIVERS<br />
FATAL DROWNINGS<br />
AVERAGE FATALITY<br />
1 0.60<br />
FATAL DROWNINGS BY LOCATION<br />
100%<br />
Surf <strong>Beach</strong><br />
FATAL DROWNINGS BY ACTIVITY<br />
100%<br />
Scuba Diving<br />
PER 100,000 POPULATION<br />
48<br />
SURF LIFE SAVING NEW ZEALAND <strong>NATIONAL</strong> BEACH AND COASTAL SAFETY REPORT
TARANAKI<br />
FATAL DROWNING SNAPSHOT<br />
Figure 47<br />
2009-19: Taranaki <strong>Beach</strong> and <strong>Coastal</strong> Fatal Drownings<br />
In 2018-19, there were no fatal drownings in Taranaki,<br />
which is below the 10-year average (n=1). The 2009-19<br />
fatal drowning rate per 100,000 pop. was 0.71.<br />
Fatal Drownings (n)<br />
4<br />
3<br />
2<br />
1<br />
0<br />
2009-10<br />
2010-11<br />
2011-12<br />
2012-13<br />
2013-14<br />
Fatal Drownings<br />
Fatal Drowning Rate<br />
2014-15<br />
Year<br />
2015-16<br />
2016-17<br />
2017-18<br />
2018-19<br />
3.0<br />
2.5<br />
2.0<br />
1.5<br />
1.0<br />
0.5<br />
0.0<br />
Fatal Drowning Rate<br />
(per 100,000 pop.)<br />
Figure 48<br />
2009-19: <strong>Beach</strong> and <strong>Coastal</strong> Fatal Drownings by<br />
Activity (n=8)<br />
Within the Taranaki region, the majority of beach and<br />
coastal fatalities occurred due to falls (n=3).<br />
Figure 49<br />
Comparison of <strong>Beach</strong> and <strong>Coastal</strong> Fatal Drowning Rates per Activity: 2009-19 (10-year average) and 2018-19<br />
In 2018-19, fatal drowning rates (per 100,000 pop.) were lower than the 10-year average in all activities.<br />
13%<br />
13%<br />
13%<br />
38%<br />
Fall<br />
13%<br />
38%<br />
Fall<br />
Swimming/Wading<br />
Boating<br />
Rock Fishing<br />
Attempting a Rescue<br />
10-YEAR OVERVIEW | 2009-19 1-YEAR OVERVIEW | 2018-19<br />
8<br />
Attempting a Rescue<br />
Boating<br />
Diving / Jumping<br />
Fall<br />
Net / Shell Fishing<br />
Rock Fishing<br />
Scuba Diving<br />
Snorkeling<br />
Swimming / Wading<br />
Watercraft<br />
TOTAL FATAL DROWNINGS: 8<br />
FATAL DROWNINGS<br />
AVERAGE FATALITY<br />
0 0.00<br />
FATAL DROWNINGS BY LOCATION<br />
ZERO<br />
Fatal<br />
Drownings<br />
PER 100,000 POPULATION<br />
SWIMMING / WADING<br />
SNORKELLING<br />
FALL<br />
2009-19<br />
0.09<br />
2018-19<br />
0.00<br />
ROCK FISHING<br />
2009-19<br />
0.00<br />
2018-19<br />
0.00<br />
AVERAGE FATAL DROWNINGS<br />
1<br />
PER YEAR<br />
AVERAGE FATALITY<br />
0.71<br />
PER 100,000 POPULATION<br />
FATAL DROWNINGS BY ACTIVITY<br />
BOATING<br />
WATERCRAFT<br />
2009-19<br />
0.27<br />
2009-19<br />
0.09<br />
2009-19<br />
0.09<br />
2018-19<br />
0.00<br />
2018-19<br />
0.00<br />
2018-19<br />
0.00<br />
2009-19<br />
0.09<br />
NET / SHELL FISHING<br />
2009-19<br />
0.00<br />
ATTEMPTING A RESCUE<br />
2009-19<br />
0.09<br />
2018-19<br />
0.00<br />
2018-19<br />
0.00<br />
2018-19<br />
0.00<br />
88%<br />
MALE<br />
12%<br />
FEMALE<br />
ZERO<br />
Fatal<br />
Drownings<br />
50<br />
SURF LIFE SAVING NEW ZEALAND <strong>NATIONAL</strong> BEACH AND COASTAL SAFETY REPORT
MANAWATU-WANGANUI<br />
FATAL DROWNING SNAPSHOT<br />
Figure 50<br />
2009-19: Manawatu-Wanganui <strong>Beach</strong> and <strong>Coastal</strong><br />
Fatal Drownings<br />
In 2018-19, there were no fatal drownings in Manawatu-<br />
Wanganui. The 2009-19 fatal drowning rate per 100,000<br />
pop. was 0.17.<br />
Fatal Drownings (n)<br />
3<br />
2<br />
1<br />
0<br />
2009-10<br />
Fatal Drownings<br />
Fatal Drowning Rate<br />
2010-11<br />
Figure 51<br />
2009-19: <strong>Beach</strong> and <strong>Coastal</strong> Fatal Drownings by<br />
Activity (n=4)<br />
Within the Manawatu-Wanganui region, three fatal<br />
drownings occurred when swimming/wading, one was<br />
related to snorkelling.<br />
Figure 52<br />
Comparison of <strong>Beach</strong> and <strong>Coastal</strong> Fatal Drowning Rates per Activity: 2009-19 (10-year average) and 2018-19<br />
In 2018-19, fatal drowning rates (per 100,000 pop.) were lower than the 10-year average in all activities.<br />
SWIMMING / WADING<br />
FALL<br />
2011-12<br />
BOATING<br />
2012-13<br />
WATERCRAFT<br />
2013-14<br />
2014-15<br />
Year<br />
2009-19<br />
0.13<br />
2015-16<br />
2009-19<br />
0.00<br />
2009-19<br />
0.00<br />
2009-19<br />
0.00<br />
2016-17<br />
2017-18<br />
2018-19<br />
2018-19<br />
0.00<br />
2018-19<br />
0.00<br />
2018-19<br />
0.00<br />
2018-19<br />
0.00<br />
1.0<br />
0.8<br />
0.6<br />
0.4<br />
0.2<br />
0.0<br />
Fatal Drowning Rate<br />
(per 100,000 pop.)<br />
25%<br />
SNORKELLING<br />
ROCK FISHING<br />
75%<br />
2009-19<br />
0.04<br />
2009-19<br />
0.00<br />
NET / SHELL FISHING<br />
2009-19<br />
0.00<br />
ATTEMPTING A RESCUE<br />
2009-19<br />
0.00<br />
75%<br />
2018-19<br />
0.00<br />
2018-19<br />
0.00<br />
2018-19<br />
0.00<br />
2018-19<br />
0.00<br />
Swimming/Wading<br />
Snorkelling<br />
10-YEAR OVERVIEW | 2009-19 1-YEAR OVERVIEW | 2018-19<br />
Attempting a Rescue<br />
Boating<br />
Diving / Jumping<br />
Fall<br />
AVERAGE FATAL DROWNINGS<br />
WELLINGTON<br />
FATAL DROWNING SNAPSHOT<br />
Figure 53<br />
2009-19: Wellington <strong>Beach</strong> and <strong>Coastal</strong> Fatal<br />
Drownings<br />
In 2018-19, there were three fatal drownings in Wellington,<br />
which is equal to the 10-year average (2009-19). The 2018-<br />
19 fatal drowning rate per 100,000 pop. was lower than the<br />
average 10-year rate (0.68).<br />
Fatal Drownings (n)<br />
6<br />
5<br />
4<br />
3<br />
2<br />
1<br />
0<br />
2010-11<br />
Fatal Drownings<br />
Fatal Drowning Rate<br />
2011-12<br />
Figure 54<br />
2009-19: <strong>Beach</strong> and <strong>Coastal</strong> Fatal Drownings by<br />
Activity (n=27)<br />
Within the Wellington region, the majority of beach and<br />
coastal fatalities occurred when swimming/wading (n=7),<br />
watercraft (n=5) and caused by falls (n=5).<br />
Swimming/Wading<br />
Fall<br />
Watercraft<br />
Snorkelling<br />
Boating<br />
Attempting a Rescue<br />
Net/Shell Fishing<br />
Figure 55<br />
Comparison of <strong>Beach</strong> and <strong>Coastal</strong> Fatal Drowning Rates per Activity: 2009-19 (10-year average) and 2018-19<br />
In 2018-19, fatal drownings per 100,000 pop. were lower than the 10-year average (2009-19) in boating, snorkelling, net/<br />
shell fishing and attempting a rescue activities. However, annual drowning rates (2018-19) were up in swimming/wading,<br />
watercraft activities and falls when compared to the 10-year average.<br />
SWIMMING / WADING<br />
FALL<br />
2012-13<br />
BOATING<br />
WATERCRAFT<br />
2013-14<br />
2014-15<br />
Year<br />
2015-16<br />
2009-19<br />
0.18<br />
2009-19<br />
0.13<br />
2009-19<br />
0.08<br />
2009-19<br />
0.12<br />
2016-17<br />
2017-18<br />
2018-19<br />
0.19<br />
2018-19<br />
0.19<br />
2018-19<br />
0.00<br />
2018-19<br />
0.19<br />
2018-19<br />
1.2<br />
1.0<br />
0.8<br />
0.6<br />
0.4<br />
0.2<br />
0.0<br />
Fatal Drowning Rate<br />
(per 100,000 pop.)<br />
12%<br />
11%<br />
8%<br />
19%<br />
4%<br />
SNORKELLING<br />
ROCK FISHING<br />
27%<br />
Swimming/<br />
Wading<br />
2009-19<br />
0.07<br />
2009-19<br />
0.00<br />
NET / SHELL FISHING<br />
2009-19<br />
0.03<br />
ATTEMPTING A RESCUE<br />
2009-19<br />
0.05<br />
27%<br />
19%<br />
2018-19<br />
0.00<br />
2018-19<br />
0.00<br />
2018-19<br />
0.00<br />
2018-19<br />
0.00<br />
10-YEAR OVERVIEW | 2009-19 1-YEAR OVERVIEW | 2018-19<br />
Attempting a Rescue<br />
Boating<br />
Diving / Jumping<br />
Fall<br />
AVERAGE FATAL DROWNINGS<br />
3<br />
PER YEAR<br />
KEY DEMOGRAPHIC<br />
25-34<br />
YEAR OLD MALES<br />
Net / Shell Fishing<br />
Rock Fishing<br />
Scuba Diving<br />
Snorkeling<br />
87%<br />
MALE<br />
13%<br />
FEMALE<br />
27<br />
FATAL<br />
Swimming / Wading<br />
Watercraft<br />
TOTAL FATAL DROWNINGS: 27<br />
AVERAGE FATALITY<br />
0.68<br />
PER 100,000 POPULATION<br />
SWIMMERS/WADERS<br />
FATAL DROWNINGS<br />
AVERAGE FATALITY<br />
3 0.58<br />
DROWNINGS BY LOCATION<br />
33%<br />
FATAL DROWNINGS BY ACTIVITY<br />
33%<br />
34%<br />
Calm Water<br />
<strong>Beach</strong><br />
33%<br />
PER 100,000 POPULATION<br />
34%<br />
Fall<br />
33%<br />
34%<br />
Calm Water <strong>Beach</strong> Harbour Rocky Foreshore<br />
34%<br />
Fall Swimming/Wading Watercraft<br />
54<br />
SURF LIFE SAVING NEW ZEALAND <strong>NATIONAL</strong> BEACH AND COASTAL SAFETY REPORT
TASMAN<br />
FATAL DROWNING SNAPSHOT<br />
Figure 56<br />
2009-19: Tasman <strong>Beach</strong> and <strong>Coastal</strong> Fatal Drownings<br />
In 2018-19, there were no fatal drownings in Tasman. The<br />
2009-19 fatal drowning rate per 100,000 pop. was 0.82.<br />
2<br />
Fatal Drownings<br />
Fatal Drowning Rate<br />
2.5<br />
Figure 57<br />
2009-19: <strong>Beach</strong> and <strong>Coastal</strong> Fatal Drownings by<br />
Activity (n=4)<br />
Within the Tasman region, fatal drownings occurred when<br />
swimming/wading (n=2), rock fishing (n=1) and shell/net<br />
fishing (n=1).<br />
10-YEAR OVERVIEW | 2009-19 1-YEAR OVERVIEW | 2018-19<br />
FATAL DROWNINGS<br />
AVERAGE FATALITY<br />
0 0.00<br />
PER 100,000 POPULATION<br />
Fatal Drownings (n)<br />
1<br />
0<br />
2009-10<br />
2010-11<br />
2011-12<br />
2012-13<br />
2013-14<br />
Year<br />
2014-15<br />
Figure 58<br />
Comparison of <strong>Beach</strong> and <strong>Coastal</strong> Fatal Drowning Rates per Activity: 2009-19 (10-year average) and 2018-19<br />
In 2018-19, fatal drowning rates (per 100,000 pop.) were lower than the 10-year average in all activities.<br />
SWIMMING / WADING<br />
2015-16<br />
2016-17<br />
2017-18<br />
2018-19<br />
2.0<br />
1.5<br />
1.0<br />
0.5<br />
0.0<br />
Fatal Drowning Rate<br />
(per 100,000 pop.)<br />
25%<br />
25%<br />
SNORKELLING<br />
75%<br />
50%<br />
Swimming/Wading<br />
Rock Fishing<br />
Net/Shell Fishing<br />
Attempting a Rescue<br />
Boating<br />
Diving / Jumping<br />
Fall<br />
Net / Shell Fishing<br />
Rock Fishing<br />
Scuba Diving<br />
Snorkeling<br />
4<br />
Swimming / Wading<br />
Watercraft<br />
TOTAL FATAL DROWNINGS: 4<br />
FATAL DROWNINGS BY LOCATION<br />
ZERO<br />
Fatal<br />
Drownings<br />
FALL<br />
BOATING<br />
WATERCRAFT<br />
2009-19<br />
0.42<br />
2009-19<br />
0.00<br />
2009-19<br />
0.00<br />
2009-19<br />
0.00<br />
2018-19<br />
0.00<br />
2018-19<br />
0.00<br />
2018-19<br />
0.00<br />
2018-19<br />
0.00<br />
ROCK FISHING<br />
2009-19<br />
0.00<br />
2009-19<br />
0.23<br />
NET / SHELL FISHING<br />
2009-19<br />
0.20<br />
ATTEMPTING A RESCUE<br />
2009-19<br />
0.00<br />
2018-19<br />
0.00<br />
2018-19<br />
0.00<br />
2018-19<br />
0.00<br />
2018-19<br />
0.00<br />
AVERAGE FATAL DROWNINGS<br />
MARLBOROUGH<br />
FATAL DROWNING SNAPSHOT<br />
Figure 59<br />
2009-19: Marlborough <strong>Beach</strong> and <strong>Coastal</strong> Fatal<br />
Drownings<br />
In 2018-19, there was one fatal drowning in Marlborough.<br />
The 2018-19 fatal drowning rate per 100,000 pop was<br />
2.15, which is higher than the 10-year average (0.65).<br />
Fatal Drownings (n)<br />
2<br />
1<br />
0<br />
2009-10<br />
Fatal Drownings<br />
Fatal Drowning Rate<br />
2010-11<br />
2011-12<br />
2012-13<br />
2013-14<br />
2014-15<br />
Year<br />
2015-16<br />
2016-17<br />
2017-18<br />
2018-19<br />
2.5<br />
2.0<br />
1.5<br />
1.0<br />
0.5<br />
0.0<br />
Fatal Drowning Rate<br />
(per 100,000 pop.)<br />
Figure 60<br />
2009-19: <strong>Beach</strong> and <strong>Coastal</strong> Fatal Drownings by<br />
Activity (n=3)<br />
Within the Marlborough region, two fatal drownings were<br />
related to falls, and 1 was attributed to scuba diving.<br />
Figure 61<br />
Comparison of <strong>Beach</strong> and <strong>Coastal</strong> Fatal Drowning Rates per Activity: 2009-19 (10-year average) and 2018-19<br />
In 2018-19 fatal drowing rates (per 100,000 pop.) were lower than the 10-year average in all activities, with the exception of<br />
falls, which had a higher rate (2.15) when compared to the 10-year average (0.43).<br />
34%<br />
66%<br />
Fall<br />
66%<br />
Fall<br />
Scuba diving<br />
10-YEAR OVERVIEW | 2009-19 1-YEAR OVERVIEW | 2018-19<br />
3<br />
Attempting a Rescue<br />
Boating<br />
Diving / Jumping<br />
Fall<br />
Net / Shell Fishing<br />
Rock Fishing<br />
Scuba Diving<br />
Snorkeling<br />
Swimming / Wading<br />
Watercraft<br />
TOTAL FATAL DROWNINGS: 3<br />
FATAL DROWNINGS<br />
AVERAGE FATALITY<br />
1 2.15<br />
FATAL DROWNINGS BY LOCATION<br />
100%<br />
Marina<br />
PER 100,000 POPULATION<br />
SWIMMING / WADING<br />
SNORKELLING<br />
FALL<br />
2009-19<br />
0.00<br />
2018-19<br />
0.00<br />
ROCK FISHING<br />
2009-19<br />
0.00<br />
2018-19<br />
0.00<br />
AVERAGE FATAL DROWNINGS<br />
WEST COAST<br />
FATAL DROWNING SNAPSHOT<br />
Figure 62<br />
2009-19: West Coast <strong>Beach</strong> and <strong>Coastal</strong> Fatal<br />
Drownings<br />
In 2018-19, there were no fatal drownings. The 2009-19<br />
fatal drowning rate per 100,000 pop was 2.13.<br />
Fatal Drownings (n)<br />
3<br />
2<br />
1<br />
0<br />
2009-10<br />
Fatal Drownings<br />
Fatal Drowning Rate<br />
2010-11<br />
2011-12<br />
2012-13<br />
2013-14<br />
2014-15<br />
Year<br />
2015-16<br />
2016-17<br />
2017-18<br />
2018-19<br />
7.0<br />
6.0<br />
5.0<br />
4.0<br />
3.0<br />
2.0<br />
1.0<br />
0.0<br />
Fatal Drowning Rate<br />
(per 100,000 pop.)<br />
Figure 63<br />
2009-19: <strong>Beach</strong> and <strong>Coastal</strong> Fatal Drownings by<br />
Activity (n=7)<br />
Within the West Coast region, the majority of beach and<br />
coastal fatalities occurred due to snorkelling (n=3).<br />
Figure 64<br />
Comparison of <strong>Beach</strong> and <strong>Coastal</strong> Fatal Drowning Rates per Activity: 2009-19 (10-year average) and 2018-19<br />
In 2018-19, fatal drowning rates (per 100,000 pop.) were lower than the 10-year average in all activities.<br />
17%<br />
16%<br />
17%<br />
50%<br />
Fall<br />
50%<br />
Fall<br />
Net/Shell Fishing<br />
Attempting a Rescue<br />
Boating<br />
10-YEAR OVERVIEW | 2009-19 1-YEAR OVERVIEW | 2018-19<br />
7<br />
Attempting a Rescue<br />
Boating<br />
Diving / Jumping<br />
Fall<br />
Net / Shell Fishing<br />
Rock Fishing<br />
Scuba Diving<br />
Snorkeling<br />
Swimming / Wading<br />
Watercraft<br />
TOTAL FATAL DROWNINGS: 7<br />
FATAL DROWNINGS<br />
AVERAGE FATALITY<br />
0 0.00<br />
FATAL DROWNINGS BY LOCATION<br />
ZERO<br />
Fatal<br />
Drownings<br />
PER 100,000 POPULATION<br />
SWIMMING / WADING<br />
SNORKELLING<br />
FALL<br />
2009-19<br />
0.00<br />
2018-19<br />
0.00<br />
ROCK FISHING<br />
2009-19<br />
0.00<br />
2018-19<br />
0.00<br />
AVERAGE FATAL DROWNINGS<br />
1<br />
PER YEAR<br />
AVERAGE FATALITY<br />
2.13<br />
PER 100,000 POPULATION<br />
FATAL DROWNINGS BY ACTIVITY<br />
BOATING<br />
WATERCRAFT<br />
2009-19<br />
0.91<br />
2009-19<br />
0.31<br />
2009-19<br />
0.00<br />
2018-19<br />
0.00<br />
2018-19<br />
0.00<br />
2018-19<br />
0.00<br />
2009-19<br />
0.00<br />
NET / SHELL FISHING<br />
2009-19<br />
0.34<br />
ATTEMPTING A RESCUE<br />
2009-19<br />
0.30<br />
2018-19<br />
0.00<br />
2018-19<br />
0.00<br />
2018-19<br />
0.00<br />
86%<br />
MALE<br />
14%<br />
FEMALE<br />
ZERO<br />
Fatal<br />
Drownings<br />
60<br />
SURF LIFE SAVING NEW ZEALAND <strong>NATIONAL</strong> BEACH AND COASTAL SAFETY REPORT
CANTERBURY<br />
FATAL DROWNING SNAPSHOT<br />
Figure 65<br />
2009-19: Canterbury <strong>Beach</strong> and <strong>Coastal</strong> Fatal<br />
Drownings<br />
In 2018-19, there were no fatal drownings in Canterbury.<br />
The average 10-year fatal drowning rate per 100,000 pop.<br />
is 0.31<br />
Fatal Drownings (n)<br />
5<br />
4<br />
3<br />
2<br />
1<br />
0<br />
2009-10<br />
Fatal Drownings<br />
Fatal Drowning Rate<br />
2010-11<br />
Figure 66<br />
2009-19: <strong>Beach</strong> and <strong>Coastal</strong> Fatal Drownings by<br />
Activity (n=18)<br />
Within the Canterbury region, the majority of beach and<br />
coastal fatalities occurred due to falls (n=5), swimming/<br />
wading (n=3) and snorkelling (n=3).<br />
Fall<br />
Snorkelling<br />
Swimming/Wading<br />
Boating<br />
Rock Fishing<br />
Net/Shell Fishing<br />
Figure 67<br />
Comparison of <strong>Beach</strong> and <strong>Coastal</strong> Fatal Drowning Rates per Activity: 2009-19 (10-year average) and 2018-19<br />
In 2018-19, fatal drowning rates (per 100,000 pop.) were lower than the 10-year average in all activities.<br />
SWIMMING / WADING<br />
FALL<br />
2011-12<br />
BOATING<br />
2012-13<br />
WATERCRAFT<br />
2013-14<br />
2014-15<br />
Year<br />
2015-16<br />
2009-19<br />
0.05<br />
2009-19<br />
0.09<br />
2009-19<br />
0.03<br />
2009-19<br />
0.00<br />
2016-17<br />
2017-18<br />
2018-19<br />
2018-19<br />
0.00<br />
2018-19<br />
0.00<br />
2018-19<br />
0.00<br />
2018-19<br />
0.00<br />
0.8<br />
0.7<br />
0.6<br />
0.5<br />
0.4<br />
0.3<br />
0.2<br />
0.1<br />
0.0<br />
Fatal Drowning Rate<br />
(per 100,000 pop.)<br />
14%<br />
13%<br />
19%<br />
6%<br />
SNORKELLING<br />
ROCK FISHING<br />
31%<br />
Fall<br />
NET / SHELL FISHING<br />
ATTEMPTING A RESCUE<br />
29%<br />
2009-19<br />
0.05<br />
2009-19<br />
0.03<br />
2009-19<br />
0.02<br />
2009-19<br />
0.00<br />
31%<br />
2018-19<br />
0.00<br />
2018-19<br />
0.00<br />
2018-19<br />
0.00<br />
2018-19<br />
0.00<br />
10-YEAR OVERVIEW | 2009-19 1-YEAR OVERVIEW | 2018-19<br />
Attempting a Rescue<br />
Boating<br />
Diving / Jumping<br />
Fall<br />
AVERAGE FATAL DROWNINGS<br />
2<br />
PER YEAR<br />
KEY DEMOGRAPHIC<br />
45-64<br />
YEAR OLD MALES<br />
Net / Shell Fishing<br />
Rock Fishing<br />
Scuba Diving<br />
Snorkeling<br />
89%<br />
MALE<br />
11%<br />
FEMALE<br />
Swimming / Wading<br />
Watercraft<br />
TOTAL FATAL DROWNINGS: 18<br />
AVERAGE FATALITY<br />
0.31<br />
PER 100,000 POPULATION<br />
FALLS<br />
18<br />
FATAL DROWNINGS<br />
AVERAGE FATALITY<br />
0 0.00<br />
FATAL DROWNINGS BY LOCATION<br />
ZERO<br />
Fatal<br />
Drownings<br />
FATAL DROWNINGS BY ACTIVITY<br />
ZERO<br />
Fatal<br />
Drownings<br />
PER 100,000 POPULATION<br />
62<br />
SURF LIFE SAVING NEW ZEALAND <strong>NATIONAL</strong> BEACH AND COASTAL SAFETY REPORT
OTAGO<br />
FATAL DROWNING SNAPSHOT<br />
Figure 68<br />
2009-19: Otago <strong>Beach</strong> and <strong>Coastal</strong> Fatal Drownings<br />
In 2018-19, there were four fatal drownings in Otago, which<br />
is above the 10-year average of one. The 2018-19 fatal<br />
drowning rate per 100,000 pop. was 1.75, which is higher<br />
than the average 10-year rate (0.61).<br />
Fatal Drownings (n)<br />
5<br />
4<br />
3<br />
2<br />
1<br />
0<br />
2009-10<br />
Fatal Drownings<br />
Fatal Drowning Rate<br />
2010-11<br />
Figure 69<br />
2009-19: <strong>Beach</strong> and <strong>Coastal</strong> Fatal Drownings by<br />
Activity (n=13)<br />
Within the Otago region, the majority of beach and coastal<br />
fatalities occurred due to snorkelling (n=5) and falls (n=4).<br />
Snorkelling<br />
Fall<br />
Boating<br />
Watercraft<br />
Rock Fishing<br />
Figure 70<br />
Comparison of <strong>Beach</strong> and <strong>Coastal</strong> Fatal Drowning Rates per Activity: 2009-19 (10-year average) and 2018-19<br />
In 2018-19 fatal drowning rates (per 100,000 pop.) were lower than the 10-year average in most activities. Snorkelling<br />
related incidents were the exception.<br />
SWIMMING / WADING<br />
FALL<br />
2011-12<br />
BOATING<br />
2012-13<br />
WATERCRAFT<br />
2013-14<br />
2014-15<br />
Year<br />
2009-19<br />
0.00<br />
2009-19<br />
0.19<br />
2009-19<br />
0.10<br />
2015-16<br />
2009-19<br />
0.05<br />
2016-17<br />
2017-18<br />
2018-19<br />
2018-19<br />
0.00<br />
2018-19<br />
0.00<br />
2018-19<br />
0.00<br />
2018-19<br />
0.00<br />
2.5<br />
2.0<br />
1.5<br />
1.0<br />
0.5<br />
0.0<br />
Fatal Drowning Rate<br />
(per 100,000 pop.)<br />
15%<br />
8%<br />
8%<br />
38%<br />
Snorkelling<br />
31%<br />
SNORKELLING<br />
ROCK FISHING<br />
2009-19<br />
0.22<br />
2009-19<br />
0.05<br />
NET / SHELL FISHING<br />
2009-19<br />
0.00<br />
ATTEMPTING A RESCUE<br />
2009-19<br />
0.25<br />
38%<br />
2018-19<br />
1.75<br />
2018-19<br />
0.00<br />
2018-19<br />
0.00<br />
2018-19<br />
0.00<br />
10-YEAR OVERVIEW | 2009-19 1-YEAR OVERVIEW | 2018-19<br />
Attempting a Rescue<br />
Boating<br />
Diving / Jumping<br />
Fall<br />
AVERAGE FATAL DROWNINGS<br />
1<br />
PER YEAR<br />
KEY DEMOGRAPHIC<br />
15-54<br />
YEAR OLD MALES<br />
Net / Shell Fishing<br />
Rock Fishing<br />
Scuba Diving<br />
Snorkeling<br />
81%<br />
MALE<br />
19%<br />
FEMALE<br />
13<br />
Swimming / Wading<br />
Watercraft<br />
TOTAL FATAL DROWNINGS: 13<br />
AVERAGE FATALITY<br />
0.61<br />
PER 100,000 POPULATION<br />
SNORKELLERS<br />
FATAL DROWNINGS<br />
AVERAGE FATALITY<br />
4 1.75<br />
FATAL DROWNINGS BY LOCATION<br />
50%<br />
50%<br />
0-1Km<br />
from Shore<br />
0-1Km from Shore<br />
FATAL DROWNINGS BY ACTIVITY<br />
100%<br />
Snorkelling<br />
PER 100,000 POPULATION<br />
50%<br />
Rocky<br />
Foreshore<br />
Rocky Foreshore<br />
50%<br />
64<br />
SURF LIFE SAVING NEW ZEALAND <strong>NATIONAL</strong> BEACH AND COASTAL SAFETY REPORT
SOUTHLAND<br />
FATAL DROWNING SNAPSHOT<br />
Figure 71<br />
2009-19: Southland <strong>Beach</strong> and <strong>Coastal</strong> Fatal<br />
Drownings<br />
In 2018-19, there were two fatal drownings in Southland,<br />
just above the 10-year average of one. The 2018-19 fatal<br />
drowning rate per 100,000 pop. was 2.02, which is above<br />
the average 10-year rate (1.02).<br />
Fatal Drownings (n)<br />
4<br />
3<br />
2<br />
1<br />
0<br />
2009-10<br />
Fatal Drownings<br />
Fatal Drowning Rate<br />
2010-11<br />
Figure 72<br />
2009-19: <strong>Beach</strong> and <strong>Coastal</strong> Fatal Drownings by<br />
Activity (n=10)<br />
Within the Southland region, the majority of beach and<br />
coastal fatalities occurred when rock fishing (n=3).<br />
Figure 73<br />
Comparison of <strong>Beach</strong> and <strong>Coastal</strong> Fatal Drowning Rates per Activity: 2009-19 (10-year average) and 2018-19<br />
In 2018-19, fatal drowning rates (per 100,000 pop.) were lower than the 10-year average in most activities, rock fishing<br />
incidents were the exception.<br />
SWIMMING / WADING<br />
FALL<br />
2011-12<br />
BOATING<br />
2012-13<br />
WATERCRAFT<br />
2013-14<br />
2014-15<br />
Year<br />
2009-19<br />
0.10<br />
2009-19<br />
0.10<br />
2009-19<br />
0.00<br />
2009-19<br />
0.10<br />
2015-16<br />
2016-17<br />
2017-18<br />
2018-19<br />
2018-19<br />
0.00<br />
2018-19<br />
0.00<br />
2018-19<br />
0.00<br />
2018-19<br />
0.00<br />
3.5<br />
3.0<br />
2.5<br />
2.0<br />
1.5<br />
1.0<br />
0.5<br />
0.0<br />
Fatal Drowning Rate<br />
(per 100,000 pop.)<br />
12%<br />
12%<br />
12%<br />
13%<br />
SNORKELLING<br />
ROCK FISHING<br />
38%<br />
Rock<br />
Fishing<br />
13%<br />
2009-19<br />
0.10<br />
2009-19<br />
0.30<br />
NET / SHELL FISHING<br />
2009-19<br />
0.11<br />
ATTEMPTING A RESCUE<br />
2009-19<br />
0.25<br />
38%<br />
2018-19<br />
0.00<br />
2018-19<br />
2.20<br />
2018-19<br />
0.00<br />
2018-19<br />
0.00<br />
Rock Fishing<br />
Net/Shell Fishing<br />
Snorkelling<br />
Watercraft<br />
Fall<br />
Swimming/Wading<br />
10-YEAR OVERVIEW | 2009-19 1-YEAR OVERVIEW | 2018-19<br />
10<br />
Attempting a Rescue<br />
Boating<br />
Diving / Jumping<br />
Fall<br />
AVERAGE FATAL DROWNINGS<br />
1<br />
PER YEAR<br />
KEY DEMOGRAPHIC<br />
15-34<br />
YEAR OLD MALES<br />
Net / Shell Fishing<br />
Rock Fishing<br />
Scuba Diving<br />
Snorkeling<br />
100%<br />
MALE<br />
0%<br />
FEMALE<br />
Swimming / Wading<br />
Watercraft<br />
TOTAL FATAL DROWNINGS: 10<br />
AVERAGE FATALITY<br />
1.02<br />
PER 100,000 POPULATION<br />
ROCK FISHING<br />
FATAL DROWNINGS<br />
AVERAGE FATALITY<br />
2 2.02<br />
FATAL DROWNINGS BY LOCATION<br />
100%<br />
Rocky<br />
Foreshore<br />
FATAL DROWNINGS BY ACTIVITY<br />
100%<br />
Rock<br />
Fishing<br />
PER 100,000 POPULATION<br />
66<br />
SURF LIFE SAVING NEW ZEALAND <strong>NATIONAL</strong> BEACH AND COASTAL SAFETY REPORT
10 YEAR ACTIVITY<br />
OVERVIEW 2009-19<br />
SECTION SIX<br />
71<br />
65<br />
SWIMMING/<br />
WADING<br />
FALLS<br />
(TRIPS/SLIPS)<br />
47<br />
30<br />
27<br />
BOATING<br />
WATERCRAFT<br />
SNORKELLING
SNAPSHOT: SWIMMING/WADING<br />
10 YEAR OVERVIEW | 2009-19<br />
2009-2019<br />
SNAPSHOT: FALLS<br />
10 YEAR OVERVIEW | 2009-19<br />
2009-2019<br />
AVERAGE FATAL<br />
DROWNINGS PER YEAR<br />
FATAL DROWNINGS<br />
71<br />
AVERAGE FATALITY RATE<br />
PER 100,000 POPULATION<br />
14<br />
26<br />
8<br />
AVERAGE FATAL<br />
DROWNINGS PER YEAR<br />
FATAL DROWNINGS<br />
65<br />
AVERAGE FATALITY RATE<br />
PER 100,000 POPULATION<br />
5<br />
21<br />
5<br />
7<br />
0.16<br />
1<br />
3<br />
0<br />
7<br />
0.14<br />
3<br />
8<br />
0<br />
KEY DEMOGRAPHIC<br />
15-34<br />
YEAR OLD MALES (NZ EUROPEAN)<br />
0<br />
2<br />
0<br />
3<br />
7<br />
3<br />
KEY DEMOGRAPHIC<br />
55+<br />
YEAR OLD MALES (NZ EUROPEAN)<br />
3<br />
0<br />
2<br />
0 3<br />
5<br />
86%<br />
MALE<br />
14%<br />
FEMALE<br />
1<br />
0<br />
3<br />
78%<br />
MALE<br />
12%<br />
FEMALE<br />
1<br />
4<br />
5<br />
SWIMMING & WADING FATAL DROWNINGS 2009-19<br />
FALLS FATAL DROWNINGS 2009-19<br />
Fatal Drownings (n)<br />
12<br />
10<br />
8<br />
6<br />
4<br />
2<br />
Fatal Drownings<br />
Fatal Drowning Rate<br />
0.30<br />
0.25<br />
0.20<br />
0.15<br />
0.10<br />
0.05<br />
Fatal Drowning Rate<br />
(per 100,000 pop.)<br />
Fatal Drownings (n)<br />
12<br />
10<br />
8<br />
6<br />
4<br />
2<br />
Fatal Drownings<br />
Fatal Drowning Rate<br />
0.25<br />
0.20<br />
0.15<br />
0.10<br />
0.05<br />
Fatal Drowning Rate<br />
(per 100,000 pop.)<br />
0<br />
2009-10<br />
2010-11 2011-12 2012-13 2013-14 2014-15 2015-16 2016-17 2017-18 2018-19<br />
Year<br />
0.00<br />
0<br />
2009-10 2010-11 2011-12 2012-13 2013-14 2014-15 2015-16 2016-17 2017-18 2018-19<br />
Year<br />
0.00<br />
SURF LIFE SAVING NEW ZEALAND <strong>NATIONAL</strong> BEACH AND COASTAL SAFETY REPORT SECTION SIX 10 YEAR ACTIVITY OVERVIEW 2009-19<br />
70 71
SNAPSHOT: BOATING<br />
10 YEAR OVERVIEW | 2009-19<br />
2009-2019<br />
SNAPSHOT: WATERCRAFT<br />
10 YEAR OVERVIEW | 2009-19<br />
2009-2019<br />
AVERAGE FATAL<br />
DROWNINGS PER YEAR<br />
FATAL DROWNINGS<br />
47<br />
AVERAGE FATALITY RATE<br />
PER 100,000 POPULATION<br />
3<br />
24<br />
4<br />
AVERAGE FATAL<br />
DROWNINGS PER YEAR<br />
FATAL DROWNINGS<br />
30<br />
AVERAGE FATALITY RATE<br />
PER 100,000 POPULATION<br />
12<br />
7<br />
1<br />
5<br />
0.10<br />
1<br />
5<br />
0<br />
3<br />
0.07<br />
1<br />
2<br />
0<br />
KEY DEMOGRAPHIC<br />
55+<br />
YEAR OLD MALES (PACIFIC PEOPLES)<br />
1<br />
0<br />
0<br />
0<br />
3<br />
2<br />
KEY DEMOGRAPHIC<br />
45-54<br />
YEAR OLD MALES (NZ EUROPEAN)<br />
0<br />
0<br />
0<br />
0 0<br />
5<br />
97%<br />
MALE<br />
3%<br />
FEMALE<br />
0<br />
2<br />
2<br />
90%<br />
MALE<br />
10%<br />
FEMALE<br />
1<br />
1<br />
0<br />
BOATING FATAL DROWNINGS 2009-19<br />
WATERCRAFT FATAL DROWNINGS 2009-19<br />
14<br />
12<br />
Fatal Drownings<br />
Fatal Drowning Rate<br />
0.30<br />
0.25<br />
8<br />
7<br />
Fatal Drownings<br />
Fatal Drowning Rate<br />
0.20<br />
Fatal Drownings (n)<br />
10<br />
8<br />
6<br />
4<br />
0.20<br />
0.15<br />
0.10<br />
Fatal Drowning Rate<br />
(per 100,000 pop.)<br />
Fatal Drownings (n)<br />
6<br />
5<br />
4<br />
3<br />
2<br />
0.15<br />
0.10<br />
0.05<br />
Fatal Drowning Rate<br />
(per 100,000 pop.)<br />
2<br />
0.05<br />
1<br />
0<br />
2009-10 2010-11 2011-12 2012-13 2013-14 2014-15 2015-16 2016-17 2017-18 2018-19<br />
Year<br />
0.00<br />
0<br />
2009-10<br />
2010-11 2011-12 2012-13 2013-14 2014-15 2015-16 2016-17 2017-18 2018-19<br />
Year<br />
0.00<br />
SURF LIFE SAVING NEW ZEALAND <strong>NATIONAL</strong> BEACH AND COASTAL SAFETY REPORT SECTION SIX 10 YEAR ACTIVITY OVERVIEW 2009-19<br />
72 73
SNAPSHOT: SNORKELLING<br />
10 YEAR OVERVIEW | 2009-19<br />
2009-2019<br />
This report is our way of drawing a<br />
line in the sand. We, Surf Life Saving<br />
New Zealand, are saying “Enough is<br />
Enough”. No more unnecessary deaths<br />
from drowning on our beaches and<br />
along our coastline.<br />
FATAL DROWNINGS<br />
27<br />
4<br />
AVERAGE FATAL<br />
DROWNINGS PER YEAR<br />
AVERAGE FATALITY RATE<br />
PER 100,000 POPULATION<br />
3<br />
4<br />
3<br />
0.06<br />
0<br />
2<br />
1<br />
KEY DEMOGRAPHIC<br />
30-54<br />
YEAR OLD MALES (MAORI)<br />
0<br />
0<br />
0<br />
1<br />
3<br />
0<br />
96%<br />
MALE<br />
4%<br />
FEMALE<br />
1<br />
5<br />
3<br />
SNORKELLING FATAL DROWNINGS 2009-19<br />
Fatal Drownings (n)<br />
5<br />
4<br />
3<br />
2<br />
1<br />
Fatal Drownings<br />
Fatal Drowning Rate<br />
0.10<br />
0.08<br />
0.06<br />
0.04<br />
0.02<br />
Fatal Drowning Rate<br />
(per 100,000 pop.)<br />
0<br />
2009-10<br />
2010-11 2011-12 2012-13 2013-14 2014-15 2015-16 2016-17 2017-18 2018-19<br />
Year<br />
0.00<br />
SURF LIFE SAVING NEW ZEALAND <strong>NATIONAL</strong> BEACH AND COASTAL SAFETY REPORT SECTION SIX 10 YEAR ACTIVITY OVERVIEW 2009-19<br />
74 75
KEY TERMS<br />
Adult – For this report, adults refer to a person 15 years of<br />
age and over, which aligns with the Stats NZ Tatauranga<br />
Aotearoa classification.<br />
Assist – Where a person requires assistance to return to shore<br />
but would most likely be able to get themselves out of danger<br />
if unaided.<br />
Attempting a Rescue – Trying to retrieve a person in distress<br />
and deliver them to a place of safety.<br />
<strong>Beach</strong> – A wave-deposited accumulation of sediment – usually<br />
sand, but ranging in size up to boulders – deposited between<br />
the upper tidal limit and the offshore area where waves first<br />
start breaking.<br />
<strong>Beach</strong> Fatal Drowning – Where the location of the fatality<br />
occurs on a surf beach, calm water beach or rocky foreshore<br />
and the cause of death involves drowning or immersion.<br />
Boating – Using either a powered vessel or sailing boat for<br />
pleasure and/or fishing.<br />
Bystander – A person who is present at an incident but not<br />
part of it initially.<br />
Calm Water <strong>Beach</strong> – An area of estuarine coastline with sand,<br />
gravel or pebbles that contains a sheltered foreshore, with no<br />
surf zone – e.g. harbour beach.<br />
<strong>Coastal</strong> – Tidal waters (estuary, harbour, marina and river/<br />
harbour bar); ocean up to 1km offshore; or inland up to five<br />
times the width of the inlet/river.<br />
Category 1 Search and Rescue Operations – Search and<br />
Rescue coordinated at a local level by the New Zealand Police;<br />
including land operations, river, lake and inland waterway<br />
operations and close-to-shore marine operations.<br />
<strong>Coastal</strong> Fatal Drowning – Where the location of the fatality<br />
is in tidal waters (estuary, harbour, marina and river/harbour<br />
bar), in the ocean up to 1km offshore or inland up to five<br />
times the width of the inlet/river and the cause of death<br />
includes drowning or immersion.<br />
<strong>Coastal</strong> Risk Assessment - A report that recommends levels<br />
of service provision at a location.<br />
Contract Surf Lifeguard Service – Surf Lifeguard services<br />
that are funded by regional councils and local territorial<br />
authorities, and managed by Surf Life Saving New Zealand<br />
or Surf Life Saving Northern Region<br />
Drowning – The process of experiencing respiratory<br />
impairment from submersion/immersion in liquid; outcomes<br />
are classified as death, morbidity and no morbidity.<br />
DrownBase – Database run by Water <strong>Safety</strong> New Zealand that<br />
collates all of the deaths from drowning in New Zealand. The<br />
dataset also includes information on non-fatal drownings.<br />
Emergency Callout Squads (ECOS) – These are made up<br />
of several combined clubs and volunteer surf lifeguards<br />
attached to external local rescue/emergency services. Squad<br />
members are qualified and equipped to respond to any<br />
incident within the beach and coastal environment.<br />
Emergency Response – An action taken by an SLS entity<br />
in response to a call for assistance from an emergency<br />
management organisation.<br />
Estuary - A partially enclosed coastal body of water that is<br />
either permanently or periodically open to the sea<br />
Falls (trips/slips) – An event that results in a person tripping/<br />
slipping so they end up accidentally immersed in water.<br />
Fatal Drowning Rate – A comparative rate of drowning (as<br />
the cause of death) to the size of the population in a given<br />
area.<br />
First Aid – First aid is the first and immediate assistance given<br />
to any person suffering from either a minor or serious illness<br />
or injury, with care provided to preserve life, prevent the<br />
condition from worsening, or to promote recovery.<br />
Harbour – Large inner body of water surrounded on several<br />
sides by prominences of land<br />
Hazard – A source of potential harm.<br />
Incident – Any unplanned event requiring lifesaving services<br />
intervention.<br />
Intervention – An action performed by a Surf Lifeguard to<br />
prevent a situation from deteriorating, which includes injury<br />
or drowning. Interventions include preventative actions,<br />
assists, rescues, searches, major first aids and minor first<br />
aids.<br />
IRB – Inflatable rescue boat.<br />
Major First Aid – Any incident where a victim is administered<br />
some form of advanced medical treatment or requires<br />
hospitalization.<br />
Marina – A boat basin offering dockage and other service for<br />
small craft.<br />
Minor First Aid - Where a victim is administered some form of<br />
minor medical treatment – minor cut, bluebottle sting, sand<br />
in the eye, minor strain or sprains.<br />
Morbidity – Any physical or psychological state considered<br />
to be outside the realm of normal well-being. The term<br />
morbidity is often used to describe illness, impairment, or<br />
degradation of health.<br />
Net Fishing – Using a net to trawl the shallows of a beach/<br />
estuary for fish.<br />
Non-fatal Drowning – A subset of drowning, the process<br />
of experiencing respiratory impairment from submersion/<br />
immersion in liquid, where the outcome is classified as<br />
morbidity and no morbidity.<br />
Patrol – Surf Lifeguard service to monitor activities in/around<br />
an aquatic environment and respond accordingly through<br />
either preventative actions or rescue operations. A patrol<br />
will use the red and yellow patrol flags to assign a safer<br />
swimming area.<br />
Patrol Flags – Red/yellow horizontally divided flags which<br />
are set after performing a risk assessment to determine the<br />
most suitable area for swimming. The flags identify a zone<br />
for swimming and bodyboarding within a patrolled location.<br />
Patrolled Location – A location supervised by a Surf Lifeguard<br />
service.<br />
Preventative Action – Direct action taken to reduce or<br />
eliminate the probability of a specific rescue, first aid or other<br />
reportable incident from occuring.<br />
Rescue – Where a person requires immediate help to return to<br />
shore (or place of safety) and who without intervention would<br />
have suffered distress, injury or drowning.<br />
Risk-Adjusted Water Use Values – Dictates how many<br />
lifeguards are required at patrol location at any given time.<br />
Rock/Cliff – A rock platform that may or may not have a high<br />
steep face.<br />
Rock Fishing – Attempting to catch fish from a coastal rock<br />
platform or off a groyne.<br />
Rocky Foreshore - The area of coastline with shoreline rocks,<br />
including steep rocky cliffs that is exposed by low tides and<br />
submerged by high tides.<br />
RWC – Rescue water craft or JetSki.<br />
Scuba Diving – Swimming underwater with the aid of scuba<br />
equipment for recreational or commercial purposes.<br />
Searches - Any organised search for a missing person or group<br />
either at sea or on land. Searches include body recoveries.<br />
Search and Rescue – The search for and provision of aid to<br />
people who are in distress or imminent danger.<br />
Season – For the context of this report, the 2018/19 season is<br />
for the period of July 2018 to June 2019.<br />
Shell Fishing – Collecting shellfish while onshore or wading/<br />
swimming in water.<br />
Snorkelling – Swimming with a snorkel and face mask.<br />
Surf <strong>Beach</strong> – An area of land with sand, gravel or pebbles that<br />
contains a foreshore and surf zone. Surf beaches include low<br />
energy and exposed coasts.<br />
Surf Lifeguard – An individual who undertakes patrols at a<br />
beach. As a minimum requirement they are qualified in surf<br />
rescue and basic lifeguard support.<br />
Surf Lifeguard Service – A coordinated group that exists to<br />
provide aquatic safety services to the public. This includes<br />
Volunteer Surf Life Saving Clubs, Contract Surf Lifeguards,<br />
RWCs, IRB’s, ATV’s and 4WD units.<br />
Surf Life Saving Club – An affiliated not-for-profit organisation<br />
that has volunteer members who provide patrols and coastal<br />
safety services to the community.<br />
Surf Life Saving New Zealand – The leading beach and<br />
coastal safety, drowning prevention and rescue authority in<br />
New Zealand. The purpose of the organisation is to reduce<br />
injury and drowning on our beaches with a vision of zero<br />
preventable drownings.<br />
Surveillance Patrols – Surf Lifeguard services that monitor<br />
beach and water users without designating a red and yellow<br />
flagged area. This approach is effective for extending<br />
patrolling hours or season length, where resources are<br />
limited.<br />
Swimming – Moving through water by moving the body or<br />
parts of the body.<br />
Wading – Walking through water while partially immersed.<br />
Water <strong>Safety</strong> New Zealand – Water <strong>Safety</strong> New Zealand<br />
works with water safety sector organisations, individuals and<br />
the public to reduce the incidence of drowning and injury in<br />
New Zealand. The purpose is to lead a step change in New<br />
Zealand so people don’t drown with a vision that by 2025<br />
more people in New Zealand respect the water and have the<br />
skills, knowledge and awareness to enjoy it safely.<br />
Watercraft – A piece of non-powered recreational equipment<br />
used in water. Examples include surfboards, stand-up<br />
paddleboards, body boards, windsurfers or kayaks.<br />
SYMBOL KEY<br />
Male and<br />
Female<br />
Female<br />
and Male<br />
Lifeguards<br />
Fall<br />
Boating<br />
Surf <strong>Beach</strong><br />
Fatal<br />
Drownings<br />
Rescue<br />
Rock Fishing<br />
Snorkelling<br />
Calm Water<br />
<strong>Beach</strong><br />
Attempting<br />
a Rescue<br />
Rescue<br />
Tube<br />
Emergency<br />
Callout Squad<br />
Net/Shell<br />
Fishing<br />
Dive<br />
Preventative<br />
Action<br />
IRB<br />
Scuba Diving<br />
0-1Km<br />
Off Shore<br />
Assist<br />
Swimming /<br />
Wading<br />
Watercraft<br />
Rocky<br />
Foreshore<br />
Harbour Estuary Marina River/<br />
Harbour<br />
Bar<br />
SURF LIFE SAVING NEW ZEALAND<br />
<strong>NATIONAL</strong> BEACH & COASTAL SAFETY REPORT<br />
SURF LIFE SAVING NEW ZEALAND KEY TERMS<br />
76 77
REFERENCES<br />
METHODOLOGY<br />
The National <strong>Beach</strong> and <strong>Coastal</strong> <strong>Safety</strong> <strong>Report</strong> 2019<br />
contains information on SLS capability and membership<br />
capacity; rescues and emergency response; and fatal and<br />
non-fatal drownings for the period of 1 July 2009 to 30 June<br />
2019. This information is correct as of 2 September 2019.<br />
All care has been taken to ensure the statistical information<br />
included within this report is correct. However, pending the<br />
outcome of ongoing coronial investigations, this data may<br />
be amended. Data in figures may not always add up to<br />
100% due to rounding.<br />
The National <strong>Beach</strong> and <strong>Coastal</strong> <strong>Safety</strong> <strong>Report</strong> only<br />
documents incidents that have occurred within the<br />
coastal zone. The coastal zone is defined as “Tidal waters<br />
(estuary, harbour, marina and river/harbour bar); ocean<br />
up to 1km offshore; or inland up to five times the width<br />
of the inlet/river”.<br />
LIMITATIONS AND RECOMMENDATIONS FOR FUTURE<br />
RESEARCH<br />
The regional fatal drowning rates per 100,000 population<br />
use regional population estimates obtained from Stats NZ.<br />
However, these regional estimates do not include visitors<br />
from elsewhere in New Zealand or visitors from overseas.<br />
Further research is recommended to adjust these figures to<br />
account for the seasonal influx of vistors to each respective<br />
region.<br />
Regional fatal drowning data is currently unavailable<br />
for Nelson City Council. However, Nelson City Council’s<br />
respective fatal drowning data is included within the Tasman<br />
Region statistics.<br />
Further research is required to enable Surf Life Saving New<br />
Zealand and water safety stakeholders to gain a greater<br />
understanding of how and why people are recreating on our<br />
coastlines. Additional research is also required to understand<br />
how residents and international tourists use beach and<br />
coastal areas for recreation. Whilst applied psychological<br />
research is also recommended to assess public behaviour<br />
and perception of risk on our beaches. These findings will<br />
be used to inform community engagement and education<br />
strategies nationally.<br />
CAPABILITY ANALYSIS<br />
The Patrols and Memberships (PAM) database is a central<br />
repository for all Surf Life Saving clubs in New Zealand. It<br />
is used to log details of members (contact details, awards,<br />
memberships), patrols and incidents. PAM holds this<br />
information securely, and the data gives us an understanding<br />
of trends across the whole organisation. The database<br />
includes the Customer Relationship Management System<br />
(CRM) which includes operational data such as rescues, first<br />
aids, membership statistics and awards. Information was<br />
extracted from the CRM to identify how many interventions<br />
were performed by volunteers, lifeguards and lifesaving<br />
services during 2018-19; and how many active Surf<br />
Lifeguards and award holders there were during this period.<br />
FATAL DROWNING DATA ANALYSIS<br />
Fatal drownings statistics was recorded in DrownBase<br />
and shared for this report by Water <strong>Safety</strong> New Zealand<br />
(2019a). WSNZ gives no warranty as to the correctness of<br />
the information or the data provided as it is supplied to<br />
WSNZ by third parties, not under its control. While WSNZ<br />
is satisfied as to its accuracy for the purposes for which it<br />
is supplied to it, WSNZ shall not be liable for any loss or<br />
damage arising directly or indirectly from the use of any<br />
data supplied. All reported statistics are provisional.<br />
The non-fatal drowning data used in this report is based<br />
on hospital stays of at least 24 hours and has been provided<br />
by WSNZ’s as recorded in DrownBase. The data is sorted<br />
by the ICD-10-AM/ACHI/ACS international coding system.<br />
SUGGESTED CITATION: Surf Life Saving New Zealand.<br />
(2019). National <strong>Beach</strong> and <strong>Coastal</strong> <strong>Safety</strong> <strong>Report</strong> 2019.<br />
Wellington: Surf Life Saving New Zealand.<br />
ACKNOWLEDGEMENTS<br />
Surf Life Saving New Zealand would like to thank the<br />
following people and organisations for their assistance in<br />
the production of the inaugural National <strong>Beach</strong> & <strong>Coastal</strong><br />
<strong>Safety</strong> <strong>Report</strong>. Felicity Fozard, at Water <strong>Safety</strong> New Zealand;<br />
Shane Daw, Jaz Lawes and Nicole Cooney, at Surf Life<br />
Saving Australia; Statistics New Zealand; Naveen Kumar at<br />
the University of Canterbury; <strong>SLSNZ</strong> regions and Volunteer<br />
Surf Life Saving clubs; <strong>SLSNZ</strong> would also like to thank our<br />
sponsors for their continued support and regional councils<br />
and local territorial authorities for their funding towards the<br />
cost of providing the Contract Lifeguard Service.<br />
The report was compiled by Dan Lee (<strong>Coastal</strong> <strong>Safety</strong><br />
Officer), Mick Kearney (National Community Education<br />
Manager), Adam Wooler (Chief Operations Officer) and<br />
Rajal Middleton (Head of Commercial and Marketing).<br />
© 2019 SURF LIFE SAVING NEW ZEALAND<br />
This publication is copyright. Except as expressly provided<br />
in the Copyright Act 1968 and the Copyright Amendment Act<br />
2006, no part of this publication may be reproduced, stored in<br />
any retrieval systems or transmitted by any means (including<br />
electronic, mechanical, microcopying, photocopying,<br />
recording or otherwise) without prior permission from Surf<br />
Life Saving New Zealand. Every attempt has been made to<br />
trace and acknowledge copyright, but in some cases, this<br />
may not have been possible. Surf Life Saving New Zealand<br />
apologises for any accidental infringements and would<br />
welcome any information to redress the situation.<br />
REFERENCES<br />
Statistics New Zealand. (2018). Estimated Resident<br />
Population for Regional Council Areas, at 30 June (1996+)<br />
(Annual-Jun). Subnational population estimates tables.<br />
Retrieved 10th October 2019 from: http://archive.stats.<br />
govt.nz/browse_for_stats/population/estimates_and_<br />
projections/subnational-pop-estimates-tables.aspx<br />
Water <strong>Safety</strong> New Zealand. (2015). New Zealand Water<br />
<strong>Safety</strong> Sector Strategy 2020. https://cdnflightdec.userfirst.<br />
co.nz/uploads/sites/watersafety/files/PDFs/Official_<br />
Documents/Sector-Strategy-Published-Version-Aug-2015.<br />
pdf<br />
Water <strong>Safety</strong> New Zealand. (2019a). <strong>Coastal</strong> drowning<br />
deaths 2009-2018 [Figures / Table / Graph]. Retrieved from<br />
DrownBase database.<br />
Water <strong>Safety</strong> New Zealand. (2019b). The drowning report<br />
2018. https://drowningreport.watersafety.org.nz/<br />
PHOTOGRAPHIC MATERIAL<br />
Cover, pages 8-9, and 75, by Cody Keepa - Keepa Digital.<br />
Pages 20-21, 28-29, 36-37, by Tim Marshal on Unsplash.<br />
Pages 32-33, by Douglas Bagg on Unsplash.<br />
Pages 68-69, by Grace Caadiang on Unslpash.<br />
SURF LIFE SAVING NEW ZEALAND<br />
78<br />
<strong>NATIONAL</strong> BEACH AND COASTAL SAFETY REPORT<br />
SURF LIFE SAVING NEW ZEALAND<br />
79<br />
REFERENCES
CONTACT INFORMATION<br />
Surf Life Saving New Zealand<br />
Phone: +64 4 560 0383<br />
E-Mail: communications@surflifesaving.org.nz