

directors - Colombo Stock Exchange
directors - Colombo Stock Exchange
directors - Colombo Stock Exchange

Create successful ePaper yourself
Turn your PDF publications into a flip-book with our unique Google optimized e-Paper software.
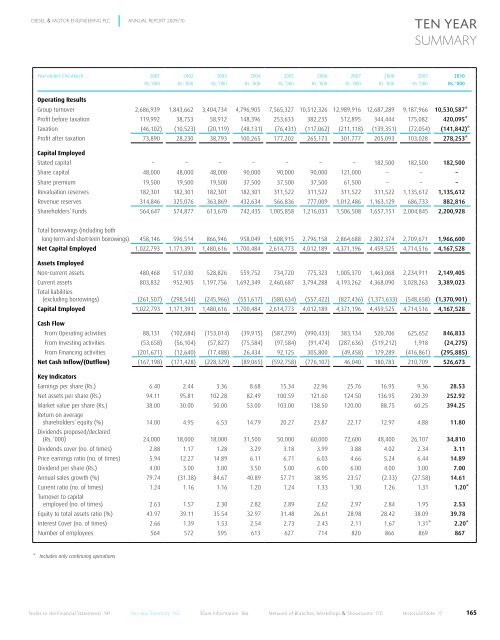
DIESEL & MOTOR ENGINEERING PLC ANNUAL REPORT 2009/10<br />
Year ended 31st March 2001 2002 2003 2004 2005 2006 2007 2008 2009 2010<br />
Rs. ’000 Rs. ’000 Rs. ’000 Rs. ’000 Rs. ’000 Rs. ’000 Rs. ’000 Rs. ’000 Rs. ’000 Rs. ’000<br />
Operating Results<br />
Group turnover 2,686,939 1,843,662 3,404,734 4,796,905 7,565,327 10,512,326 12,989,916 12,687,289 9,187,966 10,530,587*<br />
Profit before taxation 119,992 38,753 58,912 148,396 253,633 382,235 512,895 344,444 175,082 420,095*<br />
Taxation (46,102) (10,523) (20,119) (48,131) (76,431) (117,062) (211,118) (139,351) (72,054) (141,842)*<br />
Profit after taxation 73,890 28,230 38,793 100,265 177,202 265,173 301,777 205,093 103,028 278,253*<br />
Capital Employed<br />
Stated capital – – – – – – – 182,500 182,500 182,500<br />
Share capital 48,000 48,000 48,000 90,000 90,000 90,000 121,000 – – –<br />
Share premium 19,500 19,500 19,500 37,500 37,500 37,500 61,500 – – –<br />
Revaluation reserves 182,301 182,301 182,301 182,301 311,522 311,522 311,522 311,522 1,135,612 1,135,612<br />
Revenue reserves 314,846 325,076 363,869 432,634 566,836 777,009 1,012,486 1,163,129 686,733 882,816<br />
Shareholders’ Funds 564,647 574,877 613,670 742,435 1,005,858 1,216,031 1,506,508 1,657,151 2,004,845 2,200,928<br />
Total borrowings (including both<br />
long-term and short-term borrowings) 458,146 596,514 866,946 958,049 1,608,915 2,796,158 2,864,688 2,802,374 2,709,671 1,966,600<br />
Net Capital Employed 1,022,793 1,171,391 1,480,616 1,700,484 2,614,773 4,012,189 4,371,196 4,459,525 4,714,516 4,167,528<br />
Assets Employed<br />
Non-current assets 480,468 517,030 528,826 559,752 734,720 775,323 1,005,370 1,463,068 2,234,911 2,149,405<br />
Current assets<br />
Total liabilities<br />
803,832 952,905 1,197,756 1,692,349 2,460,687 3,794,288 4,193,262 4,368,090 3,028,263 3,389,023<br />
(excluding borrowings) (261,507) (298,544) (245,966) (551,617) (580,634) (557,422) (827,436) (1,371,633) (548,658) (1,370,901)<br />
Capital Employed 1,022,793 1,171,391 1,480,616 1,700,484 2,614,773 4,012,189 4,371,196 4,459,525 4,714,516 4,167,528<br />
Cash Flow<br />
From Operating activities 88,131 (102,684) (153,014) (39,915) (587,299) (990,433) 383,134 520,706 625,652 846,833<br />
From Investing activities (53,658) (56,104) (57,827) (75,584) (97,584) (91,474) (287,636) (519,212) 1,918 (24,275)<br />
From Financing activities (201,671) (12,640) (17,488) 26,434 92,125 305,800 (49,458) 179,289 (416,861) (295,885)<br />
Net Cash Inflow/(Outflow) (167,198) (171,428) (228,329) (89,065) (592,758) (776,107) 46,040 180,783 210,709 526,673<br />
Key Indicators<br />
Earnings per share (Rs.) 6.40 2.44 3.36 8.68 15.34 22.96 25.76 16.95 9.36 28.53<br />
Net assets per share (Rs.) 94.11 95.81 102.28 82.49 100.59 121.60 124.50 136.95 230.39 252.92<br />
Market value per share (Rs.)<br />
Return on average<br />
38.00 30.00 50.00 53.00 103.00 138.50 120.00 88.75 60.25 394.25<br />
shareholders’ equity (%)<br />
Dividends proposed/declared<br />
14.00 4.95 6.53 14.79 20.27 23.87 22.17 12.97 4.88 11.80<br />
(Rs. ’000) 24,000 18,000 18,000 31,500 50,000 60,000 72,600 48,400 26,107 34,810<br />
Dividends cover (no. of times) 2.88 1.17 1.28 3.29 3.18 3.99 3.88 4.02 2.34 3.11<br />
Price earnings ratio (no. of times) 5.94 12.27 14.89 6.11 6.71 6.03 4.66 5.24 6.44 14.89<br />
Dividend per share (Rs.) 4.00 3.00 3.00 3.50 5.00 6.00 6.00 4.00 3.00 7.00<br />
Annual sales growth (%) 79.74 (31.38) 84.67 40.89 57.71 38.95 23.57 (2.33) (27.58) 14.61<br />
Current ratio (no. of times)<br />
Turnover to capital<br />
1.24 1.16 1.16 1.20 1.24 1.33 1.30 1.26 1.31 1.20*<br />
employed (no. of times) 2.63 1.57 2.30 2.82 2.89 2.62 2.97 2.84 1.95 2.53<br />
Equity to total assets ratio (%) 43.97 39.11 35.54 32.97 31.48 26.61 28.98 28.42 38.09 39.78<br />
Interest Cover (no. of times) 2.66 1.39 1.53 2.54 2.73 2.43 2.11 1.67 1.31* 2.20*<br />
Number of employees 564 572 595 613 627 714 820 866 869 867<br />
* Includes only continuing operations<br />
Notes to the Financial Statements 141 Ten year Summary 165 Share Information 166 Network of Branches, Workshops & Showrooms 170 Historical Note 17<br />
Ten Year<br />
SUMMARy<br />
165


