

directors - Colombo Stock Exchange
directors - Colombo Stock Exchange
directors - Colombo Stock Exchange

Create successful ePaper yourself
Turn your PDF publications into a flip-book with our unique Google optimized e-Paper software.
notes to the Financial statements<br />
148<br />
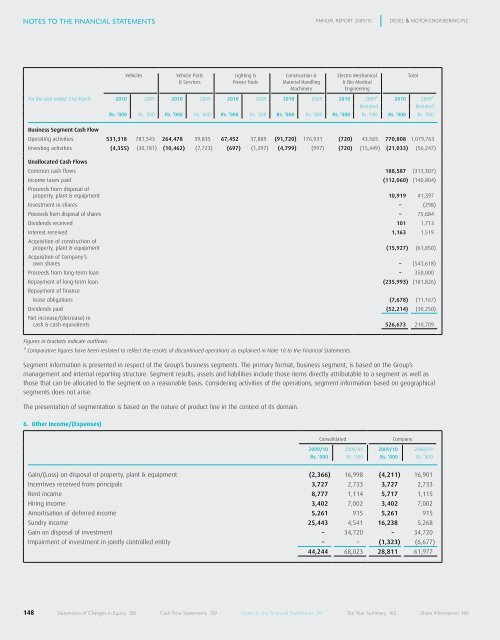
Vehicles<br />
Vehicle Parts<br />
& Services<br />
Lighting &<br />
Power Tools<br />
Construction &<br />
Material Handling<br />
Machinery<br />
ANNUAL RepoRt 2009/10 DIeseL & MotoR eNGINeeRING pLC<br />
Electro Mechanical<br />
& Bio Medical<br />
Engineering<br />
For the year ended 31st March 2010 2009 2010 2009 2010 2009 2010 2009 2010 2009* 2010 2009*<br />
Total<br />
Restated Restated<br />
Rs. ’000 Rs. ’000 Rs. ’000 Rs. ’000 Rs. ’000 Rs. ’000 Rs. ’000 Rs. ’000 Rs. ’000 Rs. ’000 Rs. ’000 Rs. ’000<br />
Business Segment Cash Flow<br />
Operating activities 531,318 781,543 264,478 39,835 67,452 37,889 (91,720) 176,931 (720) 43,565 770,808 1,079,763<br />
Investing activities (4,355) (30,781) (10,462) (7,723) (697) (1,297) (4,799) (997) (720) (15,449) (21,033) (56,247)<br />
Unallocated Cash Flows<br />
Common cash flows 188,587 (313,307)<br />
Income taxes paid<br />
Proceeds from disposal of<br />
(112,060) (140,804)<br />
property, plant & equipment 10,919 41,397<br />
Investment in shares – (298)<br />
Proceeds from disposal of shares – 75,684<br />
Dividends received 101 1,713<br />
Interest received<br />
Acquisition of construction of<br />
1,163 1,519<br />
property, plant & equipment<br />
Acquisition of Company’s<br />
(15,927) (61,850)<br />
own shares – (543,618)<br />
Proceeds from long-term loan – 350,000<br />
Repayment of long-term loan<br />
Repayment of finance<br />
(235,993) (181,826)<br />
lease obligations (7,678) (11,167)<br />
Dividends paid<br />
Net increase/(decrease) in<br />
(52,214) (30,250)<br />
cash & cash equivalents 526,673 210,709<br />
Figures in brackets indicate outflows.<br />
* Comparative figures have been restated to reflect the results of discontinued operations as explained in Note 10 to the Financial Statements.<br />
Segment information is presented in respect of the Group’s business segments. The primary format, business segment, is based on the Group’s<br />
management and internal reporting structure. Segment results, assets and liabilities include those items directly attributable to a segment as well as<br />
those that can be allocated to the segment on a reasonable basis. Considering activities of the operations, segment information based on geographical<br />
segments does not arise.<br />
The presentation of segmentation is based on the nature of product line in the context of its domain.<br />
6. Other Income/(Expenses)<br />
Consolidated Company<br />
2009/10 2008/09 2009/10 2008/09<br />
Rs. ’000 Rs. ’000 Rs. ’000 Rs. ’000<br />
Gain/(Loss) on disposal of property, plant & equipment (2,366) 16,998 (4,211) 16,901<br />
Incentives received from principals 3,727 2,733 3,727 2,733<br />
Rent income 8,777 1,114 5,717 1,115<br />
Hiring income 3,402 7,002 3,402 7,002<br />
Amortisation of deferred income 5,261 915 5,261 915<br />
Sundry income 25,443 4,541 16,238 5,268<br />
Gain on disposal of investment – 34,720 – 34,720<br />
Impairment of investment in jointly controlled entity – – (1,323) (6,677)<br />
44,244 68,023 28,811 61,977<br />
statements of Changes in equity 138 Cash flow statements 139 Notes to the financial statements 141 ten year summary 165 share Information 166


