

directors - Colombo Stock Exchange
directors - Colombo Stock Exchange
directors - Colombo Stock Exchange

You also want an ePaper? Increase the reach of your titles
YUMPU automatically turns print PDFs into web optimized ePapers that Google loves.
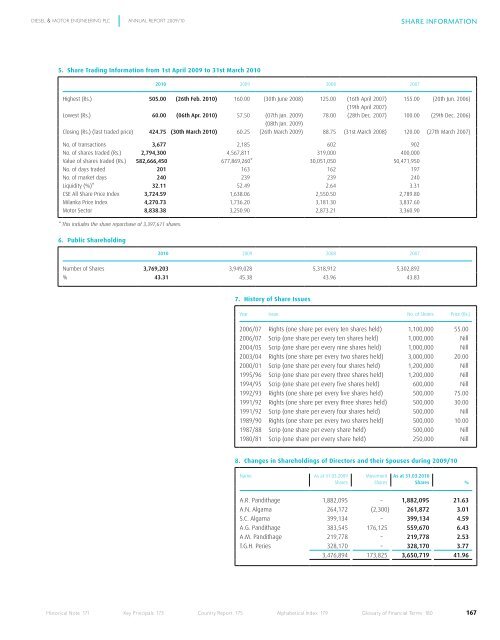
DIESEL & MOTOR ENGINEERING PLC ANNUAL REPORT 2009/10<br />
5. Share Trading Information from 1st April 2009 to 31st March 2010<br />
2010 2009 2008 2007<br />
Highest (Rs.) 505.00 (26th Feb. 2010) 160.00 (30th June 2008) 125.00 (16th April 2007) 155.00 (20th Jun. 2006)<br />
(19th April 2007)<br />
Lowest (Rs.) 60.00 (06th Apr. 2010) 57.50 (07th Jan. 2009) 78.00 (28th Dec. 2007) 100.00 (29th Dec. 2006)<br />
(08th Jan. 2009)<br />
Closing (Rs.) (last traded price) 424.75 (30th March 2010) 60.25 (26th March 2009) 88.75 (31st March 2008) 120.00 (27th March 2007)<br />
No. of transactions 3,677 2,185 602 902<br />
No. of shares traded (Rs.) 2,794,300 4,567,811 319,000 400,000<br />
Value of shares traded (Rs.) 582,666,450 677,869,260* 30,051,050 50,471,950<br />
No. of days traded 201 163 162 197<br />
No. of market days 240 239 239 240<br />
Liquidity (%)* 32.11 52.49 2.64 3.31<br />
CSE All Share Price Index 3,724.59 1,638.06 2,550.50 2,789.80<br />
Milanka Price Index 4,270.73 1,736.20 3,181.30 3,837.60<br />
Motor Sector 8,838.38 3,250.90 2,873.21 3,360.90<br />
* This includes the share repurchase of 3,397,611 shares.<br />
6. Public Shareholding<br />
2010 2009 2008 2007<br />
Number of Shares 3,769,203 3,949,028 5,318,912 5,302,892<br />
% 43.31 45.38 43.96 43.83<br />
7. History of Share Issues<br />
Historical Note 171 Key Principals 173 Country Report 175 Alphabetical Index 179 Glossary of Financial Terms 180<br />
S h a r e I n f o r m aT I o n<br />
Year Issue No. of Shares Price (Rs.)<br />
2006/07 Rights (one share per every ten shares held) 1,100,000 55.00<br />
2006/07 Scrip (one share per every ten shares held) 1,000,000 Nill<br />
2004/05 Scrip (one share per every nine shares held) 1,000,000 Nill<br />
2003/04 Rights (one share per every two shares held) 3,000,000 20.00<br />
2000/01 Scrip (one share per every four shares held) 1,200,000 Nill<br />
1995/96 Scrip (one share per every three shares held) 1,200,000 Nill<br />
1994/95 Scrip (one share per every five shares held) 600,000 Nill<br />
1992/93 Rights (one share per every five shares held) 500,000 75.00<br />
1991/92 Rights (one share per every three shares held) 500,000 30.00<br />
1991/92 Scrip (one share per every four shares held) 500,000 Nill<br />
1989/90 Rights (one share per every two shares held) 500,000 10.00<br />
1987/88 Scrip (one share per every share held) 500,000 Nill<br />
1980/81 Scrip (one share per every share held) 250,000 Nill<br />
8. Changes in Shareholdings of Directors and their Spouses during 2009/10<br />
Name As at 31.03.2009<br />
Shares<br />
Movement<br />
Shares<br />
As at 31.03.2010<br />
Shares %<br />
A.R. Pandithage 1,882,095 – 1,882,095 21.63<br />
A.N. Algama 264,172 (2,300) 261,872 3.01<br />
S.C. Algama 399,134 – 399,134 4.59<br />
A.G. Pandithage 383,545 176,125 559,670 6.43<br />
A.M. Pandithage 219,778 – 219,778 2.53<br />
T.G.H. Peries 328,170 – 328,170 3.77<br />
3,476,894 173,825 3,650,719 41.96<br />
167


