atw - International Journal for Nuclear Power | 05.2021
Description Ever since its first issue in 1956, the atw – International Journal for Nuclear Power has been a publisher of specialist articles, background reports, interviews and news about developments and trends from all important sectors of nuclear energy, nuclear technology and the energy industry. Internationally current and competent, the professional journal atw is a valuable source of information. www.nucmag.com
Description
Ever since its first issue in 1956, the atw – International Journal for Nuclear Power has been a publisher of specialist articles, background reports, interviews and news about developments and trends from all important sectors of nuclear energy, nuclear technology and the energy industry. Internationally current and competent, the professional journal atw is a valuable source of information.
www.nucmag.com

Create successful ePaper yourself
Turn your PDF publications into a flip-book with our unique Google optimized e-Paper software.
<strong>atw</strong> Vol. 66 (2021) | Issue 5 ı September<br />
scenario and is varied between 4 and 8 €/GJ (natural<br />
gas transmission costs are added separately).<br />
In addition, a Mix case is added where a balanced mix of<br />
renewables, nuclear, and natural gas with CCS is deployed.<br />
This case shows the potential of deploying renewables and<br />
nuclear up to the point where public resistance and<br />
complexity become limiting, and deploying a limited<br />
amount of natural gas where it adds the most value, i.e.,<br />
hydrogen production and system balancing.<br />
In each scenario, the model optimizes investment<br />
and hourly dispatch of all the technologies listed in the<br />
Appendix to minimize total system costs. The default<br />
settings of the three critical variables in the scenarios are<br />
1) no increase in grid costs, 2) 6000 €/kW nuclear capital<br />
cost, and 3) 6 €/GJ natural gas export price. A high<br />
CO 2 price of 200 €/ton is assumed in all cases.<br />
The Electricity Mix<br />
Electricity production and consumption from the optimal<br />
technology mixes <strong>for</strong> different cases are shown in Figure 2.<br />
Starting from the No CCS or <strong>Nuclear</strong> scenario on the<br />
left, we see that higher transmission costs reduce the<br />
deployment of renewables and increases CO 2 emissions<br />
from unabated natural gas-fired power production. With<br />
the base grid costs (1x) derived from a Berkeley Lab<br />
study 15 , all required hydrogen is made locally using<br />
electrolysis. However, this scenario requires 267 GW of<br />
installed wind capacity (two-thirds onshore) – quadruple<br />
the current installed base in Germany, where public<br />
resistance already has a large negative impact on wind<br />
expansion plans. In addition, 378 GW of solar power is<br />
needed (7x the current level).<br />
When transmission costs are tripled – a likely scenario<br />
given the public resistance and complexity anticipated<br />
from such vast wind and solar deployment – a considerable<br />
amount of unabated natural gas-fired power production<br />
is deployed. Even with a CO 2 price of 200 €/ton, higher<br />
renewable energy integration costs preserve a central role<br />
<strong>for</strong> unabated natural gas in the power system. In addition,<br />
this case relies on expensive hydrogen imports via green<br />
ammonia <strong>for</strong> 28 % of the hydrogen demand.<br />
The inclusion of nuclear in the No CCS scenario creates<br />
a near 100 % nuclear system when projects are well<br />
executed to build plants <strong>for</strong> 4000 €/kW. According to the<br />
latest power plant cost database from the IEA and NEA 16 ,<br />
nuclear plants have investment costs ranging from<br />
2300 €/kW in Korea to 4500 €/kW in the United States, so<br />
such costs are feasible. Even at the baseline cost of<br />
6000 €/kW, nuclear maintains a central role in the power<br />
system. However, at 8000 €/kW (e.g., the Hinkley Point C 17<br />
project), costs become excessive, and the optimal solution<br />
is the same as the base case (1x) in the No CCS or <strong>Nuclear</strong><br />
scenario.<br />
When CCS is allowed in the All Technologies scenario,<br />
natural gas-fired power plants with CCS become the<br />
favored technologies at natural gas export prices of 6 €/GJ<br />
and lower. Renewable energy deployment is low because<br />
CCS (and nuclear) plants are best operated as baseload<br />
generators and natural gas is used <strong>for</strong> all hydrogen<br />
production, removing the possibility of electrolysis to<br />
balance fluctuating wind and solar output. The natural gas<br />
price of the base case (6 €/GJ + transmission) is a little<br />
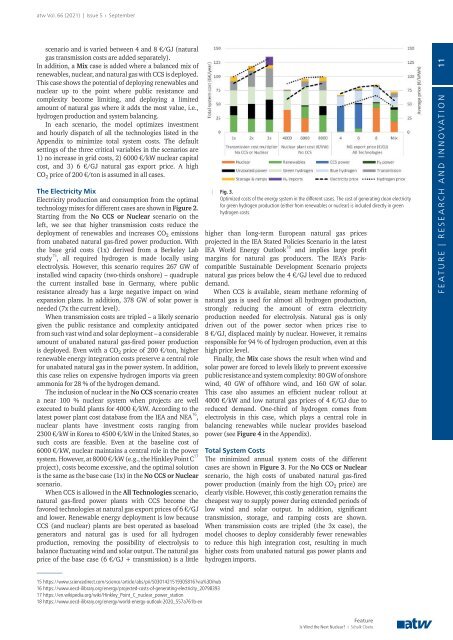
| Fig. 3.<br />
Optimized costs of the energy system in the different cases. The cost of generating clean electricity<br />
<strong>for</strong> green hydrogen production (either from renewables or nuclear) is included directly in green<br />
hydrogen costs.<br />
higher than long-term European natural gas prices<br />
projected in the IEA Stated Policies Scenario in the latest<br />
IEA World Energy Outlook 18<br />
and implies large profit<br />
margins <strong>for</strong> natural gas producers. The IEA’s Pariscompatible<br />
Sustainable Development Scenario projects<br />
natural gas prices below the 4 €/GJ level due to reduced<br />
demand.<br />
When CCS is available, steam methane re<strong>for</strong>ming of<br />
natural gas is used <strong>for</strong> almost all hydrogen production,<br />
strongly reducing the amount of extra electricity<br />
pro duction needed <strong>for</strong> electrolysis. Natural gas is only<br />
driven out of the power sector when prices rise to<br />
8 €/GJ, displaced mainly by nuclear. However, it remains<br />
responsible <strong>for</strong> 94 % of hydrogen production, even at this<br />
high price level.<br />
Finally, the Mix case shows the result when wind and<br />
solar power are <strong>for</strong>ced to levels likely to prevent excessive<br />
public resistance and system complexity: 80 GW of onshore<br />
wind, 40 GW of offshore wind, and 160 GW of solar.<br />
This case also assumes an efficient nuclear rollout at<br />
4000 €/kW and low natural gas prices of 4 €/GJ due to<br />
reduced demand. One-third of hydrogen comes from<br />
electrolysis in this case, which plays a central role in<br />
balancing renewables while nuclear provides baseload<br />
power (see Figure 4 in the Appendix).<br />
Total System Costs<br />
The minimized annual system costs of the different<br />
cases are shown in Figure 3. For the No CCS or <strong>Nuclear</strong><br />
scenario, the high costs of unabated natural gas-fired<br />
power production (mainly from the high CO 2 price) are<br />
clearly visible. However, this costly generation remains the<br />
cheapest way to supply power during extended periods of<br />
low wind and solar output. In addition, significant<br />
transmission, storage, and ramping costs are shown.<br />
When transmission costs are tripled (the 3x case), the<br />
model chooses to deploy considerably fewer renewables<br />
to reduce this high integration cost, resulting in much<br />
higher costs from unabated natural gas power plants and<br />
hydrogen imports.<br />
FEATURE | RESEARCH AND INNOVATION 11<br />
15 https://www.sciencedirect.com/science/article/abs/pii/S0301421519305816?via%3Dihub<br />
16 https://www.oecd-ilibrary.org/energy/projected-costs-of-generating-electricity_20798393<br />
17 https://en.wikipedia.org/wiki/Hinkley_Point_C_nuclear_power_station<br />
18 https://www.oecd-ilibrary.org/energy/world-energy-outlook-2020_557a761b-en<br />
Feature<br />
Is Wind the Next <strong>Nuclear</strong>? ı Schalk Cloete