annual report 2009 - bei der Hamborner REIT AG
annual report 2009 - bei der Hamborner REIT AG
annual report 2009 - bei der Hamborner REIT AG

Create successful ePaper yourself
Turn your PDF publications into a flip-book with our unique Google optimized e-Paper software.
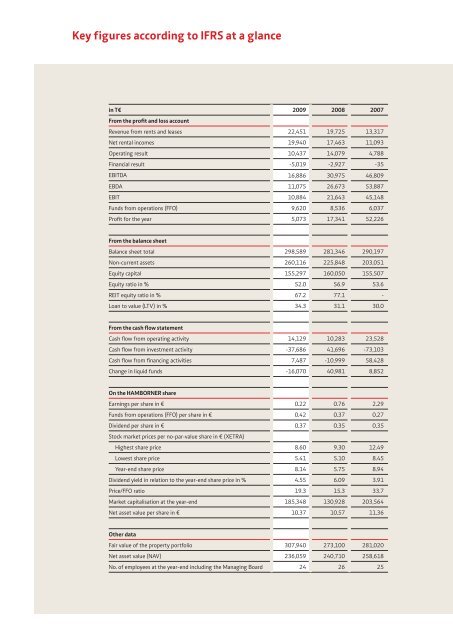
Key figures according to IFRS at a glance<br />
in T€ <strong>2009</strong> 2008 2007<br />
From the profit and loss account<br />
Revenue from rents and leases 22,451 19,725 13,317<br />
Net rental incomes 19,940 17,463 11,093<br />
Operating result 10,437 14,079 4,788<br />
Financial result -5,019 -2,927 -35<br />
EBITDA 16,886 30,975 46,809<br />
EBDA 11,075 26,673 53,887<br />
EBIT 10,884 21,643 45,148<br />
Funds from operations (FFO) 9,620 8,536 6,037<br />
Profit for the year 5,073 17,341 52,226<br />
From the balance sheet<br />
Balance sheet total 298,589 281,346 290,197<br />
Non-current assets 260,116 225,848 203,051<br />
Equity capital 155,297 160,050 155,507<br />
Equity ratio in % 52.0 56.9 53.6<br />
<strong>REIT</strong> equity ratio in % 67.2 77.1 -<br />
Loan to value (LTV) in % 34.3 31.1 30.0<br />
From the cash flow statement<br />
Cash flow from operating activity 14,129 10,283 23,528<br />
Cash flow from investment activity -37,686 41,696 -73,103<br />
Cash flow from financing activities 7,487 -10,999 58,428<br />
Change in liquid funds -16,070 40,981 8,852<br />
On the HAMBORNER share<br />
Earnings per share in € 0.22 0.76 2.29<br />
Funds from operations (FFO) per share in € 0.42 0.37 0.27<br />
Dividend per share in €<br />
Stock market prices per no-par-value share in € (XETRA)<br />
0.37 0.35 0.35<br />
Highest share price 8.60 9.30 12.49<br />
Lowest share price 5.41 5.10 8.45<br />
Year-end share price 8.14 5.75 8.94<br />
Dividend yield in relation to the year-end share price in % 4.55 6.09 3.91<br />
Price/FFO ratio 19.3 15.3 33.7<br />
Market capitalisation at the year-end 185,348 130,928 203,564<br />
Net asset value per share in € 10.37 10.57 11.36<br />
Other data<br />
Fair value of the property portfolio 307,940 273,100 281,020<br />
Net asset value (NAV) 236,059 240,710 258,618<br />
No. of employees at the year-end including the Managing Board 24 26 25