annual report 2009 - bei der Hamborner REIT AG
annual report 2009 - bei der Hamborner REIT AG
annual report 2009 - bei der Hamborner REIT AG

You also want an ePaper? Increase the reach of your titles
YUMPU automatically turns print PDFs into web optimized ePapers that Google loves.
to our sHareHol<strong>der</strong>s management <strong>report</strong> Financial statements supplementary inFormation<br />
44<br />
<strong>Hamborner</strong> reit ag | <strong>annual</strong> <strong>report</strong> <strong>2009</strong><br />
Development of rental and leasing income<br />
The rental and leasing income amounted to approximately €22.5 million in the <strong>report</strong>ing<br />
year and has thus increased consi<strong>der</strong>ably by approximately €2.7 million compared with the<br />
year 2008 due to the new investments. However, on a comparative basis – i.e. in the case<br />
of properties that were in the portfolio throughout the years 2008 and <strong>2009</strong> – net rents<br />
at €18.2 million overall were slightly below the previous year's level (€18.6 million).<br />
Uncollectable receivables in the <strong>report</strong>ing year <strong>2009</strong> were again at a low level at approximately<br />
€36,000.<br />
The overall vacancy rate in the financial year <strong>2009</strong> has increased slightly compared with the<br />
previous year (2.1%) to 3.5%. The vacancies predominantly relate to spaces in recently purchased<br />
properties, for which there are rent guarantees. The revised economic vacancy rate<br />
(including income from rent guarantees) is just 1.1%.<br />
The following table gives an overview regarding the company's ten biggest tenants:<br />
Company Rent income in % *<br />
1. Kaufland Group 22.6<br />
2. EDEKA 6.4<br />
3. Telefónica O2 3.6<br />
4. Douglas 3.0<br />
5. German Fe<strong>der</strong>al Employment Agency 3.0<br />
6. REWE 2.9<br />
7. Nordsee 2.6<br />
8. FLYLINE 2.4<br />
9. OAS 2.1<br />
10. ORSAY 1.9<br />
Total 50.5<br />
* according to share in the rental income<br />
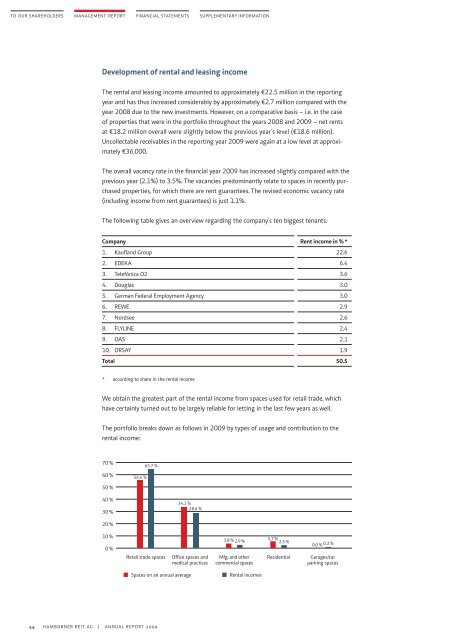
We obtain the greatest part of the rental income from spaces used for retail trade, which<br />
have certainly turned out to be largely reliable for letting in the last few years as well.<br />
The portfolio breaks down as follows in <strong>2009</strong> by types of usage and contribution to the<br />
rental income:<br />
70 %<br />
60 %<br />
50 %<br />
40 %<br />
30 %<br />
20 %<br />
10 %<br />
0 %<br />
56.4 %<br />
65.7 %<br />
34.1 %<br />
28.6 %<br />
Retail trade spaces Office spaces and<br />
medical practices<br />
3.8 % 2.9 %<br />
Mfg. and other<br />
commercial spaces<br />
Spaces on an <strong>annual</strong> average Rental incomes<br />
5.7 % 2.5 %<br />
0.0 % 0.3 %<br />
Residential Garages/car<br />
parking spaces