drinkworld Technology + Marketing 1/2023
drinkworld Technology + Marketing is the leading magazine for the entire drinks industry worldwide. Feature articles and short communications cover the whole spectrum of processing, bottling, raw materials, logistics, packaging and marketing of beverages. We also report on special topics of regional interest and the trends in the beverage industries worldwide. Readers are executives and decision-makers in the brewing, dairy and mineral water industries, manufacturers of non-alcoholic drinks, wine growers and bottlers.
drinkworld Technology + Marketing is the leading magazine for the entire drinks industry worldwide. Feature articles and short communications cover the whole spectrum of processing, bottling, raw materials, logistics, packaging and marketing of beverages. We also report on special topics of regional interest and the trends in the beverage industries worldwide. Readers are executives and decision-makers in the brewing, dairy and mineral water industries, manufacturers of non-alcoholic drinks, wine growers and bottlers.

You also want an ePaper? Increase the reach of your titles
YUMPU automatically turns print PDFs into web optimized ePapers that Google loves.
Cover Story<br />
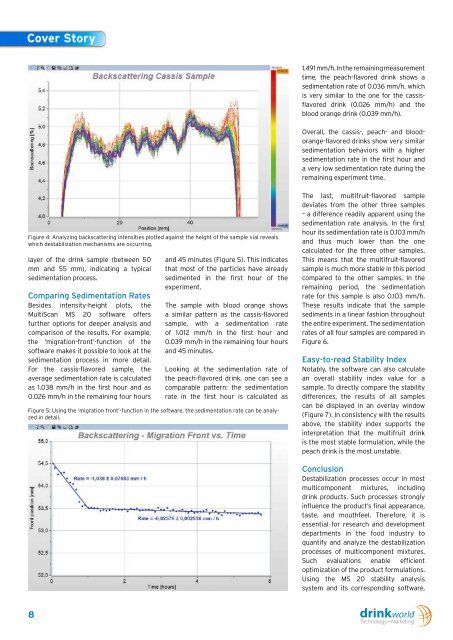
1.491 mm/h. In the remaining measurement<br />
time, the peach-flavored drink shows a<br />
sedimentation rate of 0.036 mm/h, which<br />
is very similar to the one for the cassisflavored<br />
drink (0.026 mm/h) and the<br />
blood orange drink (0.039 mm/h).<br />
Overall, the cassis-, peach- and bloodorange-flavored<br />
drinks show very similar<br />
sedimentation behaviors with a higher<br />
sedimentation rate in the first hour and<br />
a very low sedimentation rate during the<br />
remaining experiment time.<br />
Figure 4: Analyzing backscattering intensities plotted against the height of the sample vial reveals<br />
which destabilization mechanisms are occurring.<br />
layer of the drink sample (between 50<br />
mm and 55 mm), indicating a typical<br />
sedimentation process.<br />
Comparing Sedimentation Rates<br />
Besides intensity-height plots, the<br />
MultiScan MS 20 software offers<br />
further options for deeper analysis and<br />
comparison of the results. For example,<br />
the ‘migration-front’-function of the<br />
software makes it possible to look at the<br />
sedimentation process in more detail.<br />
For the cassis-flavored sample, the<br />
average sedimentation rate is calculated<br />
as 1.038 mm/h in the first hour and as<br />
0.026 mm/h in the remaining four hours<br />
and 45 minutes (Figure 5). This indicates<br />
that most of the particles have already<br />
sedimented in the first hour of the<br />
experiment.<br />
The sample with blood orange shows<br />
a similar pattern as the cassis-flavored<br />
sample, with a sedimentation rate<br />
of 1.012 mm/h in the first hour and<br />
0.039 mm/h in the remaining four hours<br />
and 45 minutes.<br />
Looking at the sedimentation rate of<br />
the peach-flavored drink, one can see a<br />
comparable pattern: the sedimentation<br />
rate in the first hour is calculated as<br />
Figure 5: Using the ‘migration front’-function in the software, the sedimentation rate can be analyzed<br />
in detail.<br />
The last, multifruit-flavored sample<br />
deviates from the other three samples<br />
– a difference readily apparent using the<br />
sedimentation rate analysis. In the first<br />
hour its sedimentation rate is 0.103 mm/h<br />
and thus much lower than the one<br />
calculated for the three other samples.<br />
This means that the multifruit-flavored<br />
sample is much more stable in this period<br />
compared to the other samples. In the<br />
remaining period, the sedimentation<br />
rate for this sample is also 0.103 mm/h.<br />
These results indicate that the sample<br />
sediments in a linear fashion throughout<br />
the entire experiment. The sedimentation<br />
rates of all four samples are compared in<br />
Figure 6.<br />
Easy-to-read Stability Index<br />
Notably, the software can also calculate<br />
an overall stability index value for a<br />
sample. To directly compare the stability<br />
differences, the results of all samples<br />
can be displayed in an overlay window<br />
(Figure 7). In consistency with the results<br />
above, the stability index supports the<br />
interpretation that the multifruit drink<br />
is the most stable formulation, while the<br />
peach drink is the most unstable.<br />
Conclusion<br />
Destabilization processes occur in most<br />
multicomponent mixtures, including<br />
drink products. Such processes strongly<br />
influence the product’s final appearance,<br />
taste, and mouthfeel. Therefore, it is<br />
essential for research and development<br />
departments in the food industry to<br />
quantify and analyze the destabilization<br />
processes of multicomponent mixtures.<br />
Such evaluations enable efficient<br />
optimization of the product formulations.<br />
Using the MS 20 stability analysis<br />
system and its corresponding software,<br />
8