Gastroenterology Today Autumn 2023
Gastroenterology Today Autumn 2023
Gastroenterology Today Autumn 2023

You also want an ePaper? Increase the reach of your titles
YUMPU automatically turns print PDFs into web optimized ePapers that Google loves.
FEATURE<br />
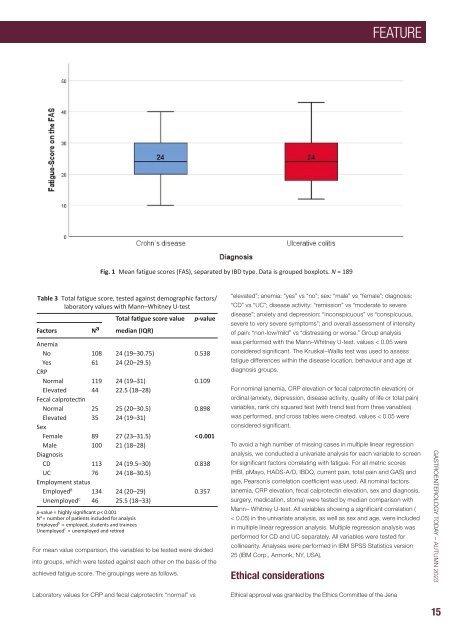
Fig. 1 Mean fatigue scores (FAS), separated by IBD type. Data is grouped boxplots. N = 189<br />
Table 3 Total fatigue score, tested against demographic factors/<br />
laboratory values with Mann–Whitney U-test<br />
p-value = p < 0.001<br />
N a =<br />
Employed b = employed, students and trainees<br />
Unemployed c = unemployed and retired<br />
Total fatigue score value<br />
Factors N a median (IQR)<br />
For mean value comparison, the variables to be tested were divided<br />
into groups, which were tested against each other on the basis of the<br />
achieved fatigue score. The groupings were as follows.<br />
p-value<br />
Anemia<br />
No 108 24 (19–30.75) 0.538<br />
Yes 61 24 (20–29.5)<br />
CRP<br />
Normal 119 24 (19–31) 0.109<br />
Elevated 44 22.5 (18–28)<br />
Fecal calprotectin<br />
Normal 25 25 (20–30.5) 0.898<br />
Elevated 35 24 (19–31)<br />
Sex<br />
Female 89 27 (23–31.5) < 0.001<br />
Male 100 21 (18–28)<br />
Diagnosis<br />
CD 113 24 (19.5–30) 0.838<br />
UC 76 24 (18–30.5)<br />
Employment status<br />
Employed B 134 24 (20–29) 0.357<br />
Unemployed C 46 25.5 (18–33)<br />
“elevated”; anemia: “yes” vs “no”; sex: “male” vs “female”; diagnosis:<br />
“CD” vs “UC”; disease activity: “remission” vs “moderate to severe<br />
disease”; anxiety and depression: “inconspicuous” vs “conspicuous,<br />
severe to very severe symptoms”; and overall assessment of intensity<br />
of pain: “non-low/mild” vs “distressing or worse.” Group analysis<br />
was performed with the Mann–Whitney U-test. values < 0.05 were<br />
considered significant. The Kruskal–Wallis test was used to assess<br />
fatigue differences within the disease location, behaviour and age at<br />
diagnosis groups.<br />
For nominal (anemia, CRP elevation or fecal calprotectin elevation) or<br />
ordinal (anxiety, depression, disease activity, quality of life or total pain)<br />
variables, rank chi squared test (with trend test from three variables)<br />
was performed, and cross tables were created. values < 0.05 were<br />
considered significant.<br />
To avoid a high number of missing cases in multiple linear regression<br />
analysis, we conducted a univariate analysis for each variable to screen<br />
for significant factors correlating with fatigue. For all metric scores<br />
(HBI, pMayo, HADS-A/D, IBDQ, current pain, total pain and GAS) and<br />
age, Pearson´s correlation coefficient was used. All nominal factors<br />
(anemia, CRP elevation, fecal calprotectin elevation, sex and diagnosis,<br />
surgery, medication, stoma) were tested by median comparison with<br />
Mann– Whitney U-test. All variables showing a significant correlation (<br />
< 0.05) in the univariate analysis, as well as sex and age, were included<br />
in multiple linear regression analysis. Multiple regression analysis was<br />
performed for CD and UC separately. All variables were tested for<br />
collinearity. Analyses were performed in IBM SPSS Statistics version<br />
25 (IBM Corp., Armonk, NY, USA).<br />
Ethical considerations<br />
GASTROENTEROLOGY TODAY – AUTUMN <strong>2023</strong><br />
Laboratory values for CRP and fecal calprotectin: “normal” vs<br />
Ethical approval was granted by the Ethics Committee of the Jena<br />
15