Gastroenterology Today Autumn 2023
Gastroenterology Today Autumn 2023
Gastroenterology Today Autumn 2023

Create successful ePaper yourself
Turn your PDF publications into a flip-book with our unique Google optimized e-Paper software.
FEATURE<br />
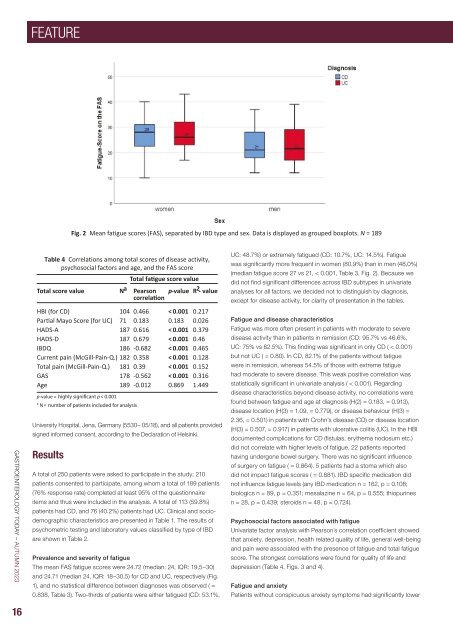
Fig. 2 Mean fatigue scores (FAS), separated by IBD type and sex. Data is displayed as grouped boxplots. N = 189<br />
GASTROENTEROLOGY TODAY – AUTUMN <strong>2023</strong><br />
Table 4 Correlations among total scores of disease activity,<br />
psychosocial factors and age, and the FAS score<br />
p-value = p < 0.001<br />
a<br />
N =<br />
University Hospital, Jena, Germany (5530– 05/18), and all patients provided<br />
signed informed consent, according to the Declaration of Helsinki.<br />
Results<br />
A total of 250 patients were asked to participate in the study; 210<br />
patients consented to participate, among whom a total of 189 patients<br />
(76% response rate) completed at least 95% of the questionnaire<br />
items and thus were included in the analysis. A total of 113 (59.8%)<br />
patients had CD, and 76 (40.2%) patients had UC. Clinical and sociodemographic<br />
characteristics are presented in Table 1. The results of<br />
psychometric testing and laboratory values classified by type of IBD<br />
are shown in Table 2.<br />
Prevalence and severity of fatigue<br />
Total fatigue score value<br />
Total score value N a Pearson<br />
correlation p-value R2 - value<br />
HBI (for CD) 104 0.466 < 0.001 0.217<br />
Partial Mayo Score (for UC) 71 0.183 0.183 0.026<br />
HADS-A 187 0.616 < 0.001 0.379<br />
HADS-D 187 0.679 < 0.001 0.46<br />
IBDQ 186 -0.682 < 0.001 0.465<br />
Current pain (McGill-Pain-Q.) 182 0.358 < 0.001 0.128<br />
Total pain (McGill-Pain-Q.) 181 0.39 < 0.001 0.152<br />
GAS 178 -0.562 < 0.001 0.316<br />
Age 189 -0.012 0.869 1.449<br />
The mean FAS fatigue scores were 24.72 (median: 24, IQR: 19,5–30)<br />
and 24.71 (median 24, IQR: 18–30,5) for CD and UC, respectively (Fig.<br />
1), and no statistical difference between diagnoses was observed ( =<br />
0.838, Table 3). Two-thirds of patients were either fatigued (CD: 53.1%,<br />
UC: 48.7%) or extremely fatigued (CD: 10.7%, UC: 14.5%). Fatigue<br />
was significantly more frequent in women (80,9%) than in men (48,0%)<br />
(median fatigue score 27 vs 21, < 0.001, Table 3, Fig. 2). Because we<br />
did not find significant differences across IBD subtypes in univariate<br />
analyses for all factors, we decided not to distinguish by diagnosis,<br />
except for disease activity, for clarity of presentation in the tables.<br />
Fatigue and disease characteristics<br />
Fatigue was more often present in patients with moderate to severe<br />
disease activity than in patients in remission (CD: 95.7% vs 46.6%,<br />
UC: 75% vs 62.5%). This finding was significant in only CD ( < 0.001)<br />
but not UC ( = 0.80). In CD, 82.1% of the patients without fatigue<br />
were in remission, whereas 54.5% of those with extreme fatigue<br />
had moderate to severe disease. This weak positive correlation was<br />
statistically significant in univariate analysis ( < 0.001). Regarding<br />
disease characteristics beyond disease activity, no correlations were<br />
found between fatigue and age at diagnosis (H(2) = 0.183, = 0.913),<br />
disease location (H(3) = 1.09, = 0.779), or disease behaviour (H(3) =<br />
2.36, = 0.501) in patients with Crohn’s disease (CD) or disease location<br />
(H(3) = 0.507, = 0.917) in patients with ulcerative colitis (UC). In the HBI<br />
documented complications for CD (fistulas, erythema nodosum etc.)<br />
did not correlate with higher levels of fatigue. 22 patients reported<br />
having undergone bowel surgery. There was no significant influence<br />
of surgery on fatigue ( = 0.864). 5 patients had a stoma which also<br />
did not impact fatigue scores ( = 0.881). IBD specific medication did<br />
not influence fatigue levels (any IBD medication n = 162, p = 0.108;<br />
biologics n = 89, p = 0.351; mesalazine n = 64, p = 0.555; thiopurines<br />
n = 28, p = 0.439; steroids n = 48, p = 0.724).<br />
Psychosocial factors associated with fatigue<br />
Univariate factor analysis with Pearson´s correlation coefficient showed<br />
that anxiety, depression, health related quality of life, general well-being<br />
and pain were associated with the presence of fatigue and total fatigue<br />
score. The strongest correlations were found for quality of life and<br />
depression (Table 4, Figs. 3 and 4).<br />
Fatigue and anxiety<br />
Patients without conspicuous anxiety symptoms had significantly lower<br />
16