Gastroenterology Today Autumn 2023
Gastroenterology Today Autumn 2023
Gastroenterology Today Autumn 2023

You also want an ePaper? Increase the reach of your titles
YUMPU automatically turns print PDFs into web optimized ePapers that Google loves.
FEATURE<br />
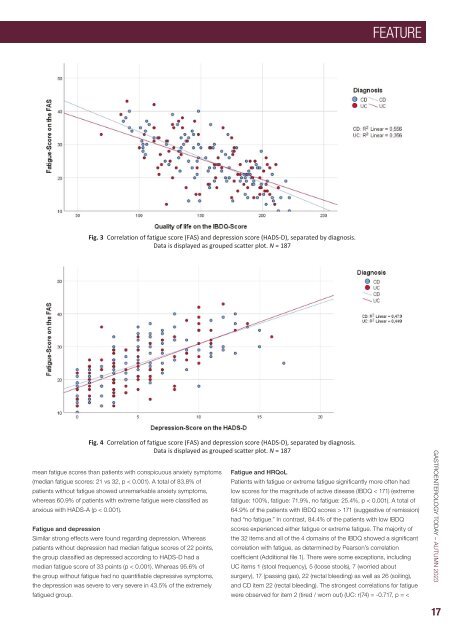
Fig. 3 Correlation of fatigue score (FAS) and depression score (HADS-D), separated by diagnosis.<br />
Data is displayed as grouped scatter plot. N = 187<br />
mean fatigue scores than patients with conspicuous anxiety symptoms<br />
(median fatigue scores: 21 vs 32, p < 0.001). A total of 83.8% of<br />
patients without fatigue showed unremarkable anxiety symptoms,<br />
whereas 60.9% of patients with extreme fatigue were classified as<br />
anxious with HADS-A (p < 0.001).<br />
Fatigue and depression<br />
Similar strong effects were found regarding depression. Whereas<br />
patients without depression had median fatigue scores of 22 points,<br />
the group classified as depressed according to HADS-D had a<br />
median fatigue score of 33 points (p < 0.001). Whereas 95.6% of<br />
the group without fatigue had no quantifiable depressive symptoms,<br />
the depression was severe to very severe in 43.5% of the extremely<br />
fatigued group.<br />
Fig. 4 Correlation of fatigue score (FAS) and depression score (HADS-D), separated by diagnosis.<br />
Data is displayed as grouped scatter plot. N = 187<br />
Fatigue and HRQoL<br />
Patients with fatigue or extreme fatigue significantly more often had<br />
low scores for the magnitude of active disease (IBDQ < 171) (extreme<br />
fatigue: 100%, fatigue: 71.9%, no fatigue: 25.4%, p < 0.001). A total of<br />
64.9% of the patients with IBDQ scores > 171 (suggestive of remission)<br />
had “no fatigue.” In contrast, 84.4% of the patients with low IBDQ<br />
scores experienced either fatigue or extreme fatigue. The majority of<br />
the 32 items and all of the 4 domains of the IBDQ showed a significant<br />
correlation with fatigue, as determined by Pearson’s correlation<br />
coefficient (Additional file 1). There were some exceptions, including<br />
UC items 1 (stool frequency), 5 (loose stools), 7 (worried about<br />
surgery), 17 (passing gas), 22 (rectal bleeding) as well as 26 (soiling),<br />
and CD item 22 (rectal bleeding). The strongest correlations for fatigue<br />
were observed for item 2 (tired / worn out) (UC: r(74) = -0.717, p = <<br />
GASTROENTEROLOGY TODAY – AUTUMN <strong>2023</strong><br />
17