Download latest annual report - HT Media
Download latest annual report - HT Media
Download latest annual report - HT Media

You also want an ePaper? Increase the reach of your titles
YUMPU automatically turns print PDFs into web optimized ePapers that Google loves.
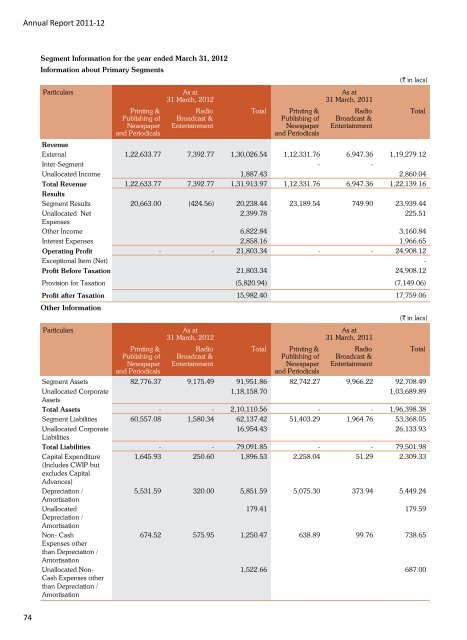
Annual Report 2011-12<br />
74<br />
Segment Information for the year ended March 31, 2012<br />
Information about Primary Segments<br />
Particulars As at<br />
31 March, 2012<br />
Printing &<br />
Publishing of<br />
Newspaper<br />
and Periodicals<br />
Radio<br />
Broadcast &<br />
Entertainment<br />
Total Printing &<br />
Publishing of<br />
Newspaper<br />
and Periodicals<br />
As at<br />
31 March, 2011<br />
Radio<br />
Broadcast &<br />
Entertainment<br />
(` in lacs)<br />
Revenue<br />
External 1,22,633.77 7,392.77 1,30,026.54 1,12,331.76 6,947.36 1,19,279.12<br />
Inter-Segment - -<br />
Unallocated Income 1,887.43 2,860.04<br />
Total Revenue<br />
Results<br />
1,22,633.77 7,392.77 1,31,913.97 1,12,331.76 6,947.36 1,22,139.16<br />
Segment Results 20,663.00 (424.56) 20,238.44 23,189.54 749.90 23,939.44<br />
Unallocated Net<br />
Expenses<br />
2,399.78 225.51<br />
Other Income 6,822.84 3,160.84<br />
Interest Expenses 2,858.16 1,966.65<br />
Operating Profit - - 21,803.34 - - 24,908.12<br />
Exceptional Item (Net) -<br />
Profit Before Taxation 21,803.34 24,908.12<br />
Provision for Taxation (5,820.94) (7,149.06)<br />
Profit after Taxation 15,982.40 17,759.06<br />
Other Information<br />
Particulars As at<br />
31 March, 2012<br />
Printing &<br />
Publishing of<br />
Newspaper<br />
and Periodicals<br />
Radio<br />
Broadcast &<br />
Entertainment<br />
Total Printing &<br />
Publishing of<br />
Newspaper<br />
and Periodicals<br />
As at<br />
31 March, 2011<br />
Radio<br />
Broadcast &<br />
Entertainment<br />
Total<br />
(` in lacs)<br />
Segment Assets 82,776.37 9,175.49 91,951.86 82,742.27 9,966.22 92,708.49<br />
Unallocated Corporate<br />
Assets<br />
1,18,158.70 1,03,689.89<br />
Total Assets - - 2,10,110.56 - - 1,96,398.38<br />
Segment Liabilities 60,557.08 1,580.34 62,137.42 51,403.29 1,964.76 53,368.05<br />
Unallocated Corporate<br />
Liabilities<br />
16,954.43 26,133.93<br />
Total Liabilities - - 79,091.85 - - 79,501.98<br />
Capital Expenditure<br />
(Includes CWIP but<br />
excludes Capital<br />
Advances)<br />
1,645.93 250.60 1,896.53 2,258.04 51.29 2,309.33<br />
Depreciation /<br />
Amortisation<br />
5,531.59 320.00 5,851.59 5,075.30 373.94 5,449.24<br />
Unallocated<br />
Depreciation /<br />
Amortisation<br />
179.41 179.59<br />
Non- Cash<br />
Expenses other<br />
than Depreciation /<br />
Amortisation<br />
674.52 575.95 1,250.47 638.89 99.76 738.65<br />
Unallocated Non-<br />
Cash Expenses other<br />
than Depreciation /<br />
Amortisation<br />
1,522.66 687.00<br />
Total