Texas Journal of Microscopy - Texas Society for Microscopy
Texas Journal of Microscopy - Texas Society for Microscopy
Texas Journal of Microscopy - Texas Society for Microscopy

You also want an ePaper? Increase the reach of your titles
YUMPU automatically turns print PDFs into web optimized ePapers that Google loves.
losa), a herbaceous exotic invader. All perennial species contained<br />
calcium carbonate deposits as primary and secondary cystoliths, and<br />
calcium oxalate prisms and druses. The herbaceous mulberry weed<br />
contained only druses. The leaves <strong>of</strong> fiddle-leaf ficus and paper mulberry<br />
possessed silicified trichomes, some <strong>of</strong> which with cystoliths<br />
inside their basal cells. EDAX analysis <strong>of</strong> the trichomes showed the<br />
presence <strong>of</strong> Ca, Si, and Mg. Calcium abundance increases towards<br />
the tip <strong>of</strong> the hair and Si abundance towards the base <strong>of</strong> the hair.<br />
Calcium decreases significantly at the base <strong>of</strong> the hair. The druses<br />
as well as the cystoliths extracted from the fiddle-leaf ficus leaves<br />
showed dominant peaks <strong>of</strong> Ca and traces <strong>of</strong> Si. In white mulberry,<br />
a small percentage <strong>of</strong> cystoliths have a dominant peak <strong>of</strong> Si than <strong>of</strong><br />
Ca. Soil analyses will help explain the deposition <strong>of</strong> Si on cystoliths<br />
<strong>of</strong> mulberry. This study will help us better understand the genetics<br />
and environmental factors involved in mineral deposition in plants<br />
<strong>of</strong> the mulberry family.<br />
A PRELIMINARY STUDY OF THE RELATIONSHIP<br />
BETWEEN HERBIVORE PREFERENCE AND THE<br />
ANATOMY AND MORPHOLOGY OF FORAGE SORGHUM<br />
LINES. M.W. PENDLETON , E. A. ELLIS , S. VITHA , F.R.<br />
MILLER 2 , and B.B. PENDLETON 3 , <strong>Microscopy</strong> & Imaging<br />
Center, <strong>Texas</strong> A&M University, College Station, <strong>Texas</strong> 77843-2257,<br />
2 MMR Genetics Ltd., Box 60, Vega, <strong>Texas</strong> 79092, 3 Department<br />
<strong>of</strong> Agricultural Sciences, West <strong>Texas</strong> A&M University, Canyon,<br />
<strong>Texas</strong> 790 6-000 .<br />
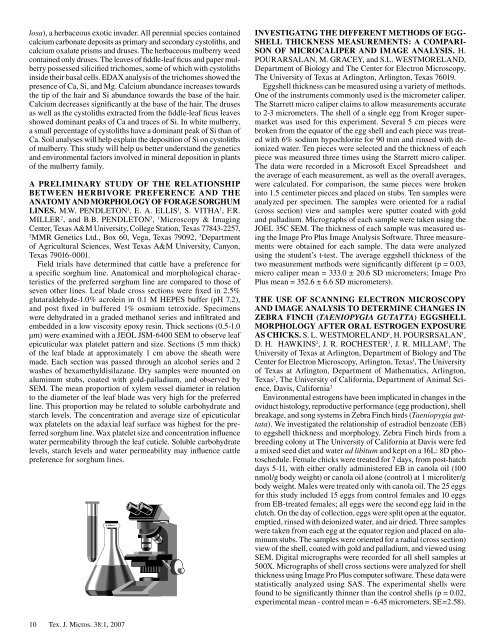
Field trials have determined that cattle have a preference <strong>for</strong><br />
a specific sorghum line. Anatomical and morphological characteristics<br />
<strong>of</strong> the preferred sorghum line are compared to those <strong>of</strong><br />
seven other lines. Leaf blade cross sections were fixed in 2.5%<br />
glutaraldehyde- .0% acrolein in 0. M HEPES buffer (pH 7.2),<br />
and post fixed in buffered % osmium tetroxide. Specimens<br />
were dehydrated in a graded methanol series and infiltrated and<br />
embedded in a low viscosity epoxy resin. Thick sections (0.5- .0<br />
µm) were examined with a JEOL JSM-6400 SEM to observe leaf<br />
epicuticular wax platelet pattern and size. Sections (5 mm thick)<br />
<strong>of</strong> the leaf blade at approximately cm above the sheath were<br />
made. Each section was passed through an alcohol series and 2<br />
washes <strong>of</strong> hexamethyldisilazane. Dry samples were mounted on<br />
aluminum stubs, coated with gold-palladium, and observed by<br />
SEM. The mean proportion <strong>of</strong> xylem vessel diameter in relation<br />
to the diameter <strong>of</strong> the leaf blade was very high <strong>for</strong> the preferred<br />
line. This proportion may be related to soluble carbohydrate and<br />
starch levels. The concentration and average size <strong>of</strong> epicuticular<br />
wax platelets on the adaxial leaf surface was highest <strong>for</strong> the preferred<br />
sorghum line. Wax platelet size and concentration influence<br />
water permeability through the leaf cuticle. Soluble carbohydrate<br />
levels, starch levels and water permeability may influence cattle<br />
preference <strong>for</strong> sorghum lines.<br />
0 Tex. J. Micros. 38: , 2007<br />
INVESTIGATNG THE DIFFERENT METHODS OF EGG-<br />
SHELL THICKNESS MEASUREMENTS: A COMPARI-<br />
SON OF MICROCALIPER AND IMAGE ANALYSIS. H.<br />
POURARSALAN, M. GRACEY, and S.L. WESTMORELAND,<br />
Department <strong>of</strong> Biology and The Center <strong>for</strong> Electron <strong>Microscopy</strong>,<br />
The University <strong>of</strong> <strong>Texas</strong> at Arlington, Arlington, <strong>Texas</strong> 760 9.<br />
Eggshell thickness can be measured using a variety <strong>of</strong> methods.<br />
One <strong>of</strong> the instruments commonly used is the micrometer caliper.<br />
The Starrett micro caliper claims to allow measurements accurate<br />
to 2-3 micrometers. The shell <strong>of</strong> a single egg from Kroger supermarket<br />
was used <strong>for</strong> this experiment. Several 5 cm pieces were<br />
broken from the equator <strong>of</strong> the egg shell and each piece was treated<br />
with 6% sodium hypochlorite <strong>for</strong> 90 min and rinsed with deionized<br />
water. Ten pieces were selected and the thickness <strong>of</strong> each<br />
piece was measured three times using the Starrett micro caliper.<br />
The data were recorded in a Micros<strong>of</strong>t Excel Spreadsheet and<br />
the average <strong>of</strong> each measurement, as well as the overall averages,<br />
were calculated. For comparison, the same pieces were broken<br />
into .5 centimeter pieces and placed on stubs. Ten samples were<br />
analyzed per specimen. The samples were oriented <strong>for</strong> a radial<br />
(cross section) view and samples were sputter coated with gold<br />
and palladium. Micrographs <strong>of</strong> each sample were taken using the<br />
JOEL 35C SEM. The thickness <strong>of</strong> each sample was measured using<br />
the Image Pro Plus Image Analysis S<strong>of</strong>tware. Three measurements<br />
were obtained <strong>for</strong> each sample. The data were analyzed<br />
using the student’s t-test. The average eggshell thickness <strong>of</strong> the<br />
two measurement methods were significantly different (p = 0.03,<br />
micro caliper mean = 333.0 ± 20.6 SD micrometers; Image Pro<br />
Plus mean = 352.6 ± 6.6 SD micrometers).<br />
THE USE OF SCANNING ELECTRON MICROSCOPY<br />
AND IMAGE ANALYSIS TO DETERMINE CHANGES IN<br />
ZEBRA FINCH (TAENIOPYGIA GUTATTA) EGGSHELL<br />
MORPHOLOGY AFTER ORAL ESTROGEN EXPOSURE<br />
AS CHICKS. S. L. WESTMORELAND , H. POURSRSALAN ,<br />
D. H. HAWKINS 2 , J. R. ROCHESTER 3 , J. R. MILLAM 3 , The<br />
University <strong>of</strong> <strong>Texas</strong> at Arlington, Department <strong>of</strong> Biology and The<br />
Center <strong>for</strong> Electron <strong>Microscopy</strong>, Arlington, <strong>Texas</strong> , The University<br />
<strong>of</strong> <strong>Texas</strong> at Arlington, Department <strong>of</strong> Mathematics, Arlington,<br />
<strong>Texas</strong> 2 , The University <strong>of</strong> Cali<strong>for</strong>nia, Department <strong>of</strong> Animal Science,<br />
Davis, Cali<strong>for</strong>nia 3<br />
Environmental estrogens have been implicated in changes in the<br />
oviduct histology, reproductive per<strong>for</strong>mance (egg production), shell<br />
breakage, and song systems in Zebra Finch birds (Taeniopygia guttata).<br />
We investigated the relationship <strong>of</strong> estradiol benzoate (EB)<br />
to eggshell thickness and morphology. Zebra Finch birds from a<br />
breeding colony at The University <strong>of</strong> Cali<strong>for</strong>nia at Davis were fed<br />
a mixed seed diet and water ad libitum and kept on a 6L: 8D photoschedule.<br />
Female chicks were treated <strong>for</strong> 7 days, from post-hatch<br />
days 5- , with either orally administered EB in canola oil ( 00<br />
nmol/g body weight) or canola oil alone (control) at microliter/g<br />
body weight. Males were treated only with canola oil. The 25 eggs<br />
<strong>for</strong> this study included 5 eggs from control females and 0 eggs<br />
from EB-treated females; all eggs were the second egg laid in the<br />
clutch. On the day <strong>of</strong> collection, eggs were split open at the equator,<br />
emptied, rinsed with deionized water, and air dried. Three samples<br />
were taken from each egg at the equator region and placed on aluminum<br />
stubs. The samples were oriented <strong>for</strong> a radial (cross section)<br />
view <strong>of</strong> the shell, coated with gold and palladium, and viewed using<br />
SEM. Digital micrographs were recorded <strong>for</strong> all shell samples at<br />
500X. Micrographs <strong>of</strong> shell cross sections were analyzed <strong>for</strong> shell<br />
thickness using Image Pro Plus computer s<strong>of</strong>tware. These data were<br />
statistically analyzed using SAS. The experimental shells were<br />
found to be significantly thinner than the control shells (p = 0.02,<br />
experimental mean - control mean = -6.45 micrometers, SE=2.58).