Status of Wisconsin Agriculture 2010 - Agricultural & Applied ...
Status of Wisconsin Agriculture 2010 - Agricultural & Applied ...
Status of Wisconsin Agriculture 2010 - Agricultural & Applied ...

Create successful ePaper yourself
Turn your PDF publications into a flip-book with our unique Google optimized e-Paper software.
S TAT U S O F<br />
<strong>Wisconsin</strong> <strong>Agriculture</strong><br />
<strong>2010</strong><br />
• <strong>Status</strong> <strong>of</strong> the <strong>Wisconsin</strong> Farm Economy<br />
• Current Outlook: Farm Products, Farm Inputs and the General Economy<br />
• Framing the Financial Crisis for <strong>Wisconsin</strong> <strong>Agriculture</strong><br />
Department <strong>of</strong> <strong>Agricultural</strong> and <strong>Applied</strong> Economics<br />
College <strong>of</strong> <strong>Agricultural</strong> and Life Sciences<br />
University <strong>of</strong> <strong>Wisconsin</strong>-Madison<br />
Cooperative Extension<br />
University <strong>of</strong> <strong>Wisconsin</strong>-Extension
<strong>Status</strong> <strong>of</strong> <strong>Wisconsin</strong> <strong>Agriculture</strong>, <strong>2010</strong><br />
An annual report by the Department <strong>of</strong> <strong>Agricultural</strong> and<br />
<strong>Applied</strong> Economics, UW-Madison and Cooperative Extension,<br />
UW-Extension<br />
Table <strong>of</strong> Contents<br />
Preface . . . . . . . . . . . . . . . . . . . . . . . . . . . . . . . . . . iii<br />
Executive Summary . . . . . . . . . . . . . . . . . . . . . . . . iv<br />
I. <strong>Status</strong> <strong>of</strong> the <strong>Wisconsin</strong> Farm Economy . . . . . . 1<br />
II. Current Outlook . . . . . . . . . . . . . . . . . . . . . . . . 7<br />
• The General Economy . . . . . . . . . . . . . . . . . . . 7<br />
• Farm Production Inputs and Services . . . . . . 14<br />
• Dairy . . . . . . . . . . . . . . . . . . . . . . . . . . . . . . . 17<br />
• Livestock and Poultry . . . . . . . . . . . . . . . . . . . 22<br />
• Corn and Soybeans . . . . . . . . . . . . . . . . . . . . . 25<br />
• Fruits and Vegetables . . . . . . . . . . . . . . . . . . . 29<br />
III. Framing the Financial Crisis<br />
for <strong>Wisconsin</strong> <strong>Agriculture</strong> . . . . . . . . . . . . . . . 31<br />
STATUS OF WISCONSIN AGRICULTURE <strong>2010</strong> i
Preface<br />
<strong>Status</strong> <strong>of</strong> <strong>Wisconsin</strong> <strong>Agriculture</strong> is an annual agricultural situation and outlook report authored<br />
(except where noted) by faculty in the Department <strong>of</strong> <strong>Agricultural</strong> and <strong>Applied</strong> Economics. The<br />
report contains three parts. Part I provides a brief overview <strong>of</strong> the financial environment in the<br />
<strong>Wisconsin</strong> farming sector. In Part II, market analysts review current conditions in major <strong>Wisconsin</strong><br />
commodity sub-sectors and <strong>of</strong>fer their forecasts for <strong>2010</strong>. Part III contains a series <strong>of</strong> articles that<br />
address issues related to the major downturn in the <strong>Wisconsin</strong> farm economy in 2009 and postrecovery<br />
evolution <strong>of</strong> the state’s farming sector.<br />
<strong>Status</strong> <strong>of</strong> <strong>Wisconsin</strong> <strong>Agriculture</strong> may be downloaded free from the internet at<br />
http://www.aae.wisc.edu/www/pub/. If you do not have internet access, contact Ms. Linda Davis,<br />
Department <strong>of</strong> <strong>Agricultural</strong> and <strong>Applied</strong> Economics, UW-Madison, 427 Lorch Street, Madison,<br />
WI 53706, to obtain a printed copy <strong>of</strong> the report.<br />
The faculty <strong>of</strong> the Department <strong>of</strong> <strong>Agricultural</strong> and <strong>Applied</strong> Economics welcomes your comments<br />
and questions on material in this report. We also encourage your suggestions regarding rural <strong>Wisconsin</strong><br />
issues that we might address in subsequent editions.<br />
Acknowledgements<br />
Funding for <strong>Status</strong> <strong>of</strong> <strong>Wisconsin</strong> <strong>Agriculture</strong> was provided by the University <strong>of</strong> <strong>Wisconsin</strong>-Madison<br />
Program on <strong>Agricultural</strong> Technology Studies and by generous contributors to the University <strong>of</strong><br />
<strong>Wisconsin</strong> Foundation. We also wish to thank Diane Doering and Bob Mitchell in the communication<br />
program <strong>of</strong> the College <strong>of</strong> <strong>Agricultural</strong> and Life Sciences for their production and distribution<br />
assistance.<br />
Ed Jesse, editor<br />
Department <strong>of</strong> <strong>Agricultural</strong> and <strong>Applied</strong> Economics<br />
Henry Taylor Hall<br />
University <strong>of</strong> <strong>Wisconsin</strong>-Madison<br />
Madison, WI 53706<br />
January <strong>2010</strong><br />
STATUS OF WISCONSIN AGRICULTURE <strong>2010</strong> iii
<strong>Status</strong> <strong>of</strong> <strong>Wisconsin</strong> <strong>Agriculture</strong>, <strong>2010</strong><br />
Executive Summary<br />
Following two years <strong>of</strong> generally fond memories, most <strong>Wisconsin</strong> farmers suffered through a year<br />
they would like to forget. Livestock producers, especially those selling milk and hogs, faced<br />
severe financial challenges. They received low prices for the products they sold and paid high<br />
prices for the feed they purchased, creating large flows <strong>of</strong> red ink, a rise in accounts payable and a<br />
drop in equity. Weather dealt a nasty end-<strong>of</strong>-year blow to corn and soybean producers. Combines<br />
sat idle in October and early November, normally the peak harvest season, because <strong>of</strong> waterlogged<br />
fields. When they finally started rolling, the combines reaped wet crops that were susceptible to<br />
molds and required extensive, expensive drying.<br />
Total receipts from <strong>Wisconsin</strong> farm marketings dropped by an estimated $1.8 billion (18 percent)<br />
in 2009, with nearly 80 percent <strong>of</strong> that decline resulting from much smaller milk checks. Crop revenue<br />
was <strong>of</strong>f by $270 million, mainly from lower corn prices. The lower crop and livestock sales<br />
receipts were partly <strong>of</strong>fset by cheaper fertilizer, fuel and feed and higher government payments<br />
(mainly Milk Income Loss Contract payments to dairy farmers). But these <strong>of</strong>fsets did little to<br />
staunch the bleeding. <strong>Wisconsin</strong> net farm income in 2009 was under 2008 by an estimated $1.45<br />
billion—a fall-<strong>of</strong>f <strong>of</strong> 56 percent.<br />
<strong>Wisconsin</strong> farmers began the year in a strong financial position, with the lowest ratio <strong>of</strong> debt to<br />
assets in at least 50 years. They finished it weakened by a loss <strong>of</strong> asset value and increased debt.<br />
Dairy farmers alone saw their equity fall by an estimated $1.8 billion. Losses were concentrated<br />
among larger dairy operations, which had fewer belt-tightening options. These larger farms also<br />
carry more debt per dollar <strong>of</strong> sales, making them more vulnerable to the restrictions on credit that<br />
have come with the recent financial crisis. But despite serious financial problems for some, <strong>Wisconsin</strong><br />
dairy farms as a whole entered <strong>2010</strong> with a debt-to-asset ratio <strong>of</strong> about 0.18, which is generally<br />
considered to be a robust financial position in the business world.<br />
Review <strong>of</strong> 2009<br />
The U.S. economy was dominated in 2009 by what has been tagged as the “Great Recession.”<br />
High unemployment cut consumer spending, affecting both the amount and type <strong>of</strong> food purchased.<br />
The Great Recession was not confined to the United States. Global economic woes cut<br />
world trade by almost 12 percent in 2009. The value <strong>of</strong> U.S. exports <strong>of</strong> all farm goods was down<br />
15 percent. Dairy exports were <strong>of</strong>f 50 percent.<br />
Farmers’ production costs were generally lower in 2009. Fertilizer prices were down about onethird<br />
and gas and diesel prices were about 10 percent less. But LP gas prices shot up near year-end<br />
because <strong>of</strong> heavy demand to dry abnormally wet corn. Interest rates on farm loans remained low,<br />
but some farmers had trouble getting credit. Farmland rents went up slightly, but stayed below the<br />
cost <strong>of</strong> servicing a mortgage to purchase the same land.<br />
For dairy farmers, the year began with a bang—the sound <strong>of</strong> milk prices hitting the floor. By February,<br />
the <strong>Wisconsin</strong> All-Milk price had dropped $9/hundredweight behind year-earlier levels and<br />
that gap continued until fall. The crash in milk prices was caused in large part by evaporating<br />
iv STATUS OF WISCONSIN AGRICULTURE <strong>2010</strong>—EXECUTIVE SUMMARY
export markets, which left more milk to be absorbed by domestic markets already crimped by<br />
recession. Producers were slow to respond to lower prices. Milk production did not fall below<br />
2008 levels until mid-year, which inflated inventories <strong>of</strong> manufactured dairy products.<br />
While marginally lower than 2008, high feed prices along with sluggish domestic and foreign<br />
demand hurt the bottom line <strong>of</strong> livestock and poultry producers. Per capita U.S. meat consumption<br />
fell for the second year in a row, ending up the lowest in a dozen years. Exports <strong>of</strong> beef, pork and<br />
broilers were all <strong>of</strong>f from 2008 volumes. Total meat production fell by 3 percent, the largest yearto-year<br />
decline in 27 years, but that wasn’t enough to bolster prices in the face <strong>of</strong> lighter demand.<br />
Hog producers’ pocketbooks took the biggest hit, with hog prices down 14 percent.<br />
Although some <strong>of</strong> the crop is still in the field, USDA forecasts a record 2009/10 U.S. corn yield<br />
and a total harvest <strong>of</strong> 12.9 billion bushels, just under the previous year’s crop. Boosted by ethanol<br />
production, the industrial use <strong>of</strong> corn is expected to exceed feed use in 2009/10. <strong>Wisconsin</strong>’s corn<br />
crop is forecast at 423 million bushels, up from 2008/09 by 29 million bushels thanks to an average<br />
9 bushels/acre gain in yield. U.S. soybean yields and total crop size are both expected to set<br />
new records in the 2009/10 crop year, with a total harvest <strong>of</strong> 3.3 billion bushels. USDA says <strong>Wisconsin</strong><br />
harvested 67 million bushels <strong>of</strong> soybeans in 2009, 20 percent more than 2008.<br />
Recovering from the huge 2008 crop, <strong>Wisconsin</strong> cranberry marshes produced an 11 percent<br />
smaller crop in 2009, but higher prices will result in a smaller reduction in revenue. Apple production<br />
was up 3 percent and the tart cherry crop was close to 2007 after a near crop failure in 2008.<br />
<strong>Wisconsin</strong> grew a large fall potato crop in 2009. Unfortunately, so did other major states, causing<br />
prices to fall well under 2008 by year-end. <strong>Wisconsin</strong> processing vegetable growers produced<br />
larger crops <strong>of</strong> sweet corn and green peas in 2009, but slightly less snap bean tonnage.<br />
Prospects for <strong>2010</strong><br />
Recovery from the Great Recession has been slow and that will carry over into <strong>2010</strong>—GDP<br />
growth will not likely exceed 2.5 percent. The economy will be driven by tailwinds in the form <strong>of</strong><br />
fiscal and monetary policies designed to stimulate the economy in 2009, which will continue and<br />
perhaps become more aggressive in <strong>2010</strong>. But these will be countered by headwinds in the form <strong>of</strong><br />
high unemployment, which will limit consumer spending and, as a result, dampen business investment<br />
and new hiring. Weakness in the U.S. dollar should promote increased agricultural trade, but<br />
how much trade expands depends more on the pace <strong>of</strong> economic recovery in buying countries.<br />
Fertilizers should be even cheaper in <strong>2010</strong> than in 2009. Fuel prices are more iffy, but a major<br />
increase in crude oil prices is not visible on the horizon. Aggressive efforts by the Federal Reserve<br />
to keep interest rates low in order to promote business investment will keep the cost <strong>of</strong> credit low<br />
to farmers. But the availability <strong>of</strong> credit will be an issue in the face <strong>of</strong> tighter loan qualification<br />
standards, less money to loan, and some bankers’ reticence to make agricultural loans.<br />
Dairy farmers will fare much better in <strong>2010</strong>. The national dairy cow herd will continue to shrink<br />
for most if not all <strong>of</strong> the year. The expected 2.4 percent decline in cow numbers will more than <strong>of</strong>fset<br />
a 1.8 increase in milk per cow (the long-time trend in milk yields), reducing milk production<br />
STATUS OF WISCONSIN AGRICULTURE <strong>2010</strong>—EXECUTIVE SUMMARY v
y about 2 billion pounds from 2009. Combined with growth in domestic consumption and<br />
stronger exports, this will tighten markets and strengthen prices. Expect a <strong>Wisconsin</strong> All-Milk<br />
price for the year <strong>of</strong> around $17.50 per hundredweight, up $4.50 from 2009. The cost <strong>of</strong> dairy feed<br />
is a big question mark, but large national corn and soybean crops should keep a lid on those prices.<br />
Total meat production is expected to fall again in <strong>2010</strong>. Smaller pork and beef output will <strong>of</strong>fset<br />
possibly larger output <strong>of</strong> broilers. Meat consumption in the United States will also decline again,<br />
but not by as much as production drops. Meat exports should recover all or most <strong>of</strong> what they lost<br />
in 2009. Modest price increases are expected for cattle (fed cattle, feeder cattle and utility cows).<br />
Hog prices should rise, perhaps enough to erase 2009’s 14 percent decline. No big changes in<br />
prices for broilers, turkeys and eggs are forecast.<br />
The very large U.S. corn and soybean crops harvested in 2009 are expected to hold prices for the<br />
2009/10 crop year under those <strong>of</strong> 2008/09. USDA expects a U.S. average farm price for corn in<br />
2009/10 <strong>of</strong> $3.55 per bushel, down 50 cents from last year and 65 cents under 2007/08. The forecast<br />
average farm price for soybeans is $9.50 per bushel, compared to about $10.00 in the previous<br />
two crop years. Planting intentions for the <strong>2010</strong> corn and bean crops have not yet been announced.<br />
This year’s special article is a set <strong>of</strong> papers commissioned by the UW-Madison Program on<br />
<strong>Agricultural</strong> Technology Studies (PATS) addressing the theme, Framing the Financial Crises for<br />
<strong>Wisconsin</strong> <strong>Agriculture</strong>: Perspectives on Resiliency and Impacts.<br />
vi STATUS OF WISCONSIN AGRICULTURE <strong>2010</strong>—EXECUTIVE SUMMARY
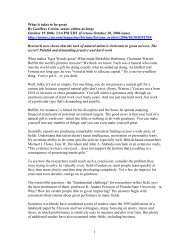
<strong>Wisconsin</strong> Farm Income<br />
After two consecutive record-setting<br />
years, <strong>Wisconsin</strong> net farm income<br />
plummeted in 2009. We estimate it<br />
to be $1.1 billion, which is less than<br />
half <strong>of</strong> 2008’s $2.6 billion and the<br />
lowest net farm income since 2002.<br />
U.S. net farm income also fell, but<br />
only by a third, compared to <strong>Wisconsin</strong>’s<br />
drop <strong>of</strong> 56 percent. <strong>Wisconsin</strong><br />
was hit harder because <strong>of</strong> a<br />
disproportionately large drop in the<br />
price <strong>of</strong> milk relative to changes in<br />
farm prices for other commodities.<br />
Sales <strong>of</strong> commodities from <strong>Wisconsin</strong><br />
farms in 2009 were <strong>of</strong>f $1.8 billion<br />
from 2008. Nearly 80 percent <strong>of</strong><br />
that decline came from milk sales,<br />
which were down $1.4 billion.<br />
<strong>Wisconsin</strong> farmers got some relief in<br />
2009 from a decrease in the costs <strong>of</strong><br />
$Million<br />
2,750<br />
2,500<br />
2,250<br />
2,000<br />
1,750<br />
1,500<br />
1,250<br />
1,000<br />
750<br />
500<br />
250<br />
I. <strong>Status</strong> <strong>of</strong> the <strong>Wisconsin</strong> Farm Economy<br />
Ed Jesse (608-262-6348) and Bruce Jones (608) 265-8508<br />
<strong>Wisconsin</strong> (Left Axis)<br />
United States (Right Axis)<br />
many inputs, which had soared in<br />
2008. In particular, expenditures for<br />
fertilizers and lime were down 28<br />
percent and fuel costs were 32 percent<br />
lower. But these savings on purchased<br />
inputs did little to <strong>of</strong>fset<br />
farmers’ massive loss <strong>of</strong> revenue.<br />
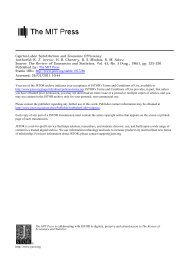
<strong>Wisconsin</strong> Farm Balance Sheet<br />
Dairy farm revenue for most <strong>of</strong> 2009<br />
fell far short <strong>of</strong> operating costs,<br />
causing many dairy farmers to tap<br />
financial reserves, liquidate assets or<br />
borrow operating capital to make up<br />
the shortfall. Equity was eroded<br />
through a decrease in assets or an<br />
increase in liabilities.<br />
Fortunately, the <strong>Wisconsin</strong> farm sector—in<br />
the aggregate—was on solid<br />
financial ground going into 2009.<br />
Following the mid-1980s crash in<br />
land values, <strong>Wisconsin</strong> farmers paid<br />
Source: Economic Research Service, USDA<br />
*2009 <strong>Wisconsin</strong> Income Estimated by Authors<br />
Net Farm Income: U.S. and <strong>Wisconsin</strong><br />
<strong>of</strong>f debt and enjoyed steady<br />
increases in land values through the<br />
1990s. Land values have escalated<br />
during the current decade, especially<br />
since 2005, while farm debt<br />
increased only modestly. At the end<br />
<strong>of</strong> 2008, the debt-to-asset ratio for<br />
<strong>Wisconsin</strong> farms in the aggregate<br />
stood at 0.11, lower than at any time<br />
over the last 50 years.<br />
However, aggregate figures hide<br />
some red flags pertaining to the<br />
composition <strong>of</strong> farm assets and debt<br />
across farms by economic class.<br />
Commercial farms—responsible for<br />
the bulk <strong>of</strong> commodity sales—hold<br />
a small share <strong>of</strong> total farm assets relative<br />
to their share <strong>of</strong> farm sales and<br />
a disproportionately large share <strong>of</strong><br />
debt. Farms with sales <strong>of</strong> less than<br />
$100,000, most <strong>of</strong> which are rural<br />
residences whose owners have full-<br />
0<br />
0<br />
1981 1985 1989 1993 1997 2001 2005 2009*<br />
STATUS OF WISCONSIN AGRICULTURE <strong>2010</strong>—THE WISCONSIN FARM ECONOMY 1<br />
120<br />
110<br />
100<br />
90<br />
80<br />
70<br />
60<br />
50<br />
40<br />
30<br />
20<br />
10<br />
$Billion
Derivation <strong>of</strong> <strong>Wisconsin</strong> Net Farm Income ($1000)<br />
2007 2008 2009 (Est*)<br />
Value <strong>of</strong> crop production:<br />
Food grains 104,980 164,637 115,000<br />
Feed crops 1,233,338 1,806,784 1,450,000<br />
Oil crops 330,043 413,115 400,000<br />
Fruits and tree nuts 232,473 287,091 300,000<br />
Vegetables 435,894 571,797 600,000<br />
All other crops 329,253 330,707 350,000<br />
Home consumption 3,562 4,283 6,000<br />
Inventory adjustment 75,575 -87,210 0<br />
Total Crops 2,745,118 3,491,204 3,221,000<br />
plus: Value <strong>of</strong> livestock production:<br />
Meat animals 972,826 938,366 830,000<br />
Dairy products 4,594,365 4,571,343 3,200,000<br />
Poultry and eggs 430,320 469,296 415,000<br />
Miscellaneous livestock 334,126 336,698 335,000<br />
Home consumption 18,373 22,091 22,000<br />
Value <strong>of</strong> inventory adjustment -22,148 -52,137 0<br />
Total Livestock 6,327,862 6,285,657 4,802,000<br />
plus: Revenues from services and forestry:<br />
Machine hire and custom work 126,266 84,925 83,000<br />
Forest products sold 20,740 20,750 21,000<br />
Other farm income 252,658 429,361 470,000<br />
Gross imputed rental value <strong>of</strong> farm dwellings 900,926 975,053 845,000<br />
Total 1,300,590 1,510,089 1,419,000<br />
equals Value <strong>of</strong> agricultural sector production 10,373,570 11,286,950 9,442,000<br />
less: Purchased inputs:<br />
Farm origin 1,629,189 1,987,965 1,970,000<br />
Manufactured inputs 1,335,875 1,576,659 1,290,000<br />
Other purchased inputs and Services 1,956,346 2,111,167 2,052,000<br />
Total 4,921,410 5,675,791 5,312,000<br />
plus: Government transactions:<br />
+ Direct Government payments 207,972 229,991 400,000<br />
- Motor vehicle registration and licensing fees 14,018 13,882 15,000<br />
- Property taxes 380,000 354,239 370,000<br />
Total -186,046 -138,130 15,000<br />
equals Gross value added 5,266,114 5,473,029 4,145,000<br />
less: Depreciation 1,265,870 1,343,640 1,362,000<br />
equals Net value added 4,000,244 4,129,389 2,783,000<br />
less: Payments to stakeholders<br />
Employee compensation (total hired labor) 862,025 905,059 950,000<br />
Net rent received by non-operator landlords 111,271 155,232 175,000<br />
Real estate and non-real estate interest 510,369 487,601 525,000<br />
Total 1,483,665 1,547,892 1,650,000<br />
Equals Net Farm Income 2,516,579 2,581,497 1,133,000<br />
*<strong>Wisconsin</strong> estimates are based on November 24, 2009, U.S. estimates (Economic Research Service, USDA). Preliminary state farm income<br />
estimates for 2009 will be published by USDA in August <strong>2010</strong>.<br />
2 STATUS OF WISCONSIN AGRICULTURE <strong>2010</strong>—THE WISCONSIN FARM ECONOMY
$Billion<br />
70<br />
60<br />
50<br />
40<br />
30<br />
20<br />
10<br />
Assets<br />
Debt<br />
Debt–Asset Ratio (Right Axis)<br />
0<br />
1960 1965 1970 1975 1980 1985 1990 1995 2000 2005<br />
time <strong>of</strong>f-farm jobs, account for<br />
nearly half <strong>of</strong> <strong>Wisconsin</strong> farm assets<br />
and less than 30 percent <strong>of</strong> farm<br />
debt. The 1,400 <strong>Wisconsin</strong> farms<br />
with 2008 sales exceeding $1 million<br />
had an average year end debtto-asset<br />
ratio <strong>of</strong> 0.23, more than<br />
double the state average. The 60,000<br />
<strong>Wisconsin</strong> farms with sales less than<br />
$100,000 had a debt-to-asset ratio <strong>of</strong><br />
0.064. These smaller farms with<br />
very strong balance sheets are not at<br />
financial risk. Large farms, with a<br />
much smaller share <strong>of</strong> assets comprised<br />
<strong>of</strong> equity, are generally more<br />
vulnerable.<br />
Dairy Farm Balance Sheet1 <strong>Wisconsin</strong> dairy farms, which were<br />
hit hardest by the drastic fall in net<br />
income in 2009, have a composition<br />
1 This section makes extensive use <strong>of</strong> data<br />
provided through the <strong>Agricultural</strong> Resource<br />
Management Survey (ARMS) database maintained<br />
by the Economic Research Service,<br />
USDA. <strong>Wisconsin</strong> data can be accessed at:<br />
www.ers.usda.gov/Data/ARMS/app/States.aspx.<br />
<strong>Wisconsin</strong> Farm Assets, Debt, and Debt-Asset Ratio<br />
Source: Economic Research Service, USDA<br />
<strong>of</strong> assets and debts that is different<br />
and more troubling than that<br />
reported for all farms. Compared to<br />
the average for all farms, large <strong>Wisconsin</strong><br />
dairy farms (more than $1<br />
million in sales) hold a larger share<br />
<strong>of</strong> total assets (20 percent) as well as<br />
debt (37 percent) and had a debt-toasst<br />
ratio <strong>of</strong> 0.275 in 2008. Dairy<br />
farms with less than $100,000 in<br />
sales held less than 10 percent <strong>of</strong><br />
both assets and debt and had a debtto-asset<br />
ratio <strong>of</strong> 0.09. This suggests<br />
that dairy farms overall are more<br />
financially vulnerable than other<br />
farms and that larger dairy farms<br />
may be particularly stressed in <strong>2010</strong>.<br />
However, we need to consider differences<br />
in productivity by dairy<br />
farm size. While the largest <strong>Wisconsin</strong><br />
dairy farms held only 20 percent<br />
<strong>of</strong> total dairy farm assets, they generated<br />
a disproportionately large<br />
share <strong>of</strong> gross returns to assets (net<br />
farm income before interest<br />
expenses and operator labor returns).<br />
Because <strong>of</strong> greater asset productiv-<br />
0.35<br />
0.30<br />
0.25<br />
0.20<br />
0.15<br />
0.10<br />
0.05<br />
0.00<br />
ity, dairy farms with more than $1<br />
million in sales accounted for about<br />
35 percent <strong>of</strong> the total gross returns<br />
produced by all dairy farms in 2008.<br />
Because they held more debt relative<br />
to assets, large dairy farms’ interest<br />
per dollar <strong>of</strong> gross return to assets<br />
was higher than smaller dairies. The<br />
ratio <strong>of</strong> interest expense to gross<br />
returns to assets—a financial measure<br />
comparable to the debt-to-asset<br />
ratio—was over 0.15 for dairies in<br />
the largest two size classes and only<br />
about 0.10 for the smallest size class.<br />
While the largest dairies have a<br />
higher ratio <strong>of</strong> interest expense to<br />
gross returns to assets compared to<br />
that <strong>of</strong> smaller operations, this ratio<br />
is lower than expected given that<br />
these operators average about 27<br />
cents <strong>of</strong> debt per dollar <strong>of</strong> assets.<br />
Normally, these two ratios are similar<br />
in value. This emphasizes the relatively<br />
high rate <strong>of</strong> returns to assets<br />
that the largest farms were able to<br />
generate.<br />
STATUS OF WISCONSIN AGRICULTURE <strong>2010</strong>—THE WISCONSIN FARM ECONOMY 3
60.0%<br />
50.0%<br />
40.0%<br />
30.0%<br />
20.0%<br />
10.0%<br />
0.0%<br />
60.0%<br />
50.0%<br />
40.0%<br />
30.0%<br />
20.0%<br />
10.0%<br />
0.0%<br />
<strong>Wisconsin</strong> Farm Assets and Debts by Farm Size, 2008, All Farm Types<br />
Debt to Asset Ratio (Right Axis)<br />
Debt to Asset Ratio (Right Axis)<br />
% <strong>of</strong><br />
Assets<br />
% <strong>of</strong><br />
Assets<br />
% <strong>of</strong><br />
Debt<br />
Gross Sales in $1,000<br />
<strong>Wisconsin</strong> Farm Assets and Debts by Size Class, 2008, Dairy Farms<br />
Source: Economic Research Service, USDA<br />
% <strong>of</strong><br />
Debt<br />
$1,000 + $500-999 $250-499 $100-249
Percent<br />
40<br />
36<br />
32<br />
28<br />
24<br />
20<br />
16<br />
12<br />
8<br />
4<br />
0<br />
Changes in Dairy Farm Equity<br />
Related to Financial Stress<br />
USDA’s <strong>Agricultural</strong> Resource Management<br />
Survey estimated total <strong>Wisconsin</strong><br />
dairy farm assets at the end<br />
<strong>of</strong> 2008 at $20.8 billion and total<br />
debt at $3.1 billion, leaving total<br />
equity at $17.7 billion. Equity was<br />
split 1/3-2/3 between dairy farms<br />
with more than $500,000 in sales<br />
and those with less than $500,000 in<br />
sales in 2008.<br />
<strong>Wisconsin</strong> dairy farm balance sheets<br />
weakened in 2009 from the combination<br />
<strong>of</strong> a loss in asset value and an<br />
Income Variables for <strong>Wisconsin</strong> Dairy Farms by Size Class, 2008<br />
Percent <strong>of</strong> Gross<br />
Returns to Assets<br />
(Left Axis)<br />
Percent <strong>of</strong><br />
Interest Expense<br />
(Left Axis<br />
increase in debt. The value <strong>of</strong> assets<br />
fell for three main reasons: (1) the<br />
value <strong>of</strong> dairy cows and heifers<br />
decreased because <strong>of</strong> much lower<br />
milk prices; (2) the value <strong>of</strong> land<br />
and buildings dropped because <strong>of</strong><br />
lower earning value; and (3) dairy<br />
farmers were forced to sell some<br />
assets (e.g., financial assets) to <strong>of</strong>fset<br />
negative cash flow.<br />
We estimated the loss in the value <strong>of</strong><br />
the state’s dairy cow inventory by<br />
subtracting reported USDA-NASS<br />
<strong>Wisconsin</strong> replacement cow prices<br />
in October 2009 ($1,200) from those<br />
Interest Expense as a<br />
Percent <strong>of</strong> Gross Returns<br />
to Assets (Right Axis)<br />
0<br />
$1,000,000 or more $500,000–$999,999 $250,000–$499,999 $100,000–$249,999 Less than $100,000<br />
2008 Sales<br />
Estimated <strong>Wisconsin</strong> Dairy Farm Assets and Debt by Sales Class,<br />
December 31, 2008. $Million<br />
Sales Class Assets Debt Equity<br />
$1,000,000+ 4,227 1,164 3,063<br />
$500,000 - 999,999 3,358 621 2,737<br />
$250,000 - 499,999 5,695 662 5,033<br />
$100,000 - 249,999 5,812 531 5,282<br />
< $100,000 1,741 161 1,580<br />
Total 20,833 3,139 17,695<br />
Source: <strong>Agricultural</strong> Resource Management Survey<br />
in October 2008 ($1,940). This<br />
yielded a $740/cow loss in value,<br />
which we reduced slightly to<br />
account for higher expected replacement<br />
cow prices later in 2009, then<br />
multiplied by the number <strong>of</strong> dairy<br />
cows in the state in November 2009<br />
(1.258 million cows). This gave us<br />
an estimated loss <strong>of</strong> cow value <strong>of</strong><br />
about $850 million.<br />
To estimate the loss in the value <strong>of</strong><br />
heifers, we assumed a ratio <strong>of</strong> 46<br />
heifers per 100 cows, which comes<br />
to about 575,000 heifers on <strong>Wisconsin</strong><br />
dairy farms in 2009. 2 We applied<br />
a loss in heifer value <strong>of</strong> $600 to<br />
derive an estimated total loss <strong>of</strong><br />
about $350 million. Combined with<br />
the estimated loss in cow value, this<br />
STATUS OF WISCONSIN AGRICULTURE <strong>2010</strong>—THE WISCONSIN FARM ECONOMY 5<br />
20<br />
18<br />
16<br />
14<br />
12<br />
10<br />
8<br />
6<br />
4<br />
2<br />
Percent<br />
2 USDA reports dairy heifers by state only for<br />
January. The January 2009 <strong>Wisconsin</strong> heifer<br />
count was 650,000. The U.S. heifer/cow ratio<br />
reported for July was 5 heifers per 100 cows<br />
less than the U.S. ratio in January. We<br />
reduced the January <strong>Wisconsin</strong> ratio by the<br />
same amount to derive July heifer numbers.
Projected <strong>Wisconsin</strong> Dairy Farm Assets and Debt, By Sales Class, December 31, 2009, $ Million<br />
Assets Debt Equity<br />
Sales Class 2009<br />
Change<br />
from 2008 2009<br />
Change<br />
from 2008 2009<br />
Change<br />
from 2008<br />
$1,000,000+ 3,766 (461) 1,269 105 2,497 (566)<br />
$500,000 - 999,999 3,068 (290) 672 51 2,396 (341)<br />
$250,000 - 499,999 5,327 (368) 722 60 4,605 (428)<br />
$100,000 - 249,999 5,443 (369) 560 29 4,883 (399)<br />
< $100,000 1,663 (103) 131 0 1,502 (78)<br />
Total 19,267 (1,566) 3,384 245 15,884 (1,810)<br />
Source: Projected by authors.<br />
adds up to a total estimated loss in<br />
dairy herd value <strong>of</strong> $1.2 billion. In<br />
allocating this loss across dairy farm<br />
size categories, we assumed equal<br />
cow and heifer values. This may not<br />
be a valid assumption, but we had<br />
no means <strong>of</strong> differentiating cow and<br />
heifer value by herd size.<br />
We estimated the loss in the value <strong>of</strong><br />
<strong>Wisconsin</strong> dairy farm land and<br />
buildings to be 3 percent in 2009,<br />
which corresponds to the January-<br />
July 2009 change in <strong>Wisconsin</strong><br />
farmland value reported by USDA-<br />
NASS and the change in “good”<br />
<strong>Wisconsin</strong> farmland from October 1,<br />
2008 to October 1, 2009 reported by<br />
the Federal Reserve Bank <strong>of</strong><br />
Chicago. We applied this percentage<br />
equally across dairy farm size categories.<br />
The total estimated reduction<br />
in land value for all <strong>Wisconsin</strong> dairy<br />
farms was $390 million.<br />
We have no basis for estimating<br />
losses associated with the sale <strong>of</strong><br />
assets to cover dairy farm operating<br />
losses. Instead, we crudely estimated<br />
operating losses and then assumed<br />
that these were <strong>of</strong>fset entirely by<br />
borrowed funds. This was clearly<br />
not the case, but the effect on dairy<br />
farm equity is the same whether<br />
assets were sold or money borrowed<br />
to cover losses.<br />
While it is impossible to measure<br />
the cash flow deficits incurred on<br />
<strong>Wisconsin</strong> dairy farms in 2009, we<br />
do have imperfect measures <strong>of</strong> gross<br />
and net cash income. We used the<br />
<strong>Wisconsin</strong> All-Milk price applied to<br />
monthly milk production as our<br />
measure <strong>of</strong> gross dairy income and<br />
added to that an estimated $240 million<br />
in MILC payments for the year.<br />
We used USDA-ERS estimated cash<br />
operating costs as our measure <strong>of</strong><br />
cash expenses. Subtracting cash<br />
costs from cash receipts yielded an<br />
estimate <strong>of</strong> total 2009 cash flow <strong>of</strong><br />
negative $245 million. This loss was<br />
allocated across farm size categories<br />
in proportion to their percent <strong>of</strong> the<br />
total livestock income in 2008.<br />
The estimated total value <strong>of</strong> assets<br />
held by dairy farms dropped about<br />
$1.6 billion in 2009. Debt, which is<br />
actually a combination <strong>of</strong> asset liquidation<br />
and borrowing to <strong>of</strong>fset<br />
negative cash flow, rose by an estimated<br />
$245 million. The net effect is<br />
an estimated $1.8 billion drop in<br />
equity for all <strong>Wisconsin</strong> dairies.<br />
The reduction in assets and equity<br />
are distributed somewhat uniformly<br />
across the four size classes <strong>of</strong> dairies<br />
with sales in excess <strong>of</strong> $100,000.<br />
However, the bulk <strong>of</strong> new borrowing<br />
was done by the largest farms.<br />
The overall debt-to-asset position <strong>of</strong><br />
all <strong>Wisconsin</strong> dairies rose from<br />
around 0.15 in 2008 to roughly 0.18<br />
in 2009. This indicates the weakened<br />
financial position <strong>of</strong> the <strong>Wisconsin</strong><br />
dairy industry. Nonetheless, a<br />
6 STATUS OF WISCONSIN AGRICULTURE <strong>2010</strong>—THE WISCONSIN FARM ECONOMY<br />
debt-to-asset position <strong>of</strong> less than<br />
0.20 still represents a sound financial<br />
position overall, despite some<br />
serious problems at the individual<br />
farm level.<br />
The largest dairy farms are likely to<br />
present some challenges for agricultural<br />
lenders in <strong>2010</strong>. These dairies<br />
are already heavy users <strong>of</strong> credit.<br />
They had 27 cents <strong>of</strong> debt per $1 <strong>of</strong><br />
assets in 2008 and by 2009 they had<br />
about 34 cents <strong>of</strong> debt per dollar <strong>of</strong><br />
assets. This elevated debt-to-asset<br />
position will be a concern to lenders<br />
who have to ensure that loan balances<br />
do not become too large relative<br />
to the value <strong>of</strong> collateral such as<br />
cows and farm real estate.<br />
While we believe it is important to<br />
provide a ballpark estimate <strong>of</strong> the<br />
loss in equity in the <strong>Wisconsin</strong> dairy<br />
farm sector due to low milk prices in<br />
2009, we must emphasize that this<br />
estimate is tentative. We made<br />
numerous assumptions to derive the<br />
components <strong>of</strong> equity loss, and the<br />
validity <strong>of</strong> many <strong>of</strong> these assumptions<br />
cannot be easily verified. Some<br />
assets, like cows and heifers, could<br />
regain value quickly with a strong<br />
rebound in milk prices. The value <strong>of</strong><br />
other assets, such as land, depend<br />
more on conditions outside <strong>of</strong> dairying<br />
than on milk prices. And it is<br />
impossible to accurately forecast<br />
when added debt will be repaid or<br />
discharged or when farmers will<br />
replace assets sold to cover losses.
The General Economy<br />
and <strong>Agricultural</strong> Trade<br />
Bill Dobson (608-262-6974)<br />
Synopsis<br />
II. Current Outlook: <strong>Wisconsin</strong> <strong>Agricultural</strong> Commodities,<br />
Production Inputs and the General Economy<br />
In this section, analysts <strong>of</strong>fer their insights on economic conditions for <strong>Wisconsin</strong> agriculture. Forecasts are<br />
provided for major <strong>Wisconsin</strong> farm commodities, farming inputs and the general economy. Because <strong>of</strong> the<br />
lingering effects on agriculture <strong>of</strong> the global financial crisis that began in late 2008, we begin this section<br />
with a detailed discussion <strong>of</strong> the current macroeconomic environment and what to expect in <strong>2010</strong> after what<br />
was a financially challenging 2009 for most <strong>Wisconsin</strong> farmers. Interested readers are encouraged to contact<br />
authors for more current or more detailed information regarding their analyses.<br />
Many economists have labeled the<br />
2008-2009 contraction as the Great<br />
Recession, categorizing it as the<br />
sharpest economic downturn since<br />
the Great Depression <strong>of</strong> the 1930s.<br />
The 2008-2009 recession clearly<br />
was among the worst in recent history,<br />
global in reach, and one that<br />
will produce a legacy <strong>of</strong> high unemployment<br />
and subdued economic<br />
growth in the United States.<br />
The stages <strong>of</strong> the Great Recession <strong>of</strong><br />
2008-2009 as measured by changes<br />
in real Gross Domestic Product<br />
(GDP) will trace out a U-shaped figure<br />
with a broad and irregular bottom<br />
and a gently sloping right side<br />
that denotes a slow recovery. While<br />
real GDP grew by a welcome 2.2<br />
percent in the 3rd quarter <strong>of</strong> 2009,<br />
this does not signal the return <strong>of</strong><br />
strong, sustained economic growth.<br />
Indeed, expect real GDP growth in<br />
<strong>2010</strong> to average only 2.0 to 2.5 percent.<br />
Moreover, unemployment,<br />
which rose to 10.2 percent in October<br />
2009, is likely to stay above 7<br />
percent until 2013 or 2014.<br />
Aggressive U.S. fiscal and monetary<br />
policies have helped to reduce<br />
impacts <strong>of</strong> the economic crisis that<br />
began in 2008 and produce a potentially<br />
sustainable recovery. But<br />
headwinds have developed in the<br />
wake <strong>of</strong> the Great Recession that<br />
will hamper the emergence <strong>of</strong> a<br />
smooth and rapid recovery. These<br />
come in the form <strong>of</strong> stubbornly high<br />
unemployment, weak business<br />
investment, budget problems <strong>of</strong><br />
state governments, challenges for<br />
the domestic auto industry, problems<br />
in commercial real estate markets<br />
and credit problems for small<br />
businesses.<br />
The U.S. agricultural sector was hit<br />
hard by the global recession. The<br />
USDA estimated that U.S. net farm<br />
income fell to $54 billion in 2009,<br />
down $33.2 billion (38 percent)<br />
from the near record total <strong>of</strong> $87.2<br />
billion for 2008. Problems in the<br />
sector contributed to a rare 3.2 percent<br />
drop in U.S. farm real estate<br />
prices on January 1, 2009. U.S. agricultural<br />
exports in fiscal 2009 fell to<br />
$96.6 billion, down 16 percent from<br />
the record, year-earlier total <strong>of</strong><br />
$115.3 billion. The weak U.S. dollar<br />
and other developments promise to<br />
help maintain U.S. agricultural<br />
exports in <strong>2010</strong> near the 2009 level.<br />
U.S. agricultural businesses experienced<br />
many <strong>of</strong> the problems that<br />
beset their counterparts in the nonagricultural<br />
sector. But longer-term<br />
prospects <strong>of</strong> many agribusinesses<br />
appear reasonably bright.<br />
After <strong>2010</strong>, U.S. policymakers will<br />
face the challenge <strong>of</strong> reducing federal<br />
deficits to manageable levels.<br />
Failure to meet the challenge will<br />
Macroeconomic Statistics for the U.S. Economy<br />
Year or Real GDP Unemploy- Inflation Housting Federal Sur-<br />
Quarter Growth ment Rate Rate (CPI) Starts plus/Defecit<br />
% % % Mil. Units $ Billion<br />
2000 3.7 4.0 3.4 1.57 236.1<br />
2001 0.8 4.7 2.8 1.601 126.9<br />
2002 1.8 5.8 1.6 1.710 -160.3<br />
2003 2.5 6.0 2.3 1.854 -375.2<br />
2004 3.6 5.5 2.7 1.950 -411.1<br />
2005 3.1 5.1 3.4 2.073 -321.0<br />
2006 2.7 4.6 3.2 1.812 -248.2<br />
2007 2.1 4.6 2.9 1.342 -161.5<br />
2008 0.4 5.8 3.8 0.900 -454.8<br />
2009 Q1 -6.4 8.1 -2.4 0.528 -448.9<br />
Q2 -0.7 9.3 1.3 0.540 -304.9<br />
Q3 2.2 9.6 3.6 0.590 -330.8<br />
*Sources: Global Insight, U.S. Executive Summary, various issues 2007-2009. Quarterly<br />
housing start figures for 2009 represent estimates <strong>of</strong> annualized figures for the series.<br />
STATUS OF WISCONSIN AGRICULTURE <strong>2010</strong>—CURRENT OUTLOOK: GENERAL ECONOMY AND AGRICULTURAL TRADE 7
push interest rates higher and could<br />
rekindle inflationary pressures.<br />
Nature <strong>of</strong> the Great Recession<br />
The 2008-2009 recession included<br />
three consecutive quarters <strong>of</strong> declining<br />
real GDP growth. This exceeds<br />
the technical definition <strong>of</strong> a recession,<br />
two consecutive quarters <strong>of</strong><br />
GDP shrinkage. But this understates<br />
the impact <strong>of</strong> the recent downturn.<br />
Statistics describing the 2008-2009<br />
recession and figures to watch during<br />
the economic recovery appear in<br />
the table on the previous page. The<br />
figures and subsequent material on<br />
tailwinds and headwinds affecting<br />
the economy provide insights<br />
regarding why the nation’s real GDP<br />
growth is likely to average only 2.0<br />
to 2.5 percent in <strong>2010</strong>. This is substantially<br />
lower than the average<br />
U.S. real GDP growth rate <strong>of</strong> 3.3<br />
percent (excluding recession years)<br />
during 1990 through 2007.<br />
The sharp contraction in business<br />
activity that accompanied the recession<br />
is reflected in the real GDP<br />
growth and unemployment figures.<br />
The U.S. economy shed some 7.2<br />
million jobs from the start <strong>of</strong> recession<br />
to the end <strong>of</strong> the third quarter <strong>of</strong><br />
2009. And only twice since WWII<br />
has the unemployment rate<br />
exceeded 10 percent—in the 4th<br />
quarter <strong>of</strong> 2009 (and for a yet<br />
unknown number <strong>of</strong> additional periods)<br />
and during September 1982 to<br />
June 1983.<br />
The table actually understates unemployment.<br />
For example, if discouraged<br />
job seekers who have quit<br />
looking for work and workers who<br />
are underemployed are added to the<br />
unemployment figures for the third<br />
quarter <strong>of</strong> 2009, the figures rises to<br />
about 17 percent. The larger figure<br />
is important because as the economy<br />
recovers, those who stopped searching<br />
for jobs will re-enter the job<br />
market, swelling the total number <strong>of</strong><br />
job seekers. Also, many part-time<br />
workers will be upgraded to fulltime<br />
work before new workers are<br />
hired. Efforts to reduce unemployment<br />
are further complicated by the<br />
fact that the U.S. economy must<br />
generate about 100,000 jobs per<br />
month just to keep pace with jobs<br />
required by a growing population.<br />
These and related developments will<br />
keep U.S. unemployment and underemployment<br />
high for several years.<br />
For the first three quarters <strong>of</strong> 2009,<br />
<strong>Wisconsin</strong>’s average unemployment<br />
rate (8.4 percent) remained below<br />
the U.S. figure (9.0 percent). However,<br />
<strong>Wisconsin</strong>’s unemployment<br />
trajectory differs from the nation’s.<br />
The unemployment rate declined<br />
modestly in <strong>Wisconsin</strong> late in 2009<br />
while it increased nationwide. In<br />
2009, <strong>Wisconsin</strong>’s highest unemployment<br />
rates were recorded in<br />
Janesville and Racine, where sharp<br />
cutbacks in manufacturing jobs<br />
caused double-digit unemployment<br />
for most <strong>of</strong> the first three quarters<br />
<strong>of</strong> 2009.<br />
The housing-start figures show the<br />
massive shrinkage <strong>of</strong> home building<br />
that occurred prior to and during the<br />
recession. U.S. housing starts for the<br />
first and second quarters <strong>of</strong> 2009<br />
were only about a quarter <strong>of</strong> those in<br />
2005. While housing starts probably<br />
bottomed out in the first or second<br />
quarter <strong>of</strong> 2009, the number <strong>of</strong> new<br />
houses being built in mid-to-late<br />
2009 still exceeded the 430,000 new<br />
houses that consumers have purchased<br />
annually in recent times.<br />
Moreover, sellers <strong>of</strong> new homes<br />
compete with those trying to sell<br />
existing homes. While U.S. home<br />
sales increased modestly in September<br />
and October 2009, the combination<br />
<strong>of</strong> oversupply plus home<br />
foreclosures—possibly as high as 3<br />
million in 2009—will prevent a<br />
strong upswing in housing prices in<br />
the near future.<br />
U.S. inflation was relatively low in<br />
2009. Moreover, excess capacity in<br />
many businesses and high unemployment<br />
will limit wage increases.<br />
These two factors will limit overall<br />
U.S. inflation for the foreseeable<br />
future. Importantly, the subdued<br />
inflationary outlook has implications<br />
for the impact <strong>of</strong> the large fiscal<br />
deficits being run by the U.S.<br />
The fiscal 2009 deficit equaled<br />
about $1.4 trillion and deficits as<br />
large as a trillion dollars a year are<br />
possible for the next decade. In the<br />
next year or two the deficits pose little<br />
or no inflationary threat. But persistently<br />
large deficits could add to<br />
inflationary pressures and almost<br />
certainly will push up interest rates<br />
over the longer-run. The higher<br />
interest rates will be needed to give<br />
domestic and foreign customers<br />
incentives to buy the larger quantities<br />
<strong>of</strong> U.S. Treasury securities that<br />
will be issued to finance the deficits.<br />
Tailwinds and Headwinds<br />
How strongly the U.S. economy<br />
emerges from the 2008-2009 recession<br />
will depend partly on the net<br />
effect <strong>of</strong> complex tailwinds and<br />
headwinds buffeting the economy.<br />
The analysis <strong>of</strong> these forces focuses<br />
on factors that will affect growth in<br />
real U.S. GDP (the total value <strong>of</strong><br />
goods and services produced).<br />
Tailwinds. The tailwinds include<br />
aggressive fiscal policy measures<br />
adopted in 2008 and 2009 by the<br />
Bush and Obama Administrations<br />
and monetary policy measures<br />
implemented by the Federal<br />
Reserve, increases in business sector<br />
productivity gained through cost–<br />
cutting, debt reductions on the part<br />
<strong>of</strong> consumers, and firms’ efforts to<br />
replenish inventories depleted during<br />
the recession.<br />
One prominent fiscal policy measure<br />
was the economic stimulus<br />
packaged passed into law in February<br />
2009, the main components <strong>of</strong><br />
which appear in the following table.<br />
Economists at Global Insight estimated<br />
that the stimulus would add<br />
about 0.8 percentage points to 2009<br />
real GDP growth and 1.3 percentage<br />
points to <strong>2010</strong> growth. These predictions<br />
should be interpreted with<br />
8 STATUS OF WISCONSIN AGRICULTURE <strong>2010</strong>—CURRENT OUTLOOK: GENERAL ECONOMY AND AGRICULTURAL TRADE
Allocation <strong>of</strong> Funds from the Fiscal Stimulus Package Passed in<br />
February 2009<br />
Use Amount ($Billion) % <strong>of</strong> Total<br />
Tax Relief 288 36.6<br />
State & Local Fiscal Relief 144 18.3<br />
Infrastructure/Science 111 14.1<br />
Aid for Displaced Workers 81 10.3<br />
Health Care 59 7.5<br />
Education & Training 53 6.7<br />
Energy 43 5.5<br />
Other 8 1.0<br />
Total $787 100.0%<br />
Source: White House as reported in Wall Street Journal, September 2, 2009.<br />
caution, since it is difficult to predict<br />
accurately the size <strong>of</strong> the economic<br />
growth multiplier associated with a<br />
diverse package <strong>of</strong> fiscal stimuli.<br />
The stimulus program has been criticized<br />
because many outlays under<br />
the program were slow to be implemented<br />
and failed to stem the big<br />
increases in unemployment in 2009.<br />
This may be a shortcoming <strong>of</strong> the<br />
legislation. However, the legislation<br />
should help to sustain the recovery,<br />
since outlays will be stretched out<br />
into <strong>2010</strong> and beyond.<br />
The nation also implemented a number<br />
<strong>of</strong> other programs in 2008 and<br />
2009 in the effort to pull the U.S.<br />
economy out <strong>of</strong> the recession. One<br />
is the Troubled Asset Relief Program<br />
(TARP). The first $350 billion<br />
<strong>of</strong> TARP funds was used mainly to<br />
buy stocks and warrants issued by<br />
large banks and to bolster bank balance<br />
sheets. In 2009, the TARP<br />
evolved into a multi-purpose bailout<br />
and loan fund. In connection with<br />
the latter purpose, in late 2009 the<br />
Obama Administration began to<br />
implement measures to make it easier<br />
for smaller banks to access<br />
TARP funds.<br />
The Term Asset-Backed Securities<br />
Loan Program Facilities (TALF)<br />
was launched in March 2009 by the<br />
Federal Reserve. The TALF serves<br />
primarily to increase the availability<br />
and extension <strong>of</strong> consumer credit,<br />
which had stalled in the wake <strong>of</strong> the<br />
global financial crisis. The types <strong>of</strong><br />
consumer credit made more readily<br />
available by the TALF included new<br />
credit cards, auto loans, student<br />
loans and small business loans. As<br />
<strong>of</strong> early November 2009, about $90<br />
billion in lending was facilitated by<br />
the TALF.<br />
The Public-Private Investment Program<br />
(PPIP) was introduced early in<br />
2009 to deal with toxic assets<br />
(mainly residential mortgage backed<br />
securities and commercial mortgage<br />
backed securities) in the financial<br />
system. The federal government’s<br />
objective for PPIP was to draw private<br />
investment capital (together<br />
with government capital) into the<br />
mortgage-backed securities market.<br />
The PPIP provided a market for<br />
securitized assets and freed U.S.<br />
banks to extend new credit.<br />
The TARP, TALF and PPIP programs<br />
were developed quickly and<br />
required modifications as they were<br />
implemented. It is no stretch to liken<br />
these programs to the experimental<br />
credit relief programs developed<br />
rapidly during the Great Depression.<br />
While imperfect, the current alphabet<br />
soup <strong>of</strong> programs helped to pre-<br />
vent a collapse <strong>of</strong> the U.S. financial<br />
system in 2008-2009 and made certain<br />
types <strong>of</strong> business and consumer<br />
credit more readily available. However,<br />
as noted later, small businesses,<br />
in particular, still are<br />
experiencing a credit crunch.<br />
Efforts to spur the auto industry<br />
included the “cash for clunkers”<br />
program and a provision <strong>of</strong> the February<br />
2009 stimulus program that<br />
allowed taxpayers to deduct state<br />
and local sales and excise taxes on<br />
new auto purchases on their 2009<br />
federal income tax forms. “Cash for<br />
clunkers” paid up to $4,500 to any<br />
buyer who traded in a gas-guzzling<br />
clunker for a more fuel-efficient<br />
new car. Some 700,000 cars were<br />
sold under the program in July and<br />
August <strong>of</strong> 2009. However, it’s likely<br />
that many <strong>of</strong> these sales were “borrowed”<br />
from future auto purchases.<br />
This is suggested by the fact that<br />
U.S. auto sales in September<br />
2009—the first month after “cash<br />
for clunkers” ended—were 10.4 percent<br />
below August 2009 figures and<br />
25 percent below those for September<br />
2008. September 2009 sales by<br />
financially troubled GM and<br />
Chrysler were more than 40 percent<br />
below year-earlier levels.<br />
The $8,000 tax credit for first-time<br />
home buyers increased home sales<br />
in late 2009. As buyers took advantage<br />
<strong>of</strong> the credit, which was originally<br />
scheduled to expire on<br />
November 30, 2009, existing homes<br />
home sales rose 9.4 percent in September<br />
2009, up 24 percent from<br />
January 2009 lows. Prices <strong>of</strong> existing<br />
homes also appear to have stabilized<br />
in September 2009, although<br />
they were still 8 to 9 percent below<br />
year-earlier levels. Like the “cash<br />
for clunkers” program, the tax credits<br />
for first-time home buyers<br />
undoubtedly borrowed a number <strong>of</strong><br />
sales from future months. This program<br />
has been extended to April 30,<br />
<strong>2010</strong>, and the tax credits will be<br />
available to some home purchasers<br />
who are not first-time buyers.<br />
STATUS OF WISCONSIN AGRICULTURE <strong>2010</strong>—CURRENT OUTLOOK: GENERAL ECONOMY AND AGRICULTURAL TRADE 9
The Federal Reserve was particularly<br />
active in combating the recession,<br />
implementing several<br />
programs in addition to its TALF<br />
program. As part <strong>of</strong> the effort to<br />
thaw frozen credit markets, the Fed<br />
cut the federal funds rate (inter-bank<br />
lending rate) to 0.0– 0.25 percent in<br />
December 2008 and kept it there<br />
through 2009. The Fed also assumed<br />
the role <strong>of</strong> a “bad bank” by acquiring<br />
troubled assets, including bundles<br />
<strong>of</strong> mortgage-backed securities<br />
held by Fannie Mae and Freddie<br />
Mac. In early October 2009, the<br />
Fed’s balance sheet showed $692<br />
billion in mortgage-backed securities,<br />
presumably <strong>of</strong> varying financial<br />
quality. The Fed’s balance sheet also<br />
contained a new class <strong>of</strong> assets representing<br />
the remnants <strong>of</strong> badly<br />
injured companies. The Fed’s balance<br />
sheet included assets valued at<br />
$2.12 trillion in early October 2009.<br />
During the recession, the Fed raised<br />
some red flags by regularly purchasing<br />
U.S. Treasury securities. However,<br />
the purchases should not be<br />
seen as monetizing the U.S. debt, or<br />
“printing money,” actions which<br />
could increase the rate <strong>of</strong> inflation.<br />
Indeed, these limited purchases <strong>of</strong><br />
Treasury securities had little or no<br />
inflationary impact and served<br />
mostly to keep mortgage and other<br />
long-term interest rates low.<br />
As the recession wound down, foreign<br />
investors became less riskaverse<br />
and began to seek higher<br />
returns, which triggered a partial<br />
exodus from dollar-denominated<br />
assets and weakened the U.S. dollar.<br />
The U.S. dollar was further weakened<br />
by massive prospective federal<br />
deficits and policy measures taken<br />
by the Federal Reserve. Some who<br />
hold dollar-denominated assets figure<br />
that the deficits and Federal<br />
Reserve actions eventually will produce<br />
additional inflation. As a result<br />
<strong>of</strong> these developments, the U.S. dollar-Euro<br />
exchange rate fell to $1.50<br />
in late October, 2009, a 14-month<br />
low. The dollar strengthened mod-<br />
estly against the Euro in December<br />
2009, reflecting a flight from the<br />
Euro after financial problems worsened<br />
in two Euro-zone countries—<br />
Greece and Ireland.<br />
The weaker dollar will help expand<br />
U.S. exports. Global Insight economists<br />
predict that the U.S. current<br />
account deficit (basically the excess<br />
<strong>of</strong> imports over exports) will shrink<br />
to $544 billion in <strong>2010</strong>, a decline <strong>of</strong><br />
about 25 percent from the pre-recession<br />
figure for 2007. The weaker<br />
dollar promises to be particularly<br />
helpful to the export-dependent U.S.<br />
farm sector and big exporters such<br />
as Caterpillar. Larger U.S. exports<br />
and a smaller current account deficit<br />
will compensate, in a limited way,<br />
for subdued consumer spending and<br />
help to produce modest economic<br />
growth in <strong>2010</strong>.<br />
However, these developments will<br />
not lead the U.S. into a new period<br />
<strong>of</strong> robust economic growth. Indeed,<br />
the narrowing <strong>of</strong> the trade gap may<br />
be at an end. In September 2009, the<br />
U.S. trade deficit experienced its<br />
largest one-month percentage rise in<br />
16 years. This raises the possibility<br />
that, as the U.S. economy recovers,<br />
imports may increase more rapidly<br />
than expected, limiting any contribution<br />
to growth from a smaller current<br />
account deficit.<br />
Productivity increases will contribute<br />
to a stronger U.S. economy<br />
in the longer run. Productivity in<br />
U.S. manufacturing rose 1.2 percent<br />
in 2008, tying us with South Korea<br />
for the largest gain among 17 major<br />
industrialized countries. And productivity<br />
continued to improve in<br />
2009. Over the longer run, productivity<br />
is the key to improved living<br />
standards, since it facilitates rising<br />
output, incomes and asset values.<br />
However, these productivity gains<br />
have been achieved partly at the<br />
expense <strong>of</strong> jobs. Indeed, the United<br />
States led 10 industrialized countries<br />
with a 3.4 percent decline in manufacturing<br />
employment and a 3.9 percent<br />
drop in the number <strong>of</strong> hours<br />
worked in 2008. Many U.S. workers<br />
laid <strong>of</strong>f in an effort to improve productivity<br />
will not be rehired.<br />
U.S. consumers have been gradually<br />
reducing their reliance on credit. For<br />
example, U.S. consumers reduced<br />
the share <strong>of</strong> disposable income used<br />
for mortgages, credit cards, rent and<br />
other obligations, from over 18 percent<br />
in 2007 to just over 16 percent<br />
in late 2009. But it’s likely that<br />
consumer credit still hasn’t been<br />
reduced to sustainable levels.<br />
The Federal Reserve put total U.S.<br />
household debt at $13.7 trillion,<br />
or 125 percent <strong>of</strong> annual after-tax<br />
income, in the third quarter <strong>of</strong> 2009.<br />
Many economists believe it will<br />
take several years for consumer<br />
to pare this figure to a more<br />
sustainable 100 percent <strong>of</strong> after-tax<br />
income. This de-leveraging will<br />
limit U.S. consumer spending for<br />
the next few years but will produce<br />
healthier household balance sheets.<br />
The normal recuperative powers <strong>of</strong><br />
the U.S. economy, <strong>of</strong> course, will<br />
continue to come into play in <strong>2010</strong>.<br />
Inventories depleted during the<br />
recession will be rebuilt, especially<br />
to satisfy export demand in China<br />
and elsewhere in Asia, where the<br />
economies are recovering faster than<br />
in many other parts <strong>of</strong> the world.<br />
Headwinds. The headwinds facing<br />
the economy are, in most cases,<br />
remnants <strong>of</strong> problems associated<br />
with the Great Recession. They<br />
include high residual unemployment,<br />
budget problems <strong>of</strong> state<br />
governments, credit problems for<br />
small businesses and uncertainty<br />
about government fiscal and<br />
monetary policies.<br />
Continued high unemployment will<br />
limit consumer spending, which will<br />
affect business investment and hiring.<br />
Consumer spending, which<br />
accounts for about 70 percent <strong>of</strong><br />
U.S. GDP, will be constrained by<br />
high unemployment and underemployment.<br />
Moreover, businesses will<br />
be reluctant to make new invest-<br />
10 STATUS OF WISCONSIN AGRICULTURE <strong>2010</strong>—CURRENT OUTLOOK: GENERAL ECONOMY AND AGRICULTURAL TRADE
ments and expand hiring until they<br />
are assured that consumer demand<br />
will be strong enough to buy additional<br />
products and services. This<br />
creates a chicken-and-egg problem,<br />
where consumers are reluctant to<br />
expand purchases until unemployment<br />
falls, and businesses are reluctant<br />
to invest and hire until<br />
consumer spending is strong enough<br />
to absorb the new capacity. This<br />
points to slow real GDP growth <strong>of</strong><br />
only about 2.0 to 2.5 percent in<br />
<strong>2010</strong>, as consumers and businesses<br />
feel their way forward.<br />
Many state governments face budget<br />
problems which will reduce the rate<br />
<strong>of</strong> growth <strong>of</strong> the overall U.S. economy.<br />
In a 2009 study, the Pew Center<br />
on the States examined in detail<br />
the problems <strong>of</strong> 11 states which face<br />
particularly difficult budget problems.<br />
The problems stemmed from<br />
widespread foreclosures, rising<br />
unemployment and poor financial<br />
management. California, other<br />
Western states and Florida—states<br />
which were hit hard by the bursting<br />
<strong>of</strong> the housing bubble—topped the<br />
list <strong>of</strong> states with budget problems.<br />
<strong>Wisconsin</strong>, Michigan and Illinois<br />
also made the Pew Center’s<br />
top-11 list.<br />
The Center on Budget and Policy<br />
Priorities forecasts that, barring<br />
more federal help, state budget cuts<br />
will shave nearly a percentage point<br />
<strong>of</strong>f growth in U.S. GDP and eliminate<br />
about 900,000 jobs in fiscal<br />
2011. These results would flow<br />
mainly from tax increases and<br />
budget cuts required to balance state<br />
budgets. Such an estimate should be<br />
viewed with caution, because it is<br />
unclear whether any organization<br />
can forecast such impacts on U.S.<br />
GDP with accuracy. But there is no<br />
question that the states’ budget problems<br />
are a strong headwind facing<br />
the U.S. economy.<br />
Government bailouts and loans were<br />
provided for large, financially-troubled<br />
banks and insurance companies<br />
and for General Motors (GM) and<br />
Chrysler—firms deemed too big to<br />
fail—with mixed results. Fortunately,<br />
many large banks returned to<br />
pr<strong>of</strong>itability late in 2009.<br />
As a result <strong>of</strong> its rescue efforts, the<br />
federal government acquired a 60<br />
percent stake in GM and a 10 percent<br />
stake in Chrysler. Both firms<br />
have emerged from bankruptcy, but<br />
Chrysler, in particular, remains in<br />
dire financial straits. Chrysler’s<br />
woes are reflected in its declining<br />
share <strong>of</strong> U.S. auto sales, which fell<br />
to 8.3 percent in September 2009,<br />
down from 11.1 percent a year earlier.<br />
Chrysler also suffers because it<br />
has few new models—especially<br />
fuel-efficient models—to <strong>of</strong>fer consumers.<br />
Fiat <strong>of</strong> Italy, which now<br />
owns 20 percent <strong>of</strong> Chrysler, will<br />
push to eliminate certain Chrysler<br />
and Jeep brands and introduce<br />
small, fuel-efficient cars and the<br />
premium Alfa Romeo brand in the<br />
United States as a partial replacement<br />
for discontinued Chrysler-<br />
Jeep products.<br />
Ford, which did not receive a government<br />
bailout, reported a $997<br />
million pr<strong>of</strong>it for the third quarter <strong>of</strong><br />
2009 and claims that it will return to<br />
solid pr<strong>of</strong>itability in 2011. This<br />
gives Ford a leg up on GM, which<br />
lost $1.15 billion in the third quarter<br />
<strong>of</strong> 2009. Ford’s third quarter <strong>of</strong> 2009<br />
pr<strong>of</strong>its reflect gains in market share,<br />
driven partly by sales <strong>of</strong> F-Series<br />
light trucks and Focus and Fusion<br />
cars. However, Ford too faces challenges.<br />
In particular, the company’s<br />
balance sheet showed $26.9 billion<br />
in debt at the end <strong>of</strong> the third quarter<br />
<strong>of</strong> 2009. This is probably manageable,<br />
but the company must sell into<br />
a U.S. car market that has shrunk<br />
from 16 million cars and light trucks<br />
in the early 2000s to a forecasted<br />
11.5 million units in <strong>2010</strong>.<br />
Problems remain for many regional<br />
banks, smaller banks and small businesses.<br />
Many bank failures occurred<br />
in Florida and California, where the<br />
burst <strong>of</strong> the housing bubble had big<br />
impacts. In addition, a large number<br />
<strong>of</strong> Georgia and Illinois banks failed<br />
in 2009. As <strong>of</strong> late November 2009,<br />
123 U.S. banks had failed, which is<br />
similar to the number <strong>of</strong> financial<br />
institutions that failed during the<br />
savings-and-loan crisis <strong>of</strong> the early<br />
1990s. Only one <strong>Wisconsin</strong> bank—<br />
the Bank <strong>of</strong> Elmwood in Racine—<br />
failed in 2009.<br />
Many banks fear problems with<br />
commercial real estate loans. In the<br />
third quarter <strong>of</strong> 2009, U.S. banks<br />
held $1.7 trillion <strong>of</strong> commercial<br />
mortgages and construction loans.<br />
Delinquencies on commercial mortgage<br />
debt played a role in the U.S.<br />
bank failures that occurred in 2009.<br />
While problems with commercial<br />
real estate will not rise to the level<br />
that emerged in residential real<br />
estate after 2007, the risk is potentially<br />
large for banks that hold large<br />
quantities <strong>of</strong> this debt.<br />
While many large businesses have<br />
gained access to additional credit in<br />
recent months, many small ones<br />
have not been so fortunate. This is<br />
partly because banks have tightened<br />
the underwriting standards for small<br />
business loans, making it difficult<br />
for many small businesses to qualify.<br />
One reason for the tighter lending<br />
standards is that banks still hold<br />
many bad loans that they do not<br />
wish to recognize as nonperforming.<br />
If all <strong>of</strong> these bad loans were pegged<br />
as nonperforming, a number <strong>of</strong> these<br />
banks could be forced into bankruptcy.<br />
The banks hope that they can<br />
renegotiate the loans in a manner<br />
that will allow the borrowers to<br />
make their payments. Cynics call<br />
this an “extend and pretend” lending<br />
strategy. While banks wait and see<br />
whether borrowers will resume<br />
making payments, they don’t want<br />
to take on additional small business<br />
loans that might go bad.<br />
Efforts by the Obama Administration<br />
to make TARP funds and Small<br />
Business Administration loans more<br />
readily available to small companies<br />
may help alleviate this problem.<br />
STATUS OF WISCONSIN AGRICULTURE <strong>2010</strong>—CURRENT OUTLOOK: GENERAL ECONOMY AND AGRICULTURAL TRADE 11
Many remain uncertain about how<br />
long government fiscal and monetary<br />
policies will continue, and in<br />
what form. Treasury Secretary Geithner<br />
says that the Obama Administration<br />
will not put forth a second<br />
major stimulus program in <strong>2010</strong>.<br />
However, some existing stimulus<br />
programs may be extended. Among<br />
programs that almost certainly will<br />
continue are those that extend<br />
unemployment compensation benefits<br />
and mortgage relief measures<br />
for homeowners facing foreclosure.<br />
Probably the greatest uncertainty<br />
surrounds how quickly the Federal<br />
Reserve will move to raise interest<br />
rates to head <strong>of</strong>f inflation. There’s<br />
an old adage that the Fed needs to<br />
remove the punch bowl before the<br />
party gets out <strong>of</strong> hand. This appears<br />
germane. However, Fed Chairman<br />
Bernanke also knows that if he<br />
raises interest rates too quickly and<br />
purges the Fed’s balance sheet <strong>of</strong><br />
assets acquired during the recession<br />
too soon, he risks creating a doubledip<br />
recession, or worse.<br />
International Trade Outlook<br />
The International Monetary Fund<br />
(IMF) estimates that world trade in<br />
2009 declined by nearly 12 percent<br />
from year-earlier levels, a magnitude<br />
<strong>of</strong> collapse not seen since the<br />
Great Depression. The IMF forecasts<br />
a modest expansion <strong>of</strong> 2 to 3<br />
percent in world trade in <strong>2010</strong>.<br />
According to the USDA, U.S. agricultural<br />
exports in fiscal 2009 fell to<br />
$96.6 billion, down 16 percent from<br />
the year-earlier record total <strong>of</strong><br />
$115.3 billion. The USDA forecasts<br />
that fiscal <strong>2010</strong> agricultural exports<br />
will be about $98 billion, which<br />
would be the second highest agricultural<br />
export total on record.<br />
U.S. agricultural imports in FY2009<br />
were $73.4 billion, down $6 billion<br />
(7 percent) from FY2008. USDA<br />
forecasts FY<strong>2010</strong> agricultural<br />
imports <strong>of</strong> $77.5 billion. The U.S.<br />
agricultural trade balance fell from<br />
$36 billion in FY2008 to $23.2 bil-<br />
lion in FY2009 and is forecast at<br />
$20.5 billion in FY<strong>2010</strong>.<br />
The USDA forecasts modest weakness<br />
in the value <strong>of</strong> coarse grain,<br />
wheat, and rice exports in <strong>2010</strong>. The<br />
weakness in export demand for<br />
these products is expected to be<br />
largely <strong>of</strong>fset by rising export<br />
demand for U.S. animal products.<br />
The weaker dollar and partial recovery<br />
<strong>of</strong> the world economy should<br />
spur U.S. exports <strong>of</strong> agricultural and<br />
non-agricultural products in <strong>2010</strong>.<br />
However, U.S. exporters will be<br />
constrained by protectionism and<br />
weak export demand in parts <strong>of</strong> the<br />
global economy.<br />
This protectionism has taken several<br />
forms, including “buy local” initiatives<br />
that have arisen in the United<br />
States (under the $787 billion stimulus<br />
package), Indonesia, Malaysia,<br />
and China, as well as other non-tariff<br />
barriers and increases in tariffs.<br />
A dispute relating to a non-tariff<br />
trade barrier has arisen between the<br />
United States and Canada over the<br />
U.S. country-<strong>of</strong>-origin labeling<br />
(COOL) law. Canada has asked the<br />
World Trade Organization (WTO) to<br />
appoint a panel to resolve a dispute<br />
over the U.S.’s mandatory COOL<br />
law. The COOL law requires firms<br />
to track and notify customers <strong>of</strong> the<br />
country <strong>of</strong> origin <strong>of</strong> meat and other<br />
agricultural products at each major<br />
stage <strong>of</strong> production, including retail.<br />
The Canadian government claims<br />
that country-<strong>of</strong>-origin labeling<br />
imposes unfair and unnecessary<br />
costs on integrated North American<br />
supply chains and reduces the competitiveness<br />
<strong>of</strong> Canadian beef and<br />
pork, in particular, in the U.S. market.<br />
Expect it to take several years<br />
for this dispute to be settled under<br />
the WTO.<br />
The United States raised tariffs on<br />
exports from China <strong>of</strong> certain auto<br />
and light truck tires in September<br />
2009 under a 2000 U.S. law that<br />
authorized higher tariffs when a<br />
surge in Chinese exports damages a<br />
U.S. industry. The higher tire tariffs<br />
will begin at 35 percent in the first<br />
year and fall by 5 percentage points<br />
in each <strong>of</strong> the two following years.<br />
China countered this action by<br />
claiming that U.S. auto parts,<br />
chicken parts, and an industrial<br />
chemical used to produce nylon<br />
were sold in China at below cost<br />
(dumped). China has imposed antidumping<br />
duties on the industrial<br />
chemical. In early November 2009,<br />
the U.S. levied tariffs on China’s<br />
exports <strong>of</strong> steel pipe. A number <strong>of</strong><br />
additional trade issues between the<br />
two countries remain unresolved.<br />
Perhaps <strong>of</strong> greater concern is the<br />
behavior <strong>of</strong> the Chinese yuan, which<br />
China has kept pegged to the U.S.<br />
dollar. China, it can be argued,<br />
should have a currency that is rising<br />
in value since the country has a<br />
large trade surplus and a rapidly<br />
recovering economy. By pegging its<br />
currency to the depreciating U.S.<br />
dollar, China, in effect, has engineered<br />
a large devaluation <strong>of</strong> its currency<br />
to further boost the country’s<br />
exports. The United States and other<br />
traders have alleged that China’s<br />
currency manipulation reduces the<br />
demand for the exports <strong>of</strong> a host<br />
<strong>of</strong> countries.<br />
Protectionism and alleged currency<br />
manipulation also reduce the<br />
appetite for completing bilateral or<br />
multilateral trade agreements. Thus,<br />
the Obama Administration has<br />
elected not to bring bilateral trade<br />
agreements negotiated by the Bush<br />
Administration with Panama,<br />
Colombia and South Korea up for a<br />
congressional ratification vote. It is<br />
also no surprise that major trading<br />
nations have shown limited interest<br />
in completing the Doha Round <strong>of</strong><br />
WTO negotiations, which began in<br />
2001. Failure to complete the Doha<br />
Round is likely to have harmful<br />
longer-term effects on efficient U.S.<br />
exporters <strong>of</strong> agricultural and nonagricultural<br />
products.<br />
In the aggregate, U.S. agricultural<br />
exports held up reasonably well in<br />
12 STATUS OF WISCONSIN AGRICULTURE <strong>2010</strong>—CURRENT OUTLOOK: GENERAL ECONOMY AND AGRICULTURAL TRADE
2009 in light <strong>of</strong> the global recession.<br />
However, U.S. dairy product and<br />
pork exports, in particular, fell<br />
sharply, contributing to lower<br />
domestic prices for these products.<br />
U.S. dairy exports totaled $3.8 billion<br />
in 2008, up $800 million from<br />
record 2007 levels, and absorbed<br />
about 11 percent <strong>of</strong> the 2008 U.S.<br />
milk supply. But those figures mask<br />
the sharp fall in U.S. dairy exports<br />
that began late in 2008 when the<br />
value <strong>of</strong> exports <strong>of</strong> U.S. nonfat dry<br />
milk, whey and butter all declined<br />
by about 50 percent from year earlier<br />
levels. U.S. dairy exports<br />
remained weak until about mid-<br />
2009. The resurrection <strong>of</strong> the U.S.<br />
Dairy Export Incentive Program,<br />
which provides export subsidies,<br />
and increased USDA dairy price<br />
support activity in 2009 helped to<br />
limit the drop in U.S. farm milk<br />
prices by a modest amount. But<br />
painful reductions in milk supply<br />
were needed to bring the U.S. dairy<br />
supply-demand balance to levels<br />
that stemmed the hemorrhaging <strong>of</strong><br />
red ink from farm balance sheets.<br />
U.S. pork exports also were down<br />
by 13 percent from year-earlier levels<br />
during the first eight months <strong>of</strong><br />
2009, contributing to the longerterm<br />
woes <strong>of</strong> pork producers. This<br />
was partly due to China’s closing <strong>of</strong><br />
its market to U.S. pork in the wake<br />
<strong>of</strong> the H1NI (Swine flu) outbreak.<br />
China had been the second largest<br />
U.S. export market for pork, with<br />
sales <strong>of</strong> $560 million in 2008. This<br />
problem was remedied in part when<br />
China re-opened its market for U.S.<br />
pork exports late in 2009.<br />
Both milk and pork prices are<br />
expected to be strengthened modestly<br />
by higher dairy and pork<br />
exports in <strong>2010</strong>. U.S. broiler and<br />
beef producers also are expected<br />
to benefit from larger exports in<br />
<strong>2010</strong>. However, U.S. broiler producers<br />
will face strong competition<br />
from Brazil.<br />
In the past, the U.S. agricultural sec-<br />
tor <strong>of</strong>ten has been affected more by<br />
the supply and demand conditions<br />
for individual farm commodities<br />
than by macroeconomic conditions<br />
and global trade developments.<br />
This was not true in 2009. The<br />
global recession hit the U.S. farm<br />
sector hard.<br />
Global developments were reflected<br />
in USDA’s estimates <strong>of</strong> U.S. net<br />
farm income, which fell to $54 billion<br />
in 2009, down 33.2 billion (38<br />
percent) from the near-record total<br />
<strong>of</strong> $87.2 billion for 2008. Problems<br />
in the farm sector contributed to a<br />
rare 3.2 percent decline from yearearlier<br />
levels in U.S. farm real estate<br />
prices on January 1, 2009.<br />
U.S. agribusiness experienced many<br />
<strong>of</strong> the same problems that hit their<br />
counterparts in the nonagricultural<br />
sector. Deere & Co., whose farm<br />
equipment sales are strongly correlated<br />
with changes in U.S. net farm<br />
income, reported that the company’s<br />
2009 farm equipment sales would<br />
fall by about 15 percent from the<br />
previous year. This was a relatively<br />
small decline when viewed alongside<br />
the company’s 2009 industrial<br />
equipment sales, which were<br />
expected to fall by more than 40<br />
percent from year-earlier levels.<br />
Deere remained pr<strong>of</strong>itable, however,<br />
mainly due to cost-cutting efforts.<br />
Smithfield, a large integrated pork<br />
producer and processor, experienced<br />
losses in 2009 as a result <strong>of</strong> an oversupply<br />
<strong>of</strong> hogs, weak export demand<br />
for pork and a debt-laden balance<br />
sheet. U.S. hog supply reductions<br />
and strengthening export demand<br />
for pork, especially from China, are<br />
expected to improve Smithfield’s<br />
pr<strong>of</strong>it picture in late <strong>2010</strong> or 2011.<br />
Pilgrim’s Pride, a Texas-based<br />
broiler processor, entered bankruptcy<br />
in 2008 but was scheduled to<br />
emerge from bankruptcy late in<br />
2009 after being acquired by giant<br />
Brazilian meat processor, JBS. The<br />
Pilgrim’s Pride acquisition and other<br />
acquisitions are expected to make<br />
JBS the world’s largest meat<br />
processor, surpassing U.S-based<br />
Tyson’s Foods.<br />
U.S.-based multinational conglomerates<br />
Cargill and Archer Daniels<br />
Midland (ADM) reported weak<br />
international sales in early 2009.<br />
Cargill reported lower earnings in<br />
fertilizer while ADM reported weak<br />
global food and animal feed sales.<br />
Both firms anticipated strengthening<br />
foreign sales for their products.<br />
U.S. ethanol producers continued to<br />
struggle in 2009 as weak demand<br />
for motor fuels depressed prices and<br />
margins. Early in the fourth quarter<br />
<strong>of</strong> 2009, processors’ margins<br />
increased when energy prices<br />
advanced. However, excess capacity<br />
in the ethanol industry will continue<br />
to weigh on processing margins.<br />
What Do the Tailwinds, Headwinds,<br />
and Trade Portend?<br />
Indications are that a sustainable<br />
U.S. recovery will emerge, which<br />
will modestly increase the demand<br />
for a host <strong>of</strong> agricultural and nonagricultural<br />
products in <strong>2010</strong>. But<br />
weak consumer demand—traceable<br />
mainly to high unemployment—will<br />
impede the return <strong>of</strong> robust economic<br />
growth. Increases in U.S.<br />
agricultural and non-agricultural<br />
exports will help trade-dependent<br />
sectors recover in <strong>2010</strong>. However,<br />
the aggregate benefits from<br />
expanded exports and a lower trade<br />
deficit should not be overestimated.<br />
Mistakes in fiscal and monetary policy<br />
could, <strong>of</strong> course, short-circuit<br />
the recovery. But U.S. policymakers<br />
are not likely to err on the side <strong>of</strong><br />
under-stimulating the economy. Witness<br />
the willingness <strong>of</strong> the Obama<br />
Administration and Congress to<br />
extend the “cash for clunkers” program,<br />
the home buyer tax credits<br />
and unemployment compensation.<br />
Unused TARP funds also will be<br />
available to bail out faltering, “toobig-to<br />
fail” firms and correct for key<br />
weaknesses in the economy in <strong>2010</strong>.<br />
STATUS OF WISCONSIN AGRICULTURE <strong>2010</strong>—CURRENT OUTLOOK: GENERAL ECONOMY AND AGRICULTURAL TRADE 13
Moreover, other alphabet soup programs<br />
could be extended to provide<br />
additional stimuli.<br />
Problems being encountered by<br />
mortgage lenders Fannie Mae and<br />
Freddie Mac will not prevent those<br />
firms—which are currently in government<br />
receivership—from serving<br />
mortgage markets and limiting<br />
home foreclosures. Fannie and Freddie<br />
have drawing rights on $400 billion<br />
<strong>of</strong> Treasury funds. Only about<br />
$111 billion <strong>of</strong> that total had been<br />
claimed by the end <strong>of</strong> the third quarter<br />
<strong>of</strong> 2009.<br />
The Obama Administration and<br />
Congress also are likely to propose<br />
aggressive steps to reduce unemployment,<br />
including programs to<br />
increase government hiring and tax<br />
Farm Production Inputs<br />
and Services<br />
Bruce Jones (608-265-8508)<br />
Fertilizer and Fuels<br />
Feeding crops will probably be significantly<br />
cheaper in <strong>2010</strong>. Fertilizer<br />
prices are currently well below what<br />
they were a year ago. Nitrogen<br />
prices are down 30–35 percent from<br />
late 2008, while prices for potash<br />
and phosphorous are about half <strong>of</strong><br />
what they were 12 months ago.<br />
Fertilizer prices trended downward<br />
throughout most <strong>of</strong> 2009. Plentiful<br />
supplies <strong>of</strong> cheaper nitrogen were<br />
available, since suppliers anticipated<br />
that farmers’ demands for nitrogen<br />
would be equivalent to what they<br />
were in 2008. The cost to produce<br />
anhydrous ammonia (the principal<br />
nitrogen fertilizer) was lower<br />
because natural gas prices fell dramatically<br />
in the last half <strong>of</strong> 2008.<br />
There’s a bit <strong>of</strong> international<br />
intrigue behind the decline in potash<br />
prices. It was the result <strong>of</strong> a price<br />
war <strong>of</strong> sorts that began in mid-2009,<br />
credits for companies that create<br />
new jobs. It is unclear whether such<br />
measures will be acceptable since<br />
they would require large federal outlays<br />
at a time <strong>of</strong> record deficits.<br />
Finally, Fed Chairman Bernanke is<br />
fully aware <strong>of</strong> problems that arose<br />
when the government failed to do<br />
enough in the 1930s to combat the<br />
Great Depression. This suggests<br />
that, if anything, Bernanke will err<br />
on the side <strong>of</strong> waiting too long to<br />
reduce monetary stimuli, which<br />
could produce higher than anticipated<br />
inflation.<br />
The big challenge for policymakers<br />
will emerge after <strong>2010</strong>, when fiscal<br />
policies must address the problem <strong>of</strong><br />
deficits. C. Fred Bergsten <strong>of</strong> the<br />
Peterson Institute for International<br />
when a Russian potash supplier cut<br />
a deal with the Indian government<br />
that set the price <strong>of</strong> potash about 25<br />
percent below prevailing prices.<br />
This price reduction triggered retaliation<br />
by other suppliers in Russia<br />
and Canada who had previously<br />
been controlling potash supplies in<br />
an attempt to keep prices up. Once<br />
the first price cut was made, all<br />
other suppliers followed suit to prevent<br />
the loss <strong>of</strong> potential sales.<br />
Cheaper fertilizer should make it<br />
considerably less costly for farmers<br />
to raise corn, wheat and other crops.<br />
Experts at the University <strong>of</strong> Illinois<br />
expect per-acre fertilizer costs for<br />
raising corn to drop from around<br />
$175 in 2009 to about $90 in <strong>2010</strong>. 3<br />
The big drop in fertilizer costs<br />
should make it easier for farmers to<br />
earn positive returns from corn and<br />
other crops.<br />
3 For details, see Crop Budgets, <strong>2010</strong> at<br />
www.farmdoc.illinois.edu/manage/<strong>2010</strong>_crop<br />
_budgets.pdf and Crop Budgets, 2009 at<br />
www.farmdoc.illinois.edu/manage/2009_crop<br />
_budgets.pdf.<br />
14 STATUS OF WISCONSIN AGRICULTURE <strong>2010</strong>—CURRENT OUTLOOK: FARM INPUTS AND SERVICES<br />
Economics notes that the $1.4 trillion<br />
U.S. federal deficit for fiscal<br />
2009 was more than three times the<br />
previous record, and that without<br />
corrective measures, the deficits are<br />
likely to remain at about a trillion<br />
dollars annually until 2020 or later.<br />
Such large deficits are not sustainable<br />
and will force difficult decisions<br />
about taxes and spending.<br />
Failure to address the deficits, at a<br />
minimum, will bring higher interest<br />
rates, since buyers <strong>of</strong> U.S. Treasury<br />
securities will require higher returns<br />
to entice them to purchase the larger<br />
quantities <strong>of</strong> securities needed to<br />
finance the bigger deficits and the<br />
national debt. Unsuccessful efforts<br />
to reduce the deficits also could<br />
rekindle inflation and lead to a collapse<br />
<strong>of</strong> the dollar.<br />
Farmers also paid less for fuel in<br />
2009 than in 2008. Gasoline prices<br />
were about 10 percent lower in late<br />
2009 than they were a year earlier,<br />
and diesel fuel prices were down<br />
about 30 percent. This is largely<br />
because <strong>of</strong> lower crude oil prices.<br />
Not all <strong>of</strong> farmers’ energy-related<br />
costs fell in 2009. The price <strong>of</strong> LP<br />
gas was about 60 percent higher in<br />
late 2009 than a year earlier, reflecting<br />
an unexpected increase in<br />
demand. Due to very wet weather<br />
throughout much <strong>of</strong> the Midwest,<br />
farmers were forced to harvest corn<br />
and soybeans at above-normal moisture<br />
levels, so they needed more LP<br />
gas for crop drying. This boost in<br />
demand, coupled with tight supplies,<br />
drove LP prices up dramatically.<br />
The spike in LP prices is unusual in<br />
that it is tied to harvest conditions<br />
rather than higher oil prices. Assuming<br />
normal weather during the <strong>2010</strong><br />
harvest, demands for LP gas to dry<br />
grain should be much lower, so<br />
prices should fall back in line with<br />
those <strong>of</strong> gasoline and diesel fuel.
What farmers pay for fertilizer and<br />
energy is highly correlated with<br />
crude oil prices, and thus highly<br />
dependent on conditions in crude oil<br />
markets. The Department <strong>of</strong> Energy<br />
is currently forecasting stable crude<br />
oil markets in <strong>2010</strong>, with prices at<br />
or slightly higher than 2009 levels.<br />
This reflects the expectation <strong>of</strong> further<br />
recovery in the international<br />
economy, led by growth in the<br />
economies <strong>of</strong> China and other<br />
Asian countries.<br />
Farm Credit Conditions<br />
With U.S. financial markets in disarray,<br />
there was some concern last<br />
year as to whether credit would be<br />
available to farmers. Fortunately, the<br />
financial markets continued to function<br />
and there was no interruption <strong>of</strong><br />
the flow <strong>of</strong> financial capital to rural<br />
areas. Credit was probably not as<br />
plentiful as it might have been had<br />
markets not been in turmoil, but it<br />
was generally available to farmers<br />
who met lenders’ credit underwriting<br />
standards.<br />
Availability <strong>of</strong> credit will not be an<br />
issue for most farmers in <strong>2010</strong>, but<br />
there is concern about how many <strong>of</strong><br />
<strong>Wisconsin</strong>’s creditworthy farm borrowers<br />
will be requesting more<br />
operating credit than normal. This is<br />
due to cash flow problems experienced<br />
by dairy farmers in 2009.<br />
Although most farmers will have<br />
few problems meeting lenders’ collateral<br />
requirements, that isn’t the<br />
only thing that lenders consider<br />
when deciding whether to extend<br />
credit. They also look at a borrower’s<br />
potential cash flow, since<br />
the ability to repay loans and cash<br />
flow go hand in hand. In order to<br />
extend a loan, the lender must be<br />
convinced that the borrower will be<br />
able to generate positive cash flow<br />
in the near term.<br />
Losses stemming from the housing<br />
market collapse in 2008 trickled<br />
through the U.S. financial system.<br />
Lending institutions, particularly<br />
those with the weakest equity posi-<br />
tions, have to be more conservative<br />
in granting loans because they cannot<br />
afford more losses. Their reluctance<br />
could result in a decrease in<br />
the supply <strong>of</strong> credit to farmers.<br />
Private lenders will be particularly<br />
eager to limit their exposures to<br />
losses on farm loans. They will<br />
probably be seeking loan guarantees<br />
from the Farm Service Agency<br />
(FSA) on their riskier loans. While<br />
this will help keep credit flowing to<br />
high-risk farmer borrowers, these<br />
guarantees are generally distributed<br />
on a “first come, first served” basis,<br />
and there is a limit to the total<br />
amount <strong>of</strong> guarantees FSA can<br />
grant. Once that limit is reached,<br />
Index*<br />
Index*<br />
120<br />
100<br />
80<br />
60<br />
40<br />
U.S Fertilizer Price Indices<br />
Potash and Phosphate<br />
farmers who are most in need <strong>of</strong><br />
credit assistance may not get it.<br />
Interest rates for farm loans will<br />
remain low as long as the Federal<br />
Reserve Bank (“the Fed”) continues<br />
its cheap-money policies in order to<br />
stimulate the economy. The Fed’s<br />
Board <strong>of</strong> Governors has kept the<br />
Fed Funds Rate (the interest charged<br />
between banks for reserves) near<br />
zero for nearly a year. These policies<br />
kept interest rates low throughout<br />
most <strong>of</strong> 2009, and the Fed seems<br />
willing to continue them in the<br />
near term.<br />
We aren’t likely to see a dramatic<br />
increase in interest rates in <strong>2010</strong>, but<br />
the Fed will have to let rates rise in<br />
Nitrogen<br />
20<br />
*July-September 2008 = 100<br />
Source: NASS, USDA<br />
0<br />
Sep 08 Nov 08 Jan 09 Mar 09 May 09 Jul 09 Sep 09 Nov 09<br />
120<br />
100<br />
80<br />
60<br />
40<br />
20<br />
0<br />
U.S Fuel Price Indices<br />
Gasoline<br />
*July-September 2008 = 100<br />
Source: NASS, USDA<br />
Sep 08 Nov 08 Jan 09 Mar 09 May 09 Jul 09 Sep 09 Nov 09<br />
STATUS OF WISCONSIN AGRICULTURE <strong>2010</strong>—CURRENT OUTLOOK: FARM INPUTS AND SERVICES 15<br />
LP Gas
<strong>Agricultural</strong> Interest Rates<br />
Operating Farm Real<br />
Period Loans Estate Loans<br />
Percent at end <strong>of</strong> period:<br />
Q1-2006 8.30 7.48<br />
Q2-2006 8.76 7.85<br />
Q3-2006 8.73 7.82<br />
Q4-2006 8.71 7.74<br />
Q1-2007 8.61 7.67<br />
Q2-2007 8.65 7.70<br />
Q3-2007 8.42 7.53<br />
Q4-2007 7.82 7.09<br />
Q1-2008 6.74 6.41<br />
Q2-2008 7.06 6.51<br />
Q3-2008 6.74 6.56<br />
Q4-2008 6.21 6.23<br />
Q1-2009 6.20 6.14<br />
Q2-2009 6.18 6.16<br />
Source: Ag Letters, Federal Reserve<br />
Bank <strong>of</strong> Chicago<br />
order to keep inflation in check and<br />
to ensure that foreign investors,<br />
especially the Chinese, remain willing<br />
to purchase the U.S. Treasury<br />
issues used to finance federal budget<br />
deficits. Any increase in interest<br />
rates will need to be gradual and<br />
steady to avoid choking <strong>of</strong>f economic<br />
recovery. As the economy<br />
starts showing signs <strong>of</strong> strength,<br />
interest rates will likely be ratcheted<br />
up to protect against demand-pull<br />
inflation, where prices are driven up<br />
as plentiful supplies <strong>of</strong> money chase<br />
limited goods and services.<br />
Farmland Rents<br />
<strong>Wisconsin</strong> cropland rents rose in<br />
2009, but not as dramatically as in<br />
2008. Average rents increased about<br />
5 percent, from $85 per acre in 2008<br />
to $89 per acre in 2009. <strong>Wisconsin</strong>’s<br />
increase in cropland rents was larger<br />
than Michigan’s but less than those<br />
in Illinois, Iowa and Minnesota.<br />
It is not surprising that cropland<br />
rents have been on the rise. Since<br />
corn, soybean, and wheat prices<br />
State 2002 2003 2004 2005 2006 2007 2008 2009<br />
<strong>Wisconsin</strong> 67 68 70 70 71 72 85 89<br />
Illinois 122 123 126 129 132 141 160 170<br />
Iowa 120 122 126 131 133 140 165 180<br />
Michigan 60 60 62 62 65 73 80 83<br />
Minnesota 81 82 83.5 86.5 88 94 109 116<br />
Source: NASS, USDA<br />
have nearly doubled in recent years,<br />
growing these crops on rented land<br />
has become more pr<strong>of</strong>itable.<br />
Between 2006 and 2009, cash rents<br />
in <strong>Wisconsin</strong> rose about 25 percent.<br />
During the same period they rose<br />
even more in Iowa (35 percent),<br />
Minnesota (32 percent), Illinois<br />
(29 percent) and Michigan (28 percent).<br />
These robust rates <strong>of</strong> growth<br />
in rents correspond to the big gains<br />
in crop prices.<br />
Rents aren’t likely to keep increasing<br />
at this pace, since commodity<br />
prices have leveled <strong>of</strong>f. Crop prices<br />
will hold constant at best and could<br />
decrease slightly. Lower crop prices<br />
would discourage farmers from<br />
competing for cropland.<br />
While rents are up dramatically,<br />
renting land appears to be a less<br />
expensive strategy than purchasing<br />
land and paying interest on a mortgage.<br />
Cash rents for <strong>Wisconsin</strong><br />
0.60<br />
0.50<br />
0.40<br />
0.30<br />
0.20<br />
0.10<br />
0.00<br />
Cropland Rented for Cash:<br />
Average Cash Rent per Acre by State, 2002-2009<br />
cropland generally have not risen as<br />
much as interest payments on fully<br />
financed land purchases at prevailing<br />
interest rates (as reported by the<br />
Chicago Federal Reserve bank. The<br />
ratio <strong>of</strong> cash rents to mortgage interest<br />
expense fell from around 0.6 in<br />
the late 1990s to 0.40 or lower in<br />
recent years, meaning that it has<br />
become relatively less expensive to<br />
rent land rather than buy it.<br />
Low cash rents relative to mortgage<br />
interest payments could be a signal<br />
that cash rents are set to move<br />
higher despite lower returns from<br />
growing crops. Rents could also<br />
move upward if interest rates rise.<br />
Any increase in the cost <strong>of</strong> owning<br />
land will likely stimulate more competition<br />
in the land rental market.<br />
Since interest rates are currently<br />
quite low, it’s quite likely that they<br />
will increase, causing the cost <strong>of</strong><br />
owning land to increase as well.<br />
<strong>Wisconsin</strong> Cropland: Ratio <strong>of</strong> Cash Rent to Mortgage Interest<br />
1997 1999 2001 2003 2005 2007 2009<br />
16 STATUS OF WISCONSIN AGRICULTURE <strong>2010</strong>—CURRENT OUTLOOK:FARM INPUTS AND SERVICES
Dairy<br />
Bob Cropp (262-9483)<br />
Review <strong>of</strong> 2009<br />
<strong>Wisconsin</strong> dairy farmers had more<br />
financial stress in 2009 than in any<br />
year since the early 1970’s. Fortunately,<br />
milk prices were strong going<br />
into 2009—highest on record in 2007<br />
and second highest in 2008. But<br />
those years also brought high prices<br />
for feed and energy, which kept<br />
returns over operating costs modest.<br />
Feed and energy prices dropped<br />
some during 2009, but milk prices<br />
plunged. The <strong>Wisconsin</strong> All-Milk<br />
Price fell as much as $9.10 per hundredweight<br />
below year-earlier levels<br />
and averaged $6.82 lower January<br />
through October. Returns over feed<br />
costs reached a low <strong>of</strong> $1.71 per<br />
hundredweight for February 2009<br />
and averaged just $2.53 Januarythrough-October.<br />
Returns over feed<br />
costs had averaged $9.22 per hundredweight<br />
during 2008.<br />
This wasn’t the decade’s only bad<br />
stretch for dairy farmers—there were<br />
major price declines in 2000, 2002<br />
and 2006—but this one was different.<br />
Each <strong>of</strong> the earlier price drops<br />
were due to a relatively large<br />
increase in U.S. milk production.<br />
The 2009 plunge in milk prices was<br />
caused by a fall in demand. Production<br />
in 2009 increased just 0.4 percent<br />
for the first six months, was flat<br />
in July and fell below year-ago levels<br />
in August (0.1 percent), September<br />
(0.6 percent) , October (1.1 percent)<br />
and November (1.0 percent). At the<br />
same time, however, the downturn<br />
that began in 2008 curbed the growth<br />
in domestic dairy sales and reduced<br />
U.S. dairy exports.<br />
Domestic dairy sales grew just 0.4<br />
percent in 2008 due to very high<br />
retail prices. 4 USDA forecasts<br />
improvement for 2009, with growth<br />
4 The milk equivalent <strong>of</strong> domestic use and<br />
exports <strong>of</strong> dairy products are expressed here as a<br />
weighted average <strong>of</strong> reported sales on a fat basis<br />
(40 percent) and skim-solids basis (60 percent).<br />
<strong>of</strong> 2 percent. But the economic<br />
downturn has also brought a shift in<br />
eating habits. Consumers are eating<br />
out less, which has brought a shift in<br />
the composition <strong>of</strong> domestic dairy<br />
product consumption. This shift<br />
improved beverage milk sales in<br />
2009, but slowed sales <strong>of</strong> butter and<br />
cheese, particularly mozzarella, both<br />
<strong>of</strong> which are consumed mostly in<br />
restaurants. From January through<br />
October, beverage milk sales were up<br />
1.2 percent from the same period in<br />
2008. Domestic sales <strong>of</strong> cheese, butter<br />
and cream products were also<br />
expected to show relatively good<br />
increases during the October to<br />
Dollars Per Hundredweight<br />
Dollars per Hundredwieght<br />
$22<br />
$20<br />
$18<br />
$16<br />
$14<br />
$12<br />
$10<br />
$14<br />
$12<br />
$10<br />
$8<br />
$6<br />
$4<br />
$2<br />
$0<br />
Jan<br />
2007<br />
2008<br />
<strong>Wisconsin</strong> All-Milk Price (NASS, USDA)<br />
less Estimated Feed Costs (ERS, USDA)<br />
Mar<br />
2008<br />
2009<br />
May<br />
<strong>Wisconsin</strong> All-Milk Price<br />
Jul<br />
Sep<br />
Nov<br />
December period, thanks to lower<br />
wholesale and retail prices along<br />
with store specials.<br />
Farm milk prices took a bigger hit<br />
from the loss in U.S. dairy exports<br />
than from changes in domestic sales.<br />
U.S. dairy exports had climbed 9.4<br />
percent in 2007 and 14.5 percent in<br />
2008, countering anemic gains in<br />
domestic use. Those exports represented<br />
9.2 percent <strong>of</strong> U.S. milk production<br />
in 2007 and 10.8 percent in<br />
2008. But exports began to decline<br />
during the last half <strong>of</strong> 2008. Exports<br />
in the first half <strong>of</strong> 2009 were half <strong>of</strong><br />
what they were during the first half<br />
Jan Feb Mar Apr May Jun Jul Aug Sept Oct Nov Dec<br />
<strong>Wisconsin</strong> Dairy Returns over Feed Costs<br />
STATUS OF WISCONSIN AGRICULTURE <strong>2010</strong>—CURRENT OUTLOOK: DAIRY 17<br />
Jan<br />
Mar<br />
May<br />
Source: NASS, USDA<br />
2009<br />
Jul<br />
Sep<br />
Nov
U.S. Dairy Exports, October and Year-to-date, 2009 vs. 2008<br />
Dairy Product October January-October<br />
Million Lbs. % Change Million Lbs. % Change<br />
Nonfat dry milk 64.5 +19 473.0 -40<br />
Cheese 20.3 -5 191.0 -24<br />
Butter 8.8 -40 39.0 -79<br />
Dry whey 47.0 +13 394.8 -1<br />
Whey protein concentrates 27.2 +33 163.8 +13<br />
Lactose 43.4 +35 403.2 +17<br />
Source: USDA, FAS<br />
<strong>of</strong> 2008 on a volume basis and even<br />
less on a value basis.<br />
A look at dairy exports for October<br />
2009 indicates some strengthening.<br />
Nonfat dry milk exports for October<br />
were 19 percent higher than 2008,<br />
but year-to-date exports were 40<br />
percent lower. Dry whey exports<br />
were 13 percent higher than a year<br />
ago, and exports <strong>of</strong> whey protein<br />
concentrates were 33 percent higher<br />
in October and 13 percent higher<br />
year-to-date. Lactose exports were<br />
33 percent higher in October and 17<br />
percent higher year-to-date.<br />
USDA expects exports for 2009 to<br />
be just under 15 billion pounds milk<br />
equivalent, about three-fourths <strong>of</strong><br />
what they were in 2008, and equal<br />
to about 8 percent <strong>of</strong> projected 2009<br />
U.S. milk production.<br />
On a dollar basis, exports for the<br />
first nine months totaled $1.605 billion,<br />
48 percent less than during the<br />
first nine months <strong>of</strong> 2008. For the<br />
year, exports will exceed $2 billion,<br />
the third highest on record. Nevertheless,<br />
the loss <strong>of</strong> export volume<br />
in 2009 was equivalent to about 5<br />
billion pounds <strong>of</strong> milk. This meant<br />
that compared to 2008, about 3 percent<br />
more milk had to clear domestic<br />
markets.<br />
U.S. dairy imports are <strong>of</strong>ten blamed<br />
for lower milk prices, but in 2009<br />
imports were lower than a year ago.<br />
For the first nine months <strong>of</strong> the year,<br />
imports totaled $1.581 billion, down<br />
18 percent, netting a small dairy<br />
trade surplus <strong>of</strong> $23.6 million. On a<br />
volume basis, during the first nine<br />
months <strong>of</strong> 2009 the United States<br />
imported 15 percent less cheese, 23<br />
percent less casein, 53 percent less<br />
caseinates, and 8 percent less milk<br />
protein for food use than in the same<br />
period for 2008.<br />
With the slowdown in domestic<br />
sales and the loss <strong>of</strong> dairy exports, a<br />
recovery <strong>of</strong> farm milk prices in 2009<br />
required a reduction in milk production,<br />
which in turn required fewer<br />
milk cows. But higher milk prices<br />
during 2007 and most <strong>of</strong> 2008 had<br />
spurred dairy producers to add<br />
cows. U.S. milk cow numbers<br />
increased every month from May<br />
2007 through January <strong>of</strong> 2009. The<br />
January 1, 2009 USDA livestock<br />
inventory report showed that milk<br />
cows were up 1 percent, to 9.33 million<br />
milk cows, from a year earlier.<br />
The same report shows that numbers<br />
<strong>of</strong> replacement heifers had dropped<br />
9,400<br />
9,300<br />
9,200<br />
9,100<br />
9,000<br />
Source: NASS, USDA<br />
December 09 is author’s estimate<br />
18 STATUS OF WISCONSIN AGRICULTURE <strong>2010</strong>—CURRENT OUTLOOK: DAIRY<br />
1,000 Head<br />
Jan. 07<br />
Apr. 07<br />
U.S. Milk Cows: 2007-2009<br />
Jul. 07<br />
Oct. 07<br />
Jan. 08<br />
less than 1 percent to 4.41million<br />
head. That represents 48.3 heifers<br />
for every 100 milk cows, more than<br />
enough to expand the U.S. dairy herd.<br />
Low milk prices and poor returns<br />
over feed cost encouraged dairy producers<br />
to slaughter more cows during<br />
the last half <strong>of</strong> 2008 and<br />
throughout 2009. In addition, three<br />
rounds <strong>of</strong> the National Milk Producers<br />
Federation CWT herd retirement<br />
program removed about 250,000<br />
cows from the U.S. herd during<br />
2009. As <strong>of</strong> November 2009, the<br />
number <strong>of</strong> milk cows had declined<br />
to 9.091 million, 2.6 percent fewer<br />
than a year earlier. Cow numbers<br />
will continue to decline, with the<br />
number <strong>of</strong> cows for the year averaging<br />
around 9.20 million head, down<br />
1.2 percent from the 2008 average.<br />
Poor returns over feed costs also<br />
slowed the increase in milk production.<br />
While milk production per cow<br />
had increased an average <strong>of</strong> 1.8 percent<br />
over the previous 10 years, it<br />
increased by just 0.7 percent over<br />
year-earlier levels from January<br />
through June and by 1.6 percent<br />
from July through October. The estimate<br />
for 2009 is an average <strong>of</strong> 20,<br />
565 pounds, an increase <strong>of</strong> 0.8 percent.<br />
With 1.2 percent fewer cows<br />
for the year and an average <strong>of</strong> 0.8<br />
percent more milk per cow, total<br />
milk production for the year is esti-<br />
Apr. 08<br />
Jul. 08<br />
Oct. 08<br />
Jan. 09<br />
Apr. 09<br />
Jul. 09<br />
Oct. 09
mated at 189.2 billion pounds, down<br />
0.4 percent from 2008.<br />
Most <strong>of</strong> that drop in milk production<br />
happened out west, where dairy producers<br />
have experienced more financial<br />
stress because they received<br />
lower farm milk prices and paid<br />
higher prices for feed. California, the<br />
top dairy state produced around 39.5<br />
billion pounds <strong>of</strong> milk in 2009, about<br />
4 percent less and its lowest production<br />
since 2006. In Idaho, the<br />
nation’s third largest milk-producing<br />
state, production could drop 1.7 percent<br />
to 12.1 billion pounds. In contrast,<br />
<strong>Wisconsin</strong> continues to produce<br />
more milk. For the year, it is estimated<br />
that the state’s milk cow numbers<br />
will average 1.257 million head,<br />
up 0.4 percent from 2008. Milk production<br />
per cow in <strong>Wisconsin</strong> is estimated<br />
at 20,016 pounds, up 2.4<br />
percent. This will put <strong>Wisconsin</strong>’s<br />
total milk production at 25.2 billion<br />
pounds, an increase <strong>of</strong> 2.9 percent<br />
over 2008 and surpassing the previous<br />
record high <strong>of</strong> 25 billion pounds<br />
set back in 1988.<br />
The combination <strong>of</strong> s<strong>of</strong>t domestic<br />
milk sales, the loss <strong>of</strong> dairy exports<br />
and continued increases in milk production<br />
kept dairy product stocks<br />
more than ample to meet current<br />
demands. November 30 stocks <strong>of</strong><br />
butter were 18.5 percent higher than<br />
a year earlier, while American cheese<br />
stocks were up 10.6 percent and total<br />
cheese stocks were up 17.4 percent.<br />
Nonfat dry milk prices were near or<br />
below the CCC support price <strong>of</strong><br />
$0.80 per pound for the first seven<br />
months <strong>of</strong> 2009. CCC purchased surplus<br />
nonfat dry milk weekly until<br />
mid-August, when prices began to<br />
strengthen. Government stocks <strong>of</strong><br />
nonfat dry milk peaked at 247.1 million<br />
pounds on July 31 but fell to<br />
200.9 million pounds on October 31.<br />
The recent slowdown in milk production<br />
is reflected in reduced production<br />
<strong>of</strong> nonfat dry milk, which<br />
was down 6.4 percent January<br />
through September compared to a<br />
year ago. Non-government stocks <strong>of</strong><br />
nonfat dry milk stood at 121.7 million<br />
pounds on September 30, 14.2<br />
percent below a year ago, thanks to<br />
lower production and some improvement<br />
in domestic sales and exports.<br />
Reported production <strong>of</strong> dry whey<br />
through September was 3.1 percent<br />
lower. This drop in production along<br />
with improved domestic sales<br />
reduced dry whey stocks 25.4 percent<br />
below a year ago.<br />
Although stocks <strong>of</strong> dairy products<br />
were ample to excessive, dairy product<br />
prices strengthened significantly<br />
in October and November due to<br />
improvement in domestic and foreign<br />
sales and falling milk production.<br />
CME 40-pound cheddar blocks<br />
had averaged less than $1.15 per<br />
pound in May and June, but<br />
improved to $1.72 in early December<br />
before fallling back to $1.45 by<br />
year’s end. CME butter prices averaged<br />
$1.20 per pound in August but<br />
were up to $1.52 in November and<br />
back down to $1.33 by year’s end.<br />
Western nonfat dry milk prices were<br />
under $0.85 per pound January<br />
through July, but averaged $1.34 in<br />
December. Western dry whey sold<br />
for as little as $0.15 per pound in<br />
January and February but averaged<br />
$0.3950 in December.<br />
These higher dairy product prices<br />
greatly improved farm milk prices<br />
$/Lb.<br />
1.60<br />
1.40<br />
1.20<br />
1.00<br />
0.80<br />
0.60<br />
0.40<br />
0.20<br />
0<br />
y ,<br />
Dairy Product Prices, 2009<br />
CME 40 lb. Cheddar blocks<br />
CME butter<br />
West nonfat dry milk<br />
West dry whey<br />
Stocks <strong>of</strong> Dairy Products on<br />
November 30: 2009 vs. 2008<br />
Million % Change<br />
Product Pounds from 2008<br />
Butter 142.2 +18.5%<br />
American cheese 582.7 +10.6%<br />
Total cheese 961.4 +17.4%<br />
Nonfat dry milk<br />
(Manufacturers’ 90.1 -38.3%<br />
stocks)<br />
Dry whey 45.6 -27.6%<br />
Source: USDA, NASS. Note: Nonfat dry<br />
milk and dry whey stocks are as <strong>of</strong> October<br />
31. Nonfat dry milk stocks do not include<br />
CCC inventory.<br />
late in 2009. The Class III price was<br />
up to $12.82 per hundredweight in<br />
October and $14.08 in November<br />
compared to $9.97 in June and July.<br />
The average December Class III<br />
price is estimated at $14.80. If so, the<br />
Class III price will average $11.35<br />
for the year—$6.09 below the 2008<br />
average <strong>of</strong> $17.44.<br />
The Class IV price hit its yearly low<br />
<strong>of</strong> $9.45 per hundredweight in February.<br />
It climbed to $11.86 in October<br />
and $13.25 in November and is<br />
estimated at $14.50 for December,<br />
for a 2009 average <strong>of</strong> $10.85, $3.80<br />
lower than 2008. The <strong>Wisconsin</strong> Allmilk<br />
price hit its low <strong>of</strong> $11.40 per<br />
hundredweight in June and July and<br />
Jan Feb Mar Apr May Jun Jul Aug Sept Oct Nov Dec<br />
STATUS OF WISCONSIN AGRICULTURE <strong>2010</strong>—CURRENT OUTLOOK: DAIRY 19
Dollars per Hundredweight<br />
$16.00<br />
$15.00<br />
$14.00<br />
$13.00<br />
$12.00<br />
$11.00<br />
$10.00<br />
$ 9.00<br />
increased to $16.60 by December.<br />
The average for the year was<br />
$13.07, down $5.86 from 2008.<br />
In addition to market prices, dairy<br />
producers received MILC payments<br />
on eligible milk. MILC payments<br />
were triggered in February <strong>of</strong> 2009,<br />
reached a high <strong>of</strong> $2.0056 per hundredweight<br />
in March and declined<br />
to $0.35 in November. There were<br />
with no payments in December.<br />
MILC payments on eligible milk<br />
over the 12 months <strong>of</strong> 2009 averaged<br />
$1.51 per hundredweight.<br />
Outlook for <strong>2010</strong><br />
Class III, Class IV and <strong>Wisconsin</strong> All-Milk Price, 2009<br />
Class III<br />
Class IV<br />
All-Milk<br />
Jan Feb Mar Apr May Jun Jul Aug Sept Oct Nov Dec*<br />
Farm milk prices will continue to<br />
strengthen in <strong>2010</strong> and average<br />
much higher than in 2009, driven by<br />
a continued decline in cow numbers<br />
and milk production, improved<br />
domestic sales <strong>of</strong> milk and dairy<br />
products, and growth in dairy<br />
exports. The strength <strong>of</strong> these forces<br />
will determine how much milk prices<br />
increase as the year progresses.<br />
Milk cow numbers are likely to<br />
decline at least through the first<br />
three quarters <strong>of</strong> the year. The low<br />
milk prices experienced during 2009<br />
eroded equity on many dairy farms,<br />
and it will take several months <strong>of</strong><br />
improved milk prices—perhaps into<br />
2011—to restore these losses. In the<br />
meantime, financial institutions will<br />
be leery <strong>of</strong> lending money for dairy<br />
Source: NASS, USDA<br />
*December 09 is author’s estimate<br />
expansions and startups. Dairy cow<br />
slaughter will remain relatively high<br />
until returns over feed cost become<br />
much more favorable, at least<br />
through the first six months <strong>of</strong> <strong>2010</strong>.<br />
And the number <strong>of</strong> producers leaving<br />
the business is likely to be<br />
higher during the winter and early<br />
spring <strong>of</strong> <strong>2010</strong>. Milk cows are<br />
expected to average 8.976 million<br />
head in <strong>2010</strong>, down 2.4 percent<br />
from the estimated 2009 average.<br />
While milk prices will continue to<br />
improve, relatively high feed costs<br />
may keep returns over feed costs<br />
unfavorable through the end <strong>of</strong> the<br />
second quarter and possibly into the<br />
third quarter, particularly in the<br />
Western states. In December 2009,<br />
corn futures were near $4 per bushel<br />
for all <strong>2010</strong> contracts. Soybean meal<br />
may average a little lower in <strong>2010</strong>.<br />
In December 2009, soybean meal<br />
futures were at or slightly below<br />
$300 per ton for all <strong>2010</strong> contracts.<br />
Forages could average lower in<br />
<strong>2010</strong>. October 2009 alfalfa hay<br />
prices were down as much as 50<br />
percent in California and Idaho,<br />
25 percent in New Mexico, 9 percent<br />
in New York and 13 percent<br />
in <strong>Wisconsin</strong>.<br />
The combination <strong>of</strong> unfavorable<br />
returns over feed costs early in the<br />
year and the financial stress could<br />
also cause some producers to buy<br />
less grain and concentrates, which<br />
may limit increases in milk per cow.<br />
Partially <strong>of</strong>fsetting these factors is<br />
the replacement <strong>of</strong> lower-producing<br />
cows with higher-producing heifers.<br />
Average milk per cow in <strong>2010</strong> is<br />
estimated to increase 1.8 percent to<br />
20,935 pounds.<br />
With an average <strong>of</strong> 2.4 percent<br />
fewer milk cows producing 1.8 percent<br />
more milk per cow, <strong>2010</strong> milk<br />
production would total 187.9 billion<br />
pounds, 0.7 percent less than 2009.<br />
USDA’s December 2009 milk supply<br />
and demand estimates also has<br />
<strong>2010</strong> total milk production at 187.9<br />
billion pounds.<br />
The very slow economic recovery<br />
in <strong>2010</strong> will probably continue to<br />
slow the growth <strong>of</strong> domestic sales<br />
<strong>of</strong> milk and dairy products. USDA’s<br />
November forecasts show very<br />
limited growth in domestic milk<br />
sales—only 0.3 percent for the year.<br />
This adds up to an increase <strong>of</strong> about<br />
450,000 pounds <strong>of</strong> milk. But there<br />
are indicators that domestic sales<br />
Milk Cow Numbers, Milk per Cow and Total Milk Production, U.S.<br />
2008-<strong>2010</strong><br />
2009 Estimate <strong>2010</strong> Forecast<br />
2008 Actual Number %Change Number %Change<br />
Milk cows<br />
(1,000 head) 9,315 9,200 -1.2 8,976 -2.4<br />
Milk per cow<br />
(pounds) 20,396 20,565 +0.8 20,935 +1.8<br />
Total milk<br />
production<br />
(billion pounds) 190.0 189.2 -0.4 187.9 -0.7<br />
Source: 2008—USDA, NASS; 2009 and <strong>2010</strong>—author’s estimate<br />
20 STATUS OF WISCONSIN AGRICULTURE <strong>2010</strong>—CURRENT OUTLOOK: DAIRY
may do better. As <strong>of</strong> October 2009,<br />
retail prices <strong>of</strong> all dairy products<br />
were 8.2 percent lower than a year<br />
ago. With increases in farm milk<br />
prices and dairy product prices,<br />
we can expect retail prices to also<br />
increase. On the other hand, near the<br />
end <strong>of</strong> 2009, retailers were <strong>of</strong>fering<br />
more specials on beverage milk,<br />
cheese and butter to attract shoppers,<br />
and this practice could continue<br />
well in <strong>2010</strong>. Beverage milk,<br />
butter and cheese prices will likely<br />
continue to be a good value to consumers<br />
in <strong>2010</strong>. Butter and cheese<br />
sales through restaurants may also<br />
do better in <strong>2010</strong>. For example,<br />
major pizza chains are launching<br />
new pizzas topped with more cheese<br />
in order to entice consumers to eat<br />
more pizza. Other types <strong>of</strong> restaurants<br />
may use more cheese in their<br />
recipes as well.<br />
The faster-than-predicted improvement<br />
in world economies bodes well<br />
for dairy exports. Moreover, milk<br />
production by two major competitors,<br />
New Zealand and Australia, is<br />
increasing less than predicted,<br />
which will slow the growth in their<br />
exports. A drop in milk production<br />
in most European countries has significantly<br />
reduced their surpluses <strong>of</strong><br />
dairy products. As a result, the EU<br />
has suspended all dairy export subsidies.<br />
World prices <strong>of</strong> cheese, butter,<br />
nonfat dry milk and dry whey all<br />
increased substantially during the<br />
last half <strong>of</strong> 2009 and are currently<br />
well above U.S prices. USDA forecasts<br />
that, on a total solids basis,<br />
<strong>2010</strong> dairy exports may be equivalent<br />
to nearly 9 percent <strong>of</strong> total milk<br />
production. Just as the loss <strong>of</strong><br />
exports was a major factor in reducing<br />
milk prices in 2009, export<br />
growth may be a key factor for<br />
improving them in <strong>2010</strong>.<br />
Increased domestic sales and dairy<br />
exports could boost <strong>2010</strong> sales <strong>of</strong><br />
milk by nearly 3 billion pounds.<br />
This would increase commercial<br />
disappearance over that <strong>of</strong> 2009 by<br />
about 1.5 percent.<br />
Quarter Product<br />
Cheddar Cheese Nonfat Dry<br />
(40-lb.block) Butter Milk Dry Whey<br />
Dollars per Pound<br />
Jan–Mar. $1.58 - $1.62 $1.37 - $1.39 $1.15 - $1.17 $0.35 - $0.36<br />
Apr.–June $1.65 - $1.70 $1.40 - $1.45 $1.17 $0.36<br />
July–Sept. $1.72- $1.78 $1.45 - $1.52 $1.18 $0.35<br />
Oct.–Dec. $1.79 - $1.84 $1.54 - $1.58 $1.15 - $1.17 $0.32 - $0.34<br />
Source: Author’s estimates.<br />
This projected milk supply and<br />
demand situation will strengthen<br />
dairy product prices and farm-level<br />
milk prices in <strong>2010</strong>. CME 40-pound<br />
Cheddar block cheese prices should<br />
increase throughout the year, from<br />
around $1.58–$1.62 per pound in<br />
the first quarter to $1.79–$1.84 in<br />
the fourth quarter. CME butter<br />
prices may decline to $1.37–$1.39<br />
per pound in the first quarter, then<br />
climb steadily to $1.54–$1.58 in the<br />
fourth quarter. Nonfat dry milk<br />
prices may remain fairly stable at<br />
the $1.15–$1.18 per pound range all<br />
year. But since less nonfat dry milk<br />
will be produced, prices may well<br />
end up higher than this if exports<br />
improve as forecast. Anticipated<br />
increases in exports will also support<br />
dry whey prices, keeping them<br />
in the $0.32–$0.36 per pound range,<br />
or even a bit higher, through <strong>2010</strong>.<br />
If these higher dairy product prices<br />
materialize, farm-level milk prices<br />
will also improve substantially. The<br />
Class III price is expected to be<br />
around $14.70–$15.20 per hundredweight<br />
during the first quarter and<br />
improve to $16.75 to $17.15 in the<br />
fourth quarter. The Class IV price<br />
should go from $13.55–$13.80 in<br />
the first quarter to $14.30–$14.45 in<br />
the fourth. The <strong>Wisconsin</strong> All Milk<br />
price range is forecast to climb from<br />
$16.20 to $16.65 in the first quarter<br />
to $18.20–$18.65 the fourth.<br />
In summary, average price forecasts<br />
for <strong>2010</strong> are as follows:<br />
• Class III—$15.95 per hundredweight,<br />
up $4.60 from 2009<br />
• Class IV—$14.05 per hundredweight,<br />
up $3.25<br />
• <strong>Wisconsin</strong> All-Milk price—<br />
$17.50, up $4.43.<br />
These estimates are based on the<br />
increases in domestic sales and<br />
exports and the decline in milk production<br />
predicted above. Any deviations<br />
from these forecasts could<br />
change dairy product and milk<br />
prices considerably. Forecasts will<br />
no doubt change as new market<br />
information becomes available in<br />
<strong>2010</strong>. Dairy producers must keep<br />
abreast <strong>of</strong> market developments and<br />
attempt to manage the risk <strong>of</strong> changing<br />
milk prices.<br />
Projected <strong>2010</strong> Class III, Class IV, and <strong>Wisconsin</strong> All-Milk Prices<br />
Quarter Class III Price Class IV Price<br />
Dollars per Hundredweight<br />
All-Milk Price<br />
Jan–Mar. $14.70 to $15.20 $13.55 to $13.80 $16.20 to $16.65<br />
Apr.–June $15.45 to $15.95 $13.85 to $14.05 $16.95 to $17.45<br />
July-–Sept $16.15 to $16.70 $14.15 to $14.45 $17.65 to $18.10<br />
Oct.–Dec. $16.75 to $17.15 $14.30 to $14.45 $18.20 to $18.65<br />
Source: Author’s estimates.<br />
Projected <strong>2010</strong> Dairy Product Prices<br />
STATUS OF WISCONSIN AGRICULTURE <strong>2010</strong>—CURRENT OUTLOOK: DAIRY 21
Livestock and Poultry<br />
Patrick Luby (608) 262-6974<br />
Brenda Boetel* (715) 425-3176<br />
2009 in Review<br />
Meat consumption in the United<br />
States fell in 2009 to an estimated<br />
211 pounds per capita. This is the<br />
lowest since 1997 and about 5 percent<br />
below the record high <strong>of</strong> 221.6<br />
pounds set in 2007. The current<br />
two-year decline in meat consumption<br />
involves all four major meats.<br />
Consumption <strong>of</strong> red meat and poultry<br />
per capita in 2009 declined<br />
2.1 percent (4.5 lbs) from the<br />
previous year.<br />
For the first time in many years,<br />
exports <strong>of</strong> all four major meats may<br />
have declined in 2009. However, in<br />
each case, the declines were fairly<br />
modest, especially considering that<br />
they came in the face <strong>of</strong> a worldwide<br />
recession and followed a very<br />
strong export market in 2008.<br />
The byproduct market also declined.<br />
The international market drives the<br />
byproduct value for cattle. In 2008,<br />
high oil and feedstuff prices drove<br />
byproduct values to record highs <strong>of</strong><br />
nearly $12.00 per hundredweight on<br />
a live steer basis, but those prices<br />
collapsed along with the economy.<br />
By March 2009, the byproduct value<br />
was only $5.90 per hundredweight.<br />
Byproduct values improved later in<br />
2009 in response to tighter cattle<br />
supplies and gains in the domestic<br />
and global economies, but were still<br />
$2–3 lower than 2008 levels.<br />
U.S. meat production in 2009<br />
declined about 3 percent from 2008.<br />
This was only the third decline in<br />
production in the last 27 years, and<br />
it was by far the largest (production<br />
declined by 0.23 percent in 2003<br />
and by 0.06 percent in 2004).<br />
*Brenda Boetel is an assistant pr<strong>of</strong>essor,<br />
Department <strong>of</strong> <strong>Agricultural</strong> Economics,<br />
UW-River Falls and a commodity marketing<br />
specialist, Cooperative Extension,<br />
UW-Extension.<br />
Pounds per Person<br />
Percent<br />
Percent<br />
222<br />
218<br />
214<br />
210<br />
206<br />
202<br />
198<br />
194<br />
16<br />
12<br />
8<br />
4<br />
0<br />
-4<br />
-8<br />
-12<br />
-16<br />
22<br />
20<br />
18<br />
16<br />
14<br />
12<br />
10<br />
8<br />
6<br />
4<br />
2<br />
0<br />
1998<br />
1999<br />
1998<br />
1999<br />
U.S. Foreign Trade Balance (Exports–Imports)<br />
as a Percent <strong>of</strong> Production: Beef and Pork<br />
2000<br />
2001<br />
2000<br />
2001<br />
2002<br />
2003<br />
2002<br />
2003<br />
Beef<br />
2004<br />
2005<br />
Source: World <strong>Agricultural</strong> Supply<br />
and Demand Estimates, USDA<br />
*2009 values estimated<br />
U.S. per Capita Meat Consumption<br />
2004<br />
2005<br />
2006<br />
2007<br />
2008<br />
2009*<br />
2006<br />
2007<br />
2008<br />
2009*<br />
1998<br />
1999<br />
1998<br />
1999<br />
2000<br />
2001<br />
2000<br />
2001<br />
Source: World <strong>Agricultural</strong> Supply<br />
and Demand Estimates, USDA<br />
2009 is estimated<br />
<strong>2010</strong> is forecast<br />
1990 1992 1994 1996 1998 2000 2002 2004 2006 2008 <strong>2010</strong><br />
2002<br />
2003<br />
2004<br />
2005<br />
Pork<br />
Broilers Turkey<br />
2006<br />
2007<br />
2008<br />
2009*<br />
Source: World <strong>Agricultural</strong> Supply<br />
and Demand Estimates, USDA<br />
*2009 values estimated<br />
U.S. Foreign Trade Balance (Exports–Imports)<br />
as a Percent <strong>of</strong> Production: Broilers and Turkey<br />
22 STATUS OF WISCONSIN AGRICULTURE <strong>2010</strong>—CURRENT OUTLOOK: LIVESTOCK AND POULTRY<br />
2002<br />
2003<br />
2004<br />
2005<br />
2006<br />
2007<br />
2008<br />
2009*
The main pressures on the supply<br />
side were a substantial three-year<br />
increase in the cost <strong>of</strong> feed, particularly<br />
corn, as well as persistent<br />
droughts in the western United<br />
States. The rise in corn prices coincided<br />
with the rapid increase <strong>of</strong> use<br />
<strong>of</strong> corn to make ethanol.<br />
U.S. average corn prices broke the<br />
$3-per-bushel barrier in November<br />
2006. They have averaged $3.97 per<br />
bushel since then, hitting an all-time<br />
high <strong>of</strong> $6.56 in June 2008. From<br />
November 2003 through October<br />
2006, U.S. corn prices averaged<br />
$2.16 per bushel. From then to the<br />
end <strong>of</strong> September 2009, they averaged<br />
$3.77.<br />
The size <strong>of</strong> the U.S. corn crop actually<br />
increased 8 percent, from an<br />
average <strong>of</strong> 11,003 million bushels<br />
for 2003-2005 to 11,891 million<br />
bushels for 2006-2008. But despite<br />
the larger crops, the amount <strong>of</strong> corn<br />
used for domestic feed declined 7<br />
percent, from 6 billion bushels in<br />
2003-2005 to 5.6 million bushels in<br />
2006-2008.<br />
Although livestock producers’ costs<br />
increased from 2008 to 2009 and<br />
U.S. meat production was down 3<br />
percent, average prices <strong>of</strong> choice<br />
cattle, feeder cattle, cows, hogs,<br />
broilers and turkey all declined.<br />
About the only bright spot for producers<br />
was that hay prices were<br />
below the 2008 record highs.<br />
Cow slaughter changed only slightly<br />
in 2009 on the heels <strong>of</strong> a vigorous<br />
three-year rise (from the smallest<br />
slaughter in 42 years in 2006). Dairy<br />
cow slaughter was up about 12 percent<br />
due to three rounds <strong>of</strong> the CWT<br />
herd retirement program. Slaughter<br />
<strong>of</strong> beef and other cows was down<br />
about 9 percent. Cow slaughter in<br />
2009 remained about 41 percent<br />
below the record high recorded in<br />
1975, but about 20 percent above<br />
the recent low <strong>of</strong> 2005.<br />
<strong>2010</strong> Forecast.<br />
Following the 3 percent decline in<br />
U.S. meat production in 2009, a<br />
smaller drop <strong>of</strong> about 1 percent is<br />
expected in <strong>2010</strong>. A small increase<br />
may be experienced in poultry production<br />
against a modest decline in<br />
pork and beef.<br />
A wild card in the outlook in <strong>2010</strong> is<br />
the quality <strong>of</strong> the 2009 corn crop.<br />
The crop was planted late because<br />
<strong>of</strong> a cold and wet spring. Summer<br />
was marked by favorable precipitation<br />
but fewer than normal growing<br />
degree-days, and a wet and cold<br />
October delayed harvest. The harvested<br />
corn appears to have an<br />
above-normal moisture content.<br />
When a similar situation occurred<br />
with the 1972 crop, some animals<br />
failed to eat and gain weight in a<br />
normal fashion the following year.<br />
Pork production unexpectedly fell<br />
more than 9 percent in 1973. Drying<br />
and storage technology is far<br />
advanced from what it was 37<br />
yearsago, but the industry should be<br />
alert to any problems.<br />
U.S. Corn Production and Use, September, 2003–August,2009<br />
2003-2006 2006-2009 Change<br />
Mil. Bu. Mil. Bu. Mil. Bu. Percent<br />
Corn Production 11,003 11,891 888 8<br />
Feed Usage 6,033 5,586 (447) (7)<br />
Export 1,954 2,140 186 10<br />
Ethanal Usage. 1,365 2,948 1,583 116<br />
Food, Indus., Seed 1,370 1,328 (42) (3)<br />
World <strong>Agricultural</strong> Supply and Demand Estimates, USDA, various issues<br />
Choice Cattle Prices May Increase<br />
a Little. Choice cattle prices had<br />
averaged more than $90.00 per hundredweight<br />
in 2007 and 2008, but in<br />
2009 a severe U.S. recession with<br />
substantial unemployment cut<br />
demand, causing prices to tumble<br />
about 10 percent.<br />
Domestic beef demand should be<br />
stable to slightly higher in <strong>2010</strong>.<br />
Exports will likely increase as the<br />
world economy recovers, and this<br />
will also support the continued<br />
increase in byproduct value. These<br />
factors, combined with lower production,<br />
should allow a slight<br />
increase in fat cattle prices relative<br />
to 2009.<br />
Feeder Cattle Prices Likely to<br />
Improve Modestly. After a five–year<br />
run <strong>of</strong> prices exceeding $100 per<br />
hundredweight. (Oklahoma City),<br />
feeder cattle prices declined about 6<br />
percent in 2009. A higher price for<br />
fat cattle and smaller calf crop will<br />
support higher feeder cattle prices in<br />
<strong>2010</strong>. Additionally, lower feed costs<br />
have a positive impact on feeder cattle<br />
price. Prices should work back<br />
up toward the $100 mark in <strong>2010</strong>.<br />
As always, the price <strong>of</strong> feed and the<br />
price <strong>of</strong> finished cattle will be the<br />
main determinants.<br />
Utility Cow Prices Expected to be a<br />
Little Higher. Utility cow prices<br />
(Sioux Falls) jumped 39 percent from<br />
2002 to 2005 to $54.36 per hundredweight,<br />
but since then they have<br />
trended irregularly but lower to the<br />
upper $40s. A modest 5–10 percent<br />
improvement is anticipated in <strong>2010</strong>.<br />
Federally Inspected cow slaughter<br />
fell 54 percent from a record-high<br />
10.4 million in 1975 to a 42-year<br />
low <strong>of</strong> 4.8 million in 2005. Slaughter<br />
has since recovered to about 6.1<br />
million in 2008 and 2009. Little<br />
change in cow slaughter is expected<br />
in <strong>2010</strong>. If employment rises in<br />
<strong>2010</strong>, some modest price increase<br />
can be expected.<br />
In 2009, dairy cow slaughter totaled<br />
about 2.9 million head, up about 12<br />
STATUS OF WISCONSIN AGRICULTURE <strong>2010</strong>—CURRENT OUTLOOK: LIVESTOCK AND POULTRY 23
percent from a year earlier. Other<br />
cows, including beef cows, added<br />
up to about 3.2 million head, down<br />
about 9 percent from 2008.<br />
Hog Prices Should Average Higher.<br />
Hog prices averaged about 14 percent<br />
lower in 2009 than in 2008 but<br />
should regain at least half <strong>of</strong> that<br />
loss in <strong>2010</strong>, and possibly more. If<br />
the domestic economy can rebound<br />
and export demand increases—<br />
fueled in part by a weak dollar—<br />
hog prices can erase much <strong>of</strong> their<br />
2009 decline.<br />
The number <strong>of</strong> hogs on farms is<br />
about 2-3 percent smaller than a<br />
year ago. The breeding stock on<br />
September 1 was down 3.1 percent<br />
to 5.9 million head, thought to be<br />
the smallest breeding herd since the<br />
1800’s. The largest breeding stock<br />
on record was 13.3 million in 1923.<br />
Today the hog/pork industry produces<br />
about three times as much<br />
pork with about half the number <strong>of</strong><br />
breeding stock.<br />
The annual average hog price in<br />
2009 was about $41.00 per live hundredweight,<br />
the sixth lowest in 29<br />
years. Low hog prices combined<br />
with very high feed prices have created<br />
losses to hog producers for<br />
more than two years. These losses<br />
should restrain hog production in<br />
<strong>2010</strong> and allow prices to rise.<br />
Broiler Production to Rise a Bit;<br />
Prices May Also Edge Upward.<br />
Broiler production fell more than 3<br />
percent in 2009, the first decline in<br />
34 years. But under the weight <strong>of</strong><br />
the severe recession, the average 12city<br />
price also fell about 3 percent<br />
from 2008’s record high.<br />
The poor financial results in 2008<br />
and 2009 and continuing high feed<br />
costs should keep production<br />
increases in <strong>2010</strong> very modest. If<br />
the economy and employment<br />
improve, broiler prices may show<br />
some modest strength.<br />
Index, 2000–2006=100<br />
240<br />
200<br />
160<br />
120<br />
80<br />
40<br />
0<br />
Source: NASS, USDA<br />
2009 values estimated<br />
U.S.Hog and Corn Price Indices<br />
2000 2001 2002 2003 2004 2005 2006 2007 2008 2009<br />
Turkey Production, Prices About<br />
Steady. While turkey production and<br />
prices both hit record highs in 2008,<br />
2009 was a different story. Production<br />
fell about 8 percent, yet the<br />
average annual price declined a like<br />
amount. January 2009 frozen inventories<br />
<strong>of</strong> turkey meat were up 52<br />
percent from a year earlier. This and<br />
high feed costs contributed to poor<br />
financial results in 2009.<br />
The very high frozen inventories<br />
were reduced somewhat during<br />
2009, and turkey production should<br />
not rise much in <strong>2010</strong>, so prices may<br />
match 2009 averages. However, that<br />
would still put turkey prices well<br />
below 2008’s record highs.<br />
Lamb Production Down a Bit;<br />
Prices About Steady. U.S. lamb production<br />
fell another 3–4 percent in<br />
2009, extending a long string <strong>of</strong><br />
annual declines. Lamb production in<br />
2009 was down 27 percent from<br />
1990, declining each year <strong>of</strong> the<br />
decade. Lamb imports have risen 35<br />
percent during the same time, keeping<br />
consumption nearly steady at<br />
one pound per capita. Lamb prices<br />
rose about 5 percent in 2009 and<br />
should hold that advance in <strong>2010</strong>.<br />
Egg Production Continues Steady;<br />
Prices Near the 2009 Average. Egg<br />
production has trended sidewise for<br />
24 STATUS OF WISCONSIN AGRICULTURE <strong>2010</strong>—CURRENT OUTLOOK: LIVESTOCK AND POULTRY<br />
the last several years following a<br />
slow rise earlier in the decade. Yearover-year<br />
changes have been small<br />
each year.<br />
However, prices have <strong>of</strong>ten been<br />
highly variable from year to year,<br />
and <strong>of</strong>ten from quarter to quarter.<br />
Following a three-year 52-percent<br />
rise, egg prices collapsed about 22<br />
percent in 2009, but they still<br />
achieved the third-highest annual<br />
price in the decade. This year should<br />
bring the usual very small change in<br />
production and a volatile seasonal<br />
pattern <strong>of</strong> prices yielding an average<br />
nearly equal to 2009.<br />
Meat Consumption Down a Little<br />
More in <strong>2010</strong>. Meat consumption<br />
per capita has trended upward for<br />
decades, peaking from 2004 to<br />
2007. However, it declined by 2.5<br />
percent in 2008 and was followed<br />
by a similar drop in 2009. Consumption<br />
will likely decline again in<br />
<strong>2010</strong>, but by a smaller amount, to<br />
around 207 pounds per capita,<br />
which would be 6-7 percent below<br />
2007’s record <strong>of</strong> 221.6 pounds per<br />
capita. This continuing downtrend is<br />
driven by a sluggish U.S. economy,<br />
poor financial results for most livestock<br />
and poultry producers and<br />
good export demand encouraged by<br />
a weak dollar.
Corn and Soybeans<br />
Randy Fortenbery (608-262-4908)<br />
Synopsis<br />
The nation’s 2009 crops <strong>of</strong> both<br />
corn and soybeans are expected to<br />
show record yields despite very late<br />
harvests and concerns over yield<br />
loss from wet fall conditions. U.S.<br />
farmers will harvest a record soybean<br />
crop and their second-largest<br />
corn crop. Prices in 2009 did not<br />
match 2008 highs but were above<br />
pre-2007 levels. On the negative<br />
side, the higher prices have been<br />
<strong>of</strong>fset by higher input costs, so that<br />
per-acre returns did not increase<br />
with higher average prices.<br />
Corn<br />
The December World <strong>Agricultural</strong><br />
Supply and Demand Estimates<br />
pegged the average U.S. corn yield<br />
at 162.9 bushels per acre for 2009.<br />
This is 9 bushels above the 2008<br />
average yield and 12 bushels above<br />
that <strong>of</strong> 2007’s record crop. It also<br />
beats the previous record yield in<br />
2004 by 2.5 bushels. Despite record<br />
yields, however, total production is<br />
below that <strong>of</strong> the 2007/08 marketing<br />
year, because producers harvested 7<br />
million fewer acres in 2009/10.<br />
USDA estimated U.S. producers<br />
planted 86.4 million acres to corn<br />
in 2009 and harvested 79.3 million<br />
<strong>of</strong> those acres for grain. Planted<br />
acres in 2009 were actually less<br />
than harvested acres in 2007 (the<br />
record crop year), and the percentage<br />
<strong>of</strong> planted acres harvested was<br />
also lower.<br />
Beginning stocks for the current<br />
marketing year (stocks as <strong>of</strong> Sep-<br />
U.S. Corn Balance Sheet (Sep/Aug)<br />
tember 1, 2009) were slightly higher<br />
than last year’s, but ending stocks<br />
are expected to about equal last<br />
year’s. While more corn was produced<br />
relative to last year, overall<br />
demand is expected to increase even<br />
more. This will result in the stocksto-use<br />
ratio for 2009/10 being less<br />
than last year. Nevertheless, USDA<br />
expects lower average prices for the<br />
crop harvested in fall 2009 relative<br />
to the 2008/09 marketing year.<br />
Based on early USDA projections,<br />
total U.S. corn demand for the<br />
2009/10 will set a record. For the<br />
first time ever, industrial use (which<br />
includes seed, food, and ethanol<br />
use) will exceed feed demand. The<br />
growth in industrial use over the last<br />
several years is mostly explained by<br />
the increase in ethanol use. In fact,<br />
ethanol use now accounts for almost<br />
77 percent <strong>of</strong> total industrial use,<br />
Marketing Year 02/03 03/04 04/05 05/06 06/07 07/08 08/09* 09/10**<br />
Million Bushels (Except as Noted)<br />
Beg. Stocks 1,596 1,087 958 2,114 1,967 1,304 1,624 1,674<br />
Imports 14 14 11 9 12 20 14 10<br />
Acres Planted (Mil.) 78.9 78.6 80.9 81.5 78.3 93.5 86 86.4<br />
Acres Hvst. (Mil.) 69.3 70.9 73.6 75.1 70.6 86.5 78.6 79.3<br />
% Harvested 87.8% 90.2% 91.0% 92.1% 90.2% 92.5% 91.4% 91.8%<br />
Yield (Bu/A) 129.3 142.2 160.4 148 149.1 150.7 153.9 162.9<br />
Production 8,967 10,089 11,807 11,114 10,535 13,038 12,101 12,921<br />
Total Supply 10,578 11,190 12,776 13,237 12,514 14,362 13,739 14,605<br />
Feed & Res. 5,563 5,795 6,158 6,155 5,595 5,913 5,254 5,400<br />
Food/Seed/Ind. 2,340 2,537 2,686 2,981 3,490 4,387 4,953 5,480<br />
Ethanol 996 1,168 1,323 1,603 2,119 3,049 3,677 4,200<br />
Exports 1,588 1,900 1,818 2,134 2,125 2,437 1,858 2,050<br />
Total Demand 9,491 10,232 10,662 11,270 11,210 12,737 12,065 12,930<br />
Ending Stocks 1,087 958 2,114 1,967 1,304 1,624 1,674 1,675<br />
Stocks to Use (%) 11.45% 9.36% 19.83% 17.45% 11.63% 12.75% 13.87% 12.95%<br />
Average Farm<br />
Price ($/Bu.) $2.32 $2.42 $2.06 $2.00 $3.04 $4.20 $4.06 $3.55<br />
*USDA Estimate as <strong>of</strong> December 2009<br />
**USDA Forecast as <strong>of</strong> December 2009<br />
STATUS OF WISCONSIN AGRICULTURE <strong>2010</strong>—CURRENT OUTLOOK: CORN AND SOYBEANS 25
Million Bushels<br />
6,000<br />
5,000<br />
4,000<br />
3,000<br />
2,000<br />
1,000<br />
0<br />
Total Industrial Use<br />
(Including Food and Seed)<br />
U.S. Corn Use<br />
compared to less than 30 percent<br />
a decade ago. Demand from ethanol<br />
exceeds total industrial demand <strong>of</strong><br />
just four years ago. Ethanol demand<br />
continues to grow in spite <strong>of</strong> the<br />
poor performance <strong>of</strong> ethanol plants<br />
over the last year or so.<br />
Feed demand is expected to increase<br />
slightly relative to last year, but it is<br />
still well below demand experienced<br />
over most <strong>of</strong> the last decade. In fact,<br />
not since the 1996/97 marketing<br />
year has feed demand been less than<br />
in both this and last year.<br />
Exports in 2009/10 are expected to<br />
recover somewhat from last year’s<br />
drop-<strong>of</strong>f, but they will still be below<br />
those in the 2005/06 and 2007/08<br />
marketing years. This year’s<br />
improvement is at least partially<br />
explained by a continuing decline in<br />
the value <strong>of</strong> the dollar relative to the<br />
currencies <strong>of</strong> major corn buyers.<br />
The dollar fell steadily from 2002<br />
through early 2008, strengthened<br />
through most <strong>of</strong> 2008, and then fell<br />
again in 2009. The dollar’s value<br />
correlates closely with the volume<br />
<strong>of</strong> U.S. corn exports: Exports continued<br />
to increase most years<br />
between 2002/03 and 2007/08,<br />
declined on a year-over-year basis in<br />
2008/09, and are expected to<br />
increase again this year.<br />
Feed Use<br />
World corn production for the current<br />
marketing year is expected to<br />
be just over 31 billion bushels. The<br />
U.S. harvest represents about 42<br />
percent <strong>of</strong> global production,<br />
which is expected to be down about<br />
1 percent from last year’s. Among<br />
major producers, year-over-year<br />
increases are expected only from<br />
Argentina (1 percent increase) and<br />
the United States. Most major producers,<br />
including Brazil, China,<br />
South Africa, the former Soviet<br />
Union, Mexico, the EU-27 and<br />
Southeast Asia, expect lower<br />
2009/10 harvests.<br />
Total global demand is expected to<br />
increase relative to last year (despite<br />
a s<strong>of</strong>tening <strong>of</strong> global feed demand),<br />
with total exports increasing by<br />
about 4 percent. Global ending<br />
stocks are expected to fall by about<br />
9 percent this year.<br />
<strong>Wisconsin</strong> produced its third-largest<br />
corn crop on record in 2009,<br />
exceeded only in 2005 and 2007.<br />
The 2009 crop is currently estimated<br />
at over 423 million bushels, up<br />
almost 29 million bushels from<br />
2008. However, the state’s share <strong>of</strong><br />
the total U.S. crop is below average.<br />
From 1980 through 2008, <strong>Wisconsin</strong>’s<br />
corn crop has averaged just<br />
over 4 percent <strong>of</strong> the total U.S. crop,<br />
but in 2009 we contributed only<br />
26 STATUS OF WISCONSIN AGRICULTURE <strong>2010</strong>—CURRENT OUTLOOK: CORN AND SOYBEANS<br />
Ethanol<br />
1997/98 1999/00 2001/02 2003/04 2005/06 2007/08 2009/10<br />
3.28 percent. There have been only<br />
four years in the last 30 in which<br />
<strong>Wisconsin</strong> has had a smaller share<br />
<strong>of</strong> the nation’s crop, and three <strong>of</strong><br />
those were in the last 6 years.<br />
The average corn yield in <strong>Wisconsin</strong><br />
is estimated at 146 bushels per acre,<br />
an improvement <strong>of</strong> 9 bushels per<br />
acre over the 2008 harvest. Total<br />
harvested acres exceeded last year<br />
by only 20 thousand, so the yearover-year<br />
production increase comes<br />
almost entirely from an increase in<br />
per-acre yields.<br />
Harvest prices for corn this year<br />
were about 62 cents per bushel<br />
below 2008 harvest prices. However,<br />
as <strong>of</strong> mid-December, the<br />
futures markets were <strong>of</strong>fering<br />
about 5 cents per month for storage<br />
through July. In addition, <strong>Wisconsin</strong><br />
basis levels were several cents<br />
weaker than normal, thus some basis<br />
improvement going forward is also<br />
expected. As a result, <strong>2010</strong> storage<br />
opportunities look attractive, and<br />
some price improvement can be<br />
expected as we move through the<br />
marketing year.<br />
Like the last two years, price<br />
volatility is likely to be greater<br />
than was experienced prior to the<br />
2007/08 marketing year. We have<br />
entered an era <strong>of</strong> both higher prices<br />
(consistently averaging above<br />
the low-$3-per-bushel level) and<br />
increased volatility. This means that<br />
storing corn without locking in a<br />
price represents a greater risk than<br />
in the past.<br />
Soybeans<br />
In December 2009 USDA estimated<br />
the U.S. soybean at a record 3.32<br />
billion bushels, an increase <strong>of</strong> 12<br />
percent from the 2008 harvest. U.S.<br />
producers set records in 2009 for<br />
both yields (estimated at 43.4<br />
bushels per acre, just over a halfbushel<br />
above the previous record in<br />
2006) and both planted and harvested<br />
acres (up almost 2 million<br />
over last year).
Beginning stocks (stocks as <strong>of</strong> September<br />
1, 2009) going into the current<br />
marketing year totaled 138<br />
million bushels, the lowest level in<br />
five years. However, ending stocks<br />
this year are expected to exceed<br />
both last year and the 2007/08 marketing<br />
year, totaling 225 million<br />
bushels. As a result, average farmlevel<br />
prices across the United States<br />
are expected to be lower than the<br />
last couple <strong>of</strong> years, although still<br />
well above those experienced prior<br />
to 2007.<br />
On the demand side, current expectations<br />
are for small increases in<br />
both soybean crush and exports this<br />
year. But the increase in demand<br />
won’t <strong>of</strong>fset the increase in production,<br />
leading to the year-over-year<br />
increase in ending stocks. As <strong>of</strong><br />
December 2009, soybean crush was<br />
projected to total 1.7 billion bushels<br />
U.S. Soybean Balance Sheet (Sep/Aug)<br />
Marketing Year 02/03 03/04 04/05 05/06 06/07 07/08 08/09* 09/10**<br />
Million Bushels (Except as Noted)<br />
Beg Stocks 208 178 112 256 449 574 205 138<br />
Imports 5 6 6 3 9 10 13 8<br />
Acres Planted (Mil.) 74 73.4 75.2 72 75.5 64.7 75.7 77.5<br />
Acres Hvst. (Mil.) 72.5 72.5 74 71.3 74.6 64.1 74.7 76.6<br />
% Harvested 98.0% 98.8% 98.4% 99.0% 98.5% 99.1% 98.7% 98.8%<br />
Yield 38 33.9 42.2 43 42.7 41.7 39.7 43.3<br />
Production 2,756 2,454 3,124 3,063 3,188 2,677 2,967 3,319<br />
Total Supply 2,969 2,638 3,242 3,322 3,647 3,261 3,185 3,465<br />
Crush Sep/Aug 1,615 1,530 1,696 1,739 1,808 1,803 1,662 1,695<br />
Exports 1,044 887 1,097 940 1,116 1,159 1,283 1,340<br />
F/S/R 130 109 192 194 149 93 101 175<br />
Total Demand 2,791 2,526 2,986 2,873 3,073 3,056 3,047 3,210<br />
Ending Stocks 178 112 256 449 574 205 138 225<br />
Stocks To Use (%) 6.38% 4.43% 8.57% 15.62% 18.28% 6.71% 4.53% 7.01%<br />
Avg. Farm Price $5.53 $7.34 $5.74 $5.66 $6.43 $10.10 $9.97 $9.50<br />
*USDA Estimate as <strong>of</strong> December 2009<br />
**USDA Forecast as <strong>of</strong> December 2009<br />
in 2009/10, up almost 2 percent over<br />
2008/09. Exports are expected to be<br />
up almost 4.5 percent to a total <strong>of</strong><br />
1.34 billion bushels.<br />
Like production, demand for<br />
2009/10 represents a U.S. record. In<br />
fact, this year’s demand exceeds<br />
total production in every year except<br />
the current one. The previous production<br />
record was 3.188 billion<br />
bushels in 2006. This year’s consumption<br />
will beat that by about 22<br />
million bushels.<br />
World soybean production for the<br />
current marketing year is also forecast<br />
higher—almost 19 percent<br />
above last year’s. Total world production<br />
is expected to be 9.2 billion<br />
bushels, with U.S. production representing<br />
about 35 percent <strong>of</strong> that.<br />
Both Argentina and Brazil are<br />
expected to have significant<br />
increases in soybean production,<br />
while the only major reduction will<br />
come from China. Argentinean production<br />
is projected to be up a<br />
whopping 66 percent, and Brazil is<br />
expected to produce 11 percent<br />
more than a year ago. World<br />
demand is also projected to increase,<br />
but not as much as the increase in<br />
production, leading to a projected<br />
2.1 billion bushels increase in world<br />
ending stocks for 2009/10, up 35<br />
percent over last year.<br />
Like much <strong>of</strong> the rest <strong>of</strong> the country,<br />
<strong>Wisconsin</strong> produced significantly<br />
more soybeans in 2009 than in<br />
2008. Total <strong>Wisconsin</strong> production is<br />
estimated at 66.8 million bushels, an<br />
increase <strong>of</strong> 20 percent. <strong>Wisconsin</strong><br />
yields jumped 6 bushels per acre to<br />
an average <strong>of</strong> 41 bushels per acre.<br />
<strong>Wisconsin</strong> also harvested 40 thousand<br />
more acres this year than last.<br />
<strong>Wisconsin</strong> produced about 2 percent<br />
STATUS OF WISCONSIN AGRICULTURE <strong>2010</strong>—CURRENT OUTLOOK: CORN AND SOYBEANS 27
3.00%<br />
2.50%<br />
2.00%<br />
1.50%<br />
1.00%<br />
0.50%<br />
0.00%<br />
<strong>of</strong> the U.S. soybean crop. Its share<br />
has been pretty consistent over the<br />
last decade.<br />
Harvest prices for the 2009 soybean<br />
crop have averaged about 9 cents<br />
per bushel higher than in 2008<br />
(based on national averages). Looking<br />
forward, the futures market is<br />
<strong>of</strong>fering attractive returns to storage<br />
through March, and some basis<br />
improvement should be expected for<br />
<strong>Wisconsin</strong> producers. As with corn,<br />
significant price volatility is<br />
expected, so that those who are riskaverse<br />
may want to lock in storage<br />
returns for at least a portion <strong>of</strong> the<br />
crop being carried forward. The possible<br />
returns to storing soybeans into<br />
the late spring or summer do not<br />
look as attractive as those for corn.<br />
<strong>Wisconsin</strong>’s Soybean Crop as a Percent <strong>of</strong> U.S. Crop<br />
1991 1993 1995 1997 1999 2001 2003 2005 2007 2009<br />
Summary<br />
Recent experience suggests that we<br />
have entered an era where average<br />
prices for both corn and soybeans<br />
will exceed those paid in the late<br />
1980’s, the 1990’s, and the first half<br />
<strong>of</strong> the 2000s. However, along with<br />
the higher prices has come increased<br />
price volatility. This suggests two<br />
things: 1) Government programs do<br />
not provide as high a level <strong>of</strong> risk<br />
protection at current prices as they<br />
once did, and 2) risk management<br />
strategies outside the government<br />
programs will become increasingly<br />
important in determining an individual<br />
producer’s bottom line.<br />
28 STATUS OF WISCONSIN AGRICULTURE <strong>2010</strong>—CURRENT OUTLOOK: CORN AND SOYBEANS
Fruits and Vegetables<br />
A.J. Bussan* (608) 262-3519<br />
Synopsis<br />
Although <strong>Wisconsin</strong> cranberry production<br />
decreased 11 percent in<br />
2009, prices remained strong, supported<br />
by strong demand for cranberry<br />
products here and abroad.<br />
The potato market has weakened. A<br />
combination <strong>of</strong> increased planting<br />
and higher yields across the country<br />
led to a larger volume <strong>of</strong> stored<br />
potatoes going into <strong>2010</strong> than 2009.<br />
Consumption was down for the fall<br />
quarter <strong>of</strong> 2009 due to 5 percent<br />
reduction in frozen processed potato<br />
consumption nationally. Openmarket<br />
potato prices in the fall <strong>of</strong><br />
2009 were only about 30 percent<br />
<strong>of</strong> 2008 prices.<br />
Contract prices for processed vegetables<br />
remain strong. Wholesale<br />
*A.J. Bussan is an associate pr<strong>of</strong>essor,<br />
Department <strong>of</strong> Horticulture, UW-<br />
Madison and vegetable crop production<br />
system specialist, Cooperative<br />
Extension, UW-Extension<br />
Value—$Million<br />
prices for canned and frozen sweet<br />
corn, green peas, green beans, carrots,<br />
and beets for 2008 and 2009<br />
are up nearly 30 percent compared<br />
to 2007 and earlier. <strong>Wisconsin</strong>,<br />
Minnesota, and Illinois remain<br />
the nation’s largest concentrated<br />
production <strong>of</strong> canned and frozen<br />
vegetables. <strong>Wisconsin</strong> currently<br />
ranks 2nd nationally in production<br />
<strong>of</strong> vegetables (excluding tomatoes)<br />
for processing.<br />
Fruit Crops<br />
Apples<br />
The USDA forecast for <strong>Wisconsin</strong>’s<br />
2009 apple crop is 58.5 million<br />
pounds, up 3 percent from the previous<br />
year’s crop. Dry conditions,<br />
especially in the northern two-thirds<br />
<strong>of</strong> the state, may have limited fruit<br />
size, but yields should be better than<br />
last year. Scab was an issue in some<br />
orchards. The U.S. apple crop is<br />
expected to increase 4 percent over<br />
last year.<br />
Tart Cherries<br />
<strong>Wisconsin</strong> tart cherry production<br />
had only one direction to go. After<br />
<strong>Wisconsin</strong> Cranberries: Season-Average Grower Price and Total Crop Value<br />
280<br />
240<br />
200<br />
160<br />
120<br />
80<br />
40<br />
0<br />
Season-Average<br />
Price (Right Axis)<br />
an almost complete loss in 2008, the<br />
2009 crop was forecast at 8.3 million<br />
pounds, which is within 20 percent<br />
<strong>of</strong> 2007 volume. The tart cherry<br />
crop was reportedly delayed due to<br />
cool and wet weather through much<br />
<strong>of</strong> the early part <strong>of</strong> the season.<br />
Cranberries<br />
USDA forecasts that <strong>Wisconsin</strong>’s<br />
2009 cranberry crop will be 4 million<br />
barrels (1 barrel = 100 pounds).<br />
This is down from 2008’s record <strong>of</strong><br />
4.5 million barrels, but it would be<br />
the second largest crop on record for<br />
<strong>Wisconsin</strong>. The lower production<br />
was mainly due to marshes recovering<br />
from the huge 2008 crop. Cool<br />
weather in late spring and summer<br />
may also have reduced berry size.<br />
The unusually cool nights forced<br />
growers to frost-protect into early<br />
summer and again in early fall.<br />
Nevertheless, <strong>Wisconsin</strong> continues<br />
to lead the nation in cranberry production<br />
and once again will produce<br />
over half <strong>of</strong> the U.S. crop in 2009.<br />
<strong>Wisconsin</strong> cranberry growers<br />
received an average price <strong>of</strong> $55.40<br />
per barrel in 2008, and the price is<br />
Crop Value (Left Axis)<br />
0<br />
1972 1976 1980 1984 1988 1992 1996 2000 2004 2008<br />
STATUS OF WISCONSIN AGRICULTURE <strong>2010</strong>—CURRENT OUTLOOK: FRUITS AND VEGETABLES 29<br />
70<br />
60<br />
50<br />
40<br />
30<br />
20<br />
10<br />
Price—$/Barrel
expected increase marginally for<br />
2009. Demand for cranberry products<br />
in the United States and abroad<br />
continues to expand, which has<br />
resulted in an expansion <strong>of</strong> exports<br />
and domestic utilization and steadily<br />
increasing prices since 2005.<br />
Vegetable Crops<br />
Potatoes<br />
At nearly 29 million hundredweight,<br />
the 2009 <strong>Wisconsin</strong> potato crop was<br />
the largest since 2006. <strong>Wisconsin</strong><br />
farmers planted 63,500 acres <strong>of</strong><br />
potatoes, identical to 2008 but 2,500<br />
acres fewer than 2006. <strong>Wisconsin</strong><br />
potato yields in 2009 are projected<br />
to be 460 hundredweight/acre, the<br />
highest ever recorded. Nearly all the<br />
planted acres were harvested, the<br />
exception being some fields that<br />
suffered tuber damage from a hard<br />
frost on October 8. Cool growing<br />
season temperatures provided an<br />
excellent environment for potato<br />
growth and development. Solids<br />
content and tuber size were high,<br />
leading to good quality for all market<br />
sectors. Shrink (loss in storage)<br />
to date is slightly higher than 2008<br />
due to frost damage prior to harvest<br />
<strong>of</strong> in some stored potatoes. The <strong>Wisconsin</strong><br />
crop utilization breaks down<br />
as 9 percent for seed potatoes, 19<br />
percent for chip potatoes, 23 percent<br />
for frozen and dehydrated, and 49<br />
percent for the fresh market.<br />
<strong>Wisconsin</strong> had almost 30 percent<br />
more potatoes in storage on Decem-<br />
ber 1, 2009, than on the same date in<br />
2008. This was due both to higher<br />
yields and slower usage from September<br />
through November. This<br />
trend was mirrored at the national<br />
level, with a much larger volume <strong>of</strong><br />
potatoes in storage than last year<br />
due to more acres and higher yields<br />
across most producing regions. A 5percent<br />
drop in processed potato<br />
consumption nationally in 2009 is<br />
contributing to excessive inventories.<br />
The fresh market price in December<br />
2009 was 50 percent lower than a<br />
year earlier. Sales <strong>of</strong> fresh potatoes<br />
have been brisk, but the large volume<br />
<strong>of</strong> potatoes in storage is keeping<br />
a lid on prices.<br />
Sweet Corn<br />
<strong>Wisconsin</strong> is a leading producer <strong>of</strong><br />
processed sweet corn, with 81,300<br />
acres planted in 2009. Yields were<br />
forecast to increase by 10 percent in<br />
2009 over 2008 due to good precipitation<br />
and minimal crop stress during<br />
the growing season. Another<br />
6,500 acres <strong>of</strong> sweet corn were<br />
planted for fresh market. Temperatures<br />
were cooler than ideal for<br />
sweet corn, leading to a 5- to 15-day<br />
delay in crop maturity depending on<br />
the production region. As <strong>of</strong> mid-<br />
September, more than half <strong>of</strong> the<br />
state’s sweet corn for processing had<br />
yet to be harvested, which is higher<br />
than normal. But frosts also came<br />
later than normal, allowing for<br />
almost complete harvest <strong>of</strong> the<br />
planted 2009 crop.<br />
<strong>Wisconsin</strong> Potatoes (All Uses) and Vegetables for Processing, 2008<br />
Production (1,000 Tons)<br />
<strong>Wisconsin</strong> United States<br />
<strong>Wisconsin</strong><br />
as % <strong>of</strong> U.S.<br />
Value<br />
($Million)<br />
Fall Potatoes (All Uses) 1,286.5 18,929.4 6.8% 290.7<br />
Sweet Corn 651.6 2,832.5 23.0% 80.9<br />
Snap Beans 326.9 808.0 40.5% 61.9<br />
Carrots 77.3 404.7 19.1% 6.2<br />
Green Peas 76.1 411.8 18.5% 20.2<br />
Cucumbers 39.5 566.2 7.0% 8.2<br />
30 STATUS OF WISCONSIN AGRICULTURE <strong>2010</strong>—CURRENT OUTLOOK: FRUITS AND VEGETABLES<br />
Snap Beans<br />
Snap bean production in <strong>Wisconsin</strong><br />
was estimated at 305,510 tons for<br />
2009, down 2 percent from 2008.<br />
<strong>Wisconsin</strong> farmers had contracts to<br />
plant 39 percent <strong>of</strong> the nation’s 2009<br />
snap bean acreage. Despite a reduction<br />
in planted acreage, slightly<br />
higher yields kept production near<br />
2008 levels. Cool summer growing<br />
conditions slowed snap bean growth<br />
and development, but minimal stress<br />
conditions and excellent root health<br />
led to good yields.<br />
Green Peas<br />
<strong>Wisconsin</strong> produced an estimated<br />
85,240 tons <strong>of</strong> green peas from<br />
40,400 planted acres in 2009. This<br />
was up from 2008 due to both<br />
increased plantings and higher<br />
yields. <strong>Wisconsin</strong> producers were<br />
contracted to grow just under 20<br />
percent <strong>of</strong> the national green pea<br />
crop in 2009. The hottest week <strong>of</strong><br />
the summer in early June caused<br />
some stress on peas, but healthy<br />
roots and cool conditions during pod<br />
fill led to good yields in 2009.<br />
Cucumbers<br />
<strong>Wisconsin</strong> growers planted 6,300<br />
acres <strong>of</strong> pickling cucumbers in<br />
2009, about 6 percent <strong>of</strong> the U.S.<br />
total. Cucumber harvest was<br />
delayed due to cool conditions,<br />
but limited crop stress led to<br />
excellent yields.<br />
Onions<br />
<strong>Wisconsin</strong> onion production in 2009<br />
is expected to reach 1 million hundredweight,<br />
triple that <strong>of</strong> 2008.<br />
Farmers planted onions on 2,000<br />
acres in 2009, and yields are<br />
expected to reach 500 hundredweight/acre.<br />
The entire crop was<br />
harvested for the first time in several<br />
years, as there were no major precipitation<br />
events, minimizing flooding<br />
<strong>of</strong> muck crops. <strong>Wisconsin</strong><br />
produces less than 2 percent <strong>of</strong> the<br />
national onion crop.
Introduction<br />
III. Framing the Financial Crisis for <strong>Wisconsin</strong> <strong>Agriculture</strong>:<br />
Perspectives on Resiliency and Impacts<br />
Alan Turnquist and Brad Barham 1<br />
The world economic situation was remarkably difficult<br />
in 2009. Declines in spending and reduced availability<br />
<strong>of</strong> credit affected all sectors <strong>of</strong> the economy. <strong>Agriculture</strong><br />
had a particularly difficult year. As the previous sections<br />
<strong>of</strong> this report show, the impacts <strong>of</strong> the economy-wide<br />
recession were exacerbated for much <strong>of</strong> U.S. agriculture<br />
by other factors such as high input costs and drastically<br />
reduced prices.<br />
While agriculture throughout the nation and the world<br />
suffered losses in 2009, some regions, organizations and<br />
producers were in better shape than others. As a state,<br />
<strong>Wisconsin</strong>’s mix <strong>of</strong> products, production practices and<br />
industry structure have impacted the way in which we<br />
have been affected. Likewise, the structure and timing <strong>of</strong><br />
decisions on the farm level has impacted the way in<br />
which individual producers are faring.<br />
The articles that follow seek to <strong>of</strong>fer some further perspective<br />
on what the farm financial crisis has meant to<br />
<strong>Wisconsin</strong>’s producers. Most <strong>of</strong> the articles go beyond<br />
the past and present and look to future implications. The<br />
pieces focus on dairy but consider other agricultural sectors<br />
as well.<br />
The first two articles take a broad perspective. Brian<br />
Gould analyzes how <strong>Wisconsin</strong> dairy has fared in comparison<br />
to other states and regions in the United States,<br />
then Ed Jesse and Steven Deller discuss the importance<br />
<strong>of</strong> international trade both to <strong>Wisconsin</strong>’s agriculture<br />
and the state in general. Next, Paul Dietmann brings us<br />
down to the farm level with a look at how individual<br />
producers have managed through this most difficult<br />
year, and Brad Barham describes how one cooperative is<br />
navigating the downturn by managing supply and prices<br />
<strong>of</strong> its producers. Finally, Phil Harris <strong>of</strong>fers practical<br />
advice to producers on managing tax liability in times <strong>of</strong><br />
financial distress.<br />
Looking at these experts’ reviews, a few salient points<br />
emerge. <strong>Agriculture</strong> at both the state and national level<br />
is increasingly reliant on exports. The loss in export revenue<br />
was at the heart <strong>of</strong> the financial downturn for dairy<br />
and crop producers in 2009. Restoring farm pr<strong>of</strong>itability<br />
in the nation will depend on the recovery <strong>of</strong> these crucial<br />
agricultural export markets.<br />
For individual dairy producers, it is clear that the timing<br />
and nature <strong>of</strong> investment was crucial. Those who had<br />
made major investments in equipment and facilities and<br />
entered 2009 with debt <strong>of</strong>ten suffered greater financial<br />
stress than those who had prepaid expenses such as feed<br />
and fuel. Farm and household structure also made a difference:<br />
Those with significant cash outflows for inputs<br />
such as hired labor or purchased feed were less able to<br />
adapt to a credit-constrained environment. Operators<br />
who relied more on themselves and family for labor, and<br />
those who grew most <strong>of</strong> their own feed, had more flexibility<br />
in dealing with these challenges.<br />
As a whole, the <strong>Wisconsin</strong> dairy sector weathered the<br />
storm better than did most other states and regions in the<br />
country. Production increased here while it declined significantly<br />
in most other major dairy states. While many<br />
<strong>Wisconsin</strong> producers did incur losses, the ability <strong>of</strong> our<br />
farmers to find new, better and distinctive ways to manage<br />
their farms resulted in better financial outcomes<br />
than in other states. <strong>Wisconsin</strong>’s relative success in part<br />
reflects a land base which allows for a diverse array <strong>of</strong><br />
integrated crop-livestock production systems. It also<br />
reflects the expertise and craftiness <strong>of</strong> our milk producers<br />
as well as the many institutions and individuals who<br />
provide them with information, products and services.<br />
As Paul Dietmann concludes: “One year <strong>of</strong> extraordinary<br />
difficulty will not negate all <strong>of</strong> the positive factors<br />
that work in our state’s favor.”<br />
STATUS OF WISCONSIN AGRICULTURE <strong>2010</strong>—FRAMING THE FINANCIAL CRISIS: INTRODUCTION 31
Regional Differences in the Response to Low Milk Prices:<br />
Herd Size, Production and Pr<strong>of</strong>itability<br />
Brian W. Gould 2<br />
Since the beginning <strong>of</strong> 2009, the dairy industry has<br />
experienced unprecedented decreases in farm-level milk<br />
prices. At the same time, the costs <strong>of</strong> many inputs were<br />
relatively high. This cost-price squeeze yielded negative<br />
cash flows for most producers.<br />
Over the first 11 months <strong>of</strong> 2009, the <strong>Wisconsin</strong> average<br />
All-Milk price was $12.74, down 33 percent from<br />
the 2008 average <strong>of</strong> $19.11 and the lowest 11-month<br />
average since 2002. We estimate that the <strong>Wisconsin</strong><br />
average Mailbox price will be $12.52/hundredweight,<br />
down from $18.81/hundredweight in 2008. With respect<br />
to feed costs, the average prices paid for corn grain and<br />
soybeans by producers in <strong>Wisconsin</strong> were $3.78/bu and<br />
$10.07/bu, respectively. These prices are up approximately<br />
30 percent higher from the January-November<br />
period <strong>of</strong> the previous 5 years.<br />
Dairy farmers in other regions suffered<br />
from the same negative cash<br />
flow problems as <strong>Wisconsin</strong>, but the<br />
severity <strong>of</strong> losses and the response<br />
by farmers to those losses varied<br />
across regions. These differential<br />
impacts reflect differences in farm<br />
structure, product mix and technology<br />
and other factors. What follows<br />
is a review <strong>of</strong> how dairy sectors in a<br />
number <strong>of</strong> the major producing<br />
states responded to the challenges <strong>of</strong><br />
the last year.<br />
Regional Differences in Farm<br />
Pr<strong>of</strong>itability<br />
We can get a rough idea <strong>of</strong> the relative<br />
pr<strong>of</strong>itability <strong>of</strong> dairying across<br />
states by using data on milk prices<br />
and feed costs to compute milk<br />
income over feed costs (IOFC). By<br />
using state-specific mailbox prices<br />
and estimates <strong>of</strong> (per-hundredweight<br />
<strong>of</strong> milk) purchased and non-purchased<br />
feed costs from the Economic<br />
Research Service (ERS) <strong>of</strong><br />
USDA, we estimated monthly IOFC<br />
for <strong>Wisconsin</strong>, California and New<br />
Mexico—three states with very different<br />
dairy systems. 3 New Mexico<br />
and <strong>Wisconsin</strong> show similar total<br />
feed costs. California has had higher<br />
32 STATUS OF WISCONSIN AGRICULTURE <strong>2010</strong>—FRAMING THE FINANCIAL CRISIS<br />
$/Cwt <strong>of</strong> Milk<br />
$/Ctw<br />
17.00<br />
15.00<br />
13.00<br />
11.00<br />
9.00<br />
7.00<br />
16.00<br />
12.00<br />
8.00<br />
4.00<br />
0.00<br />
-4.00<br />
-8.00<br />
Jan 07<br />
Mar 07<br />
May 07<br />
feed costs since 2007. Subtracting these monthly cost<br />
estimates from each state’s monthly average mailbox<br />
price generates our IOFC estimates.<br />
There is a distinct similarity in the way that state IOFC<br />
pr<strong>of</strong>iles change over time, with decreases starting in the<br />
second half <strong>of</strong> 2007. <strong>Wisconsin</strong>’s IOFC values are substantially<br />
higher than those <strong>of</strong> California, the state that<br />
produces the most milk. In January 2008, the estimated<br />
<strong>Wisconsin</strong> IOFC was $12.17/hundredweight, compared<br />
to $6.00 for California and $10.93 for New Mexico.<br />
In July 2009, the month with the lowest IOFC estimates,<br />
the estimated <strong>Wisconsin</strong> IOFC was $2.18/hundredweight,<br />
an 82.1 percent decline. In comparison, New<br />
Mexico’s estimated IOFC was $1.78, while California’s<br />
was -$5.05/hundredweight, indicating that its mailbox<br />
<strong>Wisconsin</strong><br />
California<br />
New Mexico<br />
Jul 07<br />
Estimated Total Feed Costs<br />
5.00<br />
Jan 07 May 07 Sep 07 Jan 08 May 08 Sep 08 Jan 09 May 09 Sep 09 Nov 09<br />
Sep 07<br />
Income Over Feed Costs<br />
Nov 07<br />
Jan 08<br />
Mar 08<br />
May 08<br />
Jul 08<br />
Sep 08<br />
Nov 08<br />
Jan 09<br />
<strong>Wisconsin</strong><br />
California<br />
New Mexico<br />
Mar 09<br />
May 09<br />
Jul 09<br />
Sep 09<br />
Nov 09
price could not cover estimated feed costs. By our calculation,<br />
California had a negative IOFC from Dec. 2008–<br />
Sept. 2009, the last month for which mailbox price<br />
information is available. Other dairy states in the Midwest<br />
and Northeast, such as Michigan, New York and<br />
Pennsylvania, have IOFC estimates similar to those <strong>of</strong><br />
<strong>Wisconsin</strong>.<br />
Regional Participation in the CWT Herd<br />
Retirement Program<br />
Another indicator <strong>of</strong> relative financial stress among<br />
dairy sectors in different regions is the level <strong>of</strong> participation<br />
in the Cooperatives Working Together (CWT) herd<br />
buyout program. In response to the extremely low milk<br />
prices and high feed costs, CWT initiated three rounds<br />
<strong>of</strong> this program in 2009. 4<br />
The table below compares milk-producing regions in<br />
terms <strong>of</strong> number <strong>of</strong> milk cows slaughtered, milk capacity<br />
removed, milk removed per accepted bid and share<br />
<strong>of</strong> milk removed from production under each <strong>of</strong> the nine<br />
CWT herd reduction rounds from 2003 through 2009.<br />
The importance <strong>of</strong> the Midwest as a source <strong>of</strong> CWT-<br />
induced herd-size reduction decreased during this time<br />
period. In the 2003 reduction program, 18.3 percent <strong>of</strong><br />
the total milk removed originated from the Midwest. In<br />
comparison, during rounds 2008-2 and 2009-1, less than<br />
10 percent <strong>of</strong> the milk originated from the Midwest. All<br />
told, since the CWT program began in 2003, the Midwest<br />
accounted for 12.8 percent <strong>of</strong> the total milk capacity<br />
reduction, compared to 33.7 percent for the<br />
Southwest and 38.1 percent for the West. During 2009,<br />
the Midwest reduced its herd size via CWT participation<br />
much less than the region’s share <strong>of</strong> U.S. milk production.<br />
While it accounted for 29.7 percent <strong>of</strong> U.S. milk<br />
production during all <strong>of</strong> 2008, the Midwest accounted<br />
for just 9.4 percent <strong>of</strong> the total amount <strong>of</strong> milk capacity<br />
removed under the 2009 CWT rounds.<br />
In general, states’ participation in CWT is consistent<br />
with the relative pr<strong>of</strong>itability <strong>of</strong> dairying. In particular,<br />
large western and southwestern dairy farms, which have<br />
seen especially high feed costs and lower pr<strong>of</strong>itability,<br />
have accounted for a disproportionately large share<br />
CWT herd retirements in recent rounds.<br />
Regional Comparison <strong>of</strong> CWT Herd Reduction Enrollment<br />
Region 2003 2004 2005 2007 2008-1 2008-2 2009-1 2009-2 2009-2 Total<br />
Number <strong>of</strong> Cows<br />
Northeast 2,848 3,871 4,798 6,300 2,776 2,295 5,121 5,740 2,423 36172<br />
Southeast 3,342 4,066 3,803 5,583 3,987 3,750 6,400 4,084 2,746 37761<br />
Midwest 6,463 8,479 12,345 5,770 3,849 3,290 8,153 8,625 3,940 60914<br />
Southwest 8,190 16,184 16,130 14,519 5,180 17,522 43,121 31,476 8,219 160541<br />
West 11,881 17,878 26,993 20,611 8,793 23,773 38,245 24,188 9,169 181531<br />
Total 32,724 50,478 64,069 52,783 24,585 50,630 101,040 74,113 26,497 476919<br />
Pounds <strong>of</strong> Milk (Mil. Lbs)<br />
Northeast 54.6 68.9 92.9 117.7 54.6 43.7 104.3 108.8 41.4 686.9<br />
Southeast 59.1 62.1 63.4 89.0 64.4 65.4 107.2 65.8 40.1 616.5<br />
Midwest 111.6 141.9 209.8 98.9 66.3 64.4 147.3 164.6 65.6 1,070.4<br />
Southwest 146.6 284.0 291.6 279.7 84.6 304.6 844.4 672.1 166.0 3,073.6<br />
West 237.3 351.5 515.9 415.9 161.8 497.9 759.9 511.9 204.7 3,656.8<br />
Total 609.2 908.4 1173.6 1001.2 431.7 976.0 1963.1 1523.2 517.8 9,104.2<br />
Mil. Pounds per Accepted Bid<br />
Northeast 1.37 1.30 2.16 2.68 1.88 1.99 2.54 1.58 1.18 ——-<br />
Southeast 1.85 1.59 1.20 1.46 1.84 2.34 2.06 1.34 1.22 ——-<br />
Midwest 0.79 0.95 1.15 0.83 0.90 1.34 1.18 1.96 1.31 ——-<br />
Southwest 2.71 3.94 3.56 4.99 2.35 7.81 13.40 17.69 7.55 ——-<br />
West 7.42 7.17 6.37 7.85 5.99 10.16 8.84 15.06 14.62 ——-<br />
Total 2.04 2.50 2.66 3.01 2.15 5.25 5.35 5.56 3.36 ——-<br />
Regional Distribution <strong>of</strong> Milk Removed (Percent)<br />
Northeast 9.0 7.6 7.9 11.8 12.6 4.5 5.3 7.1 8.0 7.6<br />
Southeast 9.7 6.8 5.4 8.9 14.9 6.7 5.5 4.3 7.7 7.9<br />
Midwest 18.3 15.6 17.9 9.9 15.4 6.6 7.5 10.8 12.7 12.8<br />
Southwest 24.1 31.3 24.8 27.9 19.6 31.2 43.0 44.1 32.1 33.7<br />
West 39.0 38.7 44.0 41.5 37.5 51.0 38.7 33.6 39.5 38.1<br />
Total 100.0 100.0 100.0 100.0 100.0 100.0 100.0 100.0 100.0 100.0<br />
STATUS OF WISCONSIN AGRICULTURE <strong>2010</strong>—FRAMING THE FINANCIAL CRISIS 33
Regional Changes in Milk<br />
Production During 2009<br />
Despite a difficult financial year,<br />
<strong>Wisconsin</strong> increased its milk production<br />
in the first 11 months <strong>of</strong> 2009.<br />
In contrast to <strong>Wisconsin</strong>, the combined<br />
production in other states has<br />
been declining since March <strong>of</strong> 2008.<br />
Comparing <strong>Wisconsin</strong> milk production<br />
with the western states <strong>of</strong> California,<br />
New Mexico Idaho, and<br />
Texas, only Texas and <strong>Wisconsin</strong><br />
had positive production growth rates<br />
over all <strong>of</strong> 2009. California has<br />
shown a negative growth rate for<br />
all months. Except for the month<br />
<strong>of</strong> January, so has Idaho, the fourthlargest<br />
milk-producing state. New<br />
Mexico’s milk production had<br />
positive growth in the first six<br />
months <strong>of</strong> 2009, but declined July<br />
through November.<br />
The difference in the rates <strong>of</strong> growth<br />
in key dairy states has substantially<br />
affected their 2009 milk production.<br />
In January through November 2009,<br />
the most recent data available, California<br />
produced approximately 3.8<br />
percent less milk than it did in 2008.<br />
In contrast, Texas produced 5.9 percent<br />
more. Through November,<br />
Michigan and <strong>Wisconsin</strong> each<br />
produced about 3 percent more<br />
milk in 2009.<br />
Changes in milk production result from changes in the<br />
number <strong>of</strong> cows being milked and in the average productivity<br />
per cow. <strong>Wisconsin</strong>’s production growth is primarily<br />
due to increased yields resulting from favorable<br />
weather and forage conditions in 2009. The state did<br />
increase its herd size slightly, however, growing by<br />
4,000 cows (0.3 percent) between January and November<br />
2009. Cow numbers declined in most other key<br />
dairy states. California lost 80,000 cows, or 4.3 percent<br />
<strong>of</strong> its herd, between January and November. New Mexico<br />
had the largest relative herd size reduction; its cow<br />
numbers declined 5.7 percent. Over the same period, the<br />
U.S. dairy herd shrank by 242,000 cows, or 2.6 percent.<br />
In contrast to these declines in dairy herd size, average<br />
milk yields increased in most states between 2008 and<br />
2009. <strong>Wisconsin</strong> had particularly strong gains in percow<br />
productivity in the latter half <strong>of</strong> 2009. These<br />
increases in yield likely resulted from very favorable<br />
weather conditions for many producing areas as well as<br />
Percent<br />
6<br />
5<br />
4<br />
3<br />
2<br />
1<br />
0<br />
-1<br />
-2<br />
-3<br />
Jan-08<br />
Monthly Change in Milk Production from Previous Year<br />
Mar-08<br />
-3.77<br />
May-08<br />
Jul-08<br />
-1.30<br />
All Other States<br />
Sep-08<br />
*Calculations are based on 30-day months<br />
to account for leap year in 2008<br />
Change in Milk Production,<br />
Selected States and U.S., Jan-Nov 2009 vs. 2008<br />
US -0.04<br />
PA -0.03<br />
NY<br />
MI<br />
WI<br />
NM<br />
TX<br />
CA<br />
ID<br />
0.25<br />
-5 -4 -3 -2 -1 0 1 2 3 4 5 6 7<br />
Percent<br />
34 STATUS OF WISCONSIN AGRICULTURE <strong>2010</strong>—FRAMING THE FINANCIAL CRISIS<br />
Nov-08<br />
Jan-09<br />
1.17<br />
<strong>Wisconsin</strong><br />
the elimination <strong>of</strong> less productive dairy herds or cows.<br />
In contrast, the average milk yields in California<br />
decreased during 2009. These results reflect the combined<br />
effect <strong>of</strong> changes in herd size and age composition,<br />
feed quality, feeding rates and weather.<br />
Implications for Cheese Manufacturing<br />
Mar-09<br />
The cheese market is strong and growing rapidly. Over<br />
the last 30 years, per capita consumption <strong>of</strong> fluid milk<br />
has decreased by more than 20 percent, while per capita<br />
consumption <strong>of</strong> cheese has increased by more than 85<br />
percent. When the dust settles from the 2009 dairy crisis,<br />
<strong>Wisconsin</strong> will be in an improved market position<br />
compared to other major cheese-producing states.<br />
A majority <strong>of</strong> the milk produced in <strong>Wisconsin</strong> is used to<br />
manufacture cheese. <strong>Wisconsin</strong> leads the nation in<br />
cheese production, accounting for 25.4 percent <strong>of</strong> total<br />
U.S. production in 2008. California ranked second with<br />
a 21.6 percent share. Among federal milk marketing<br />
May-09<br />
3.13<br />
3.15<br />
Jul-09<br />
Sep-09<br />
5.86<br />
Nov-09
orders (FMMOs), the Upper Midwest order, which<br />
includes <strong>Wisconsin</strong>, is the most dependent on the cheese<br />
market—more than three-quarters <strong>of</strong> milk deliveries are<br />
used to manufacture cheese. Slightly more than 43 percent<br />
<strong>of</strong> the milk produced in California was used to<br />
make cheese in 2008.<br />
Under both the California and FMMO pricing systems,<br />
wholesale Cheddar cheese prices are the primary determinant<br />
<strong>of</strong> the price <strong>of</strong> milk used to make cheese. During<br />
2008, the average monthly Cheddar cheese price was<br />
$1.90 under FMMO pricing and $1.87 under California<br />
pricing. For the first 10 months <strong>of</strong> 2009, these prices<br />
averaged $1.24 and $1.23, a decline <strong>of</strong> more than 33<br />
percent. With these prices, the average 2008 announced<br />
price for Class III milk was $17.63 under FMMO and<br />
$17.11 under the California system. In 2009, these<br />
prices both decreased by approximately 37.5 percent.<br />
Given its dependence on the cheese market, it is not surprising<br />
that <strong>Wisconsin</strong> has used its increased milk production<br />
to make more cheese.<br />
California, with its reduced milk<br />
supply and lower price for milk used<br />
for cheese manufacturing, began to<br />
see a general decline in cheese production<br />
early in 2007. In contrast<br />
<strong>Wisconsin</strong> and other milk-producing<br />
states have increased cheese production.<br />
<strong>Wisconsin</strong> produced 3.7 percent<br />
more cheese in Jan.-Oct. 2009 than<br />
over the same period in 2008. Other<br />
U.S. producing regions increased<br />
their production 3.4 percent, except<br />
for California, which decreased<br />
cheese production by 2.5 percent.<br />
This drop in implies that over the<br />
last year, California’s market share<br />
<strong>of</strong> U.S. cheese production has<br />
decreased by almost a full percentage<br />
point.<br />
The implication for <strong>Wisconsin</strong> is<br />
obvious. Our milk is being used<br />
to support a segment <strong>of</strong> the dairy<br />
industry that continues to grow. The<br />
vitality <strong>of</strong> the state’s cheese industry<br />
is evidenced by the continued<br />
growth in the face <strong>of</strong> difficult pricing<br />
conditions. In the end, <strong>Wisconsin</strong>’s<br />
improved market position is a<br />
positive result <strong>of</strong> the poor market<br />
conditions that faced the dairy<br />
industry in 2009.<br />
Summary<br />
The recent downturn in farm milk prices has presented a<br />
challenge to the <strong>Wisconsin</strong> dairy industry. However, at<br />
least as measured by changes in milk production and<br />
income over feed costs, <strong>Wisconsin</strong>’s dairy producers<br />
have fared better than those in some other major milkproducing<br />
areas. Over the last year, <strong>Wisconsin</strong>’s contribution<br />
to the U.S. milk supply has increased along with<br />
its importance in terms <strong>of</strong> cheese production. We have<br />
managed to keep our herd size intact and have reduced<br />
our participation in the voluntary CWT herd reduction<br />
program. Improved milk prices and the state’s capacity<br />
to integrate feed procurement bode well for future<br />
growth in <strong>Wisconsin</strong>’s dairy industry. Looking forward,<br />
we anticipate continued volatility in milk prices. The<br />
challenge for dairy producers will be to adapt their<br />
approach to milk marketing by adopting price risk management<br />
strategies to take advantage <strong>of</strong> favorable prices<br />
when they occur.<br />
Percent <strong>of</strong> MIlk Deliveries Used for Cheese, Federal Milk Marketing<br />
Order Areas and California*<br />
Pacific Northwest<br />
Upper Midwest<br />
MIllion Pounds<br />
California<br />
Southwest<br />
Florida 1.9<br />
Southeast<br />
Appalachia<br />
Northeast<br />
500<br />
400<br />
300<br />
200<br />
100<br />
0<br />
Arizona<br />
Central<br />
Mideast<br />
6.3<br />
16.9<br />
23.6<br />
28.7<br />
34.2<br />
32.7<br />
38.0<br />
38.2<br />
43.2<br />
* January-October 2009 for<br />
Federal Orders; Calendar<br />
Year 2008 for California<br />
0 5 10 15 20 25 30 35 40 45 50 55 60 65 70 75 80 85<br />
Percent<br />
California<br />
<strong>Wisconsin</strong><br />
All Other States<br />
Monthly Cheese Production<br />
Mar 07 Jul 07 Nov 07 Mar 08 Jul 08 Nov 08 Mar 09 Jul 09 Nov09<br />
STATUS OF WISCONSIN AGRICULTURE <strong>2010</strong>—FRAMING THE FINANCIAL CRISIS 35<br />
80.6
The Importance <strong>of</strong> International Trade to <strong>Wisconsin</strong> <strong>Agriculture</strong>5 Ed Jesse and Steven Deller6 Introduction<br />
Any discussion <strong>of</strong> what should be done to help <strong>Wisconsin</strong><br />
farmers recover from the current economic downturn<br />
should consider that an increasingly large share <strong>of</strong> the<br />
state’s dairy and other agricultural products are being<br />
sold outside <strong>of</strong> the United States. As noted in other parts<br />
<strong>of</strong> this report, the global economic collapse that began in<br />
late 2008 sharply reduced agricultural trade. The large<br />
drop in export revenue caused much <strong>of</strong> the fall-<strong>of</strong>f in<br />
U.S. and <strong>Wisconsin</strong> net farm income in 2009. That<br />
means that restoring U.S. farm pr<strong>of</strong>itability<br />
will require economic<br />
recovery in emerging economies that<br />
represent rapidly growing markets<br />
for U.S. farm products, as well as in<br />
120<br />
the United States itself.<br />
100<br />
In this section, we review the growing<br />
importance <strong>of</strong> international trade<br />
80<br />
to U.S. and <strong>Wisconsin</strong> agriculture.<br />
We also assess the “multiplier<br />
60<br />
effect”—the ricocheting impact <strong>of</strong><br />
<strong>Wisconsin</strong> agricultural exports<br />
40<br />
across the state’s economy. In considering<br />
this analysis, keep in mind<br />
20<br />
that in 2008 the nation and <strong>Wisconsin</strong><br />
had record large agricultural<br />
0<br />
exports, meaning that the economic<br />
impacts calculated for that year are<br />
larger than those generated in 2009<br />
and perhaps in <strong>2010</strong>.<br />
U.S. <strong>Agricultural</strong> Exports<br />
Farmers in the United States have<br />
become increasingly reliant on foreign<br />
sales as a source <strong>of</strong> income.<br />
U.S. agricultural exports topped $40<br />
billion in 1981, reached $60 billion<br />
in 1996, and hit a record $115 billion<br />
in 2008.<br />
The value <strong>of</strong> U.S. agricultural<br />
exports has grown at a faster rate<br />
than the value (to farmers) <strong>of</strong> U.S.<br />
crop and livestock production.<br />
Exports are now a leading indicator<br />
<strong>of</strong> farm income. Increases in exports<br />
boost farmers’ cash receipts in the<br />
same year or the following one,<br />
while decreases in exports pull<br />
36 STATUS OF WISCONSIN AGRICULTURE <strong>2010</strong>—FRAMING THE FINANCIAL CRISIS<br />
$Billion<br />
Index, 1982-84=100<br />
350<br />
300<br />
250<br />
200<br />
150<br />
100<br />
50<br />
0<br />
receipts down. 7 This effect is especially pronounced in<br />
2008 and 2009. The record cash receipts enjoyed by<br />
U.S. farmers in 2008 were due in large part to record<br />
U.S. agricultural exports, while the large decline in cash<br />
receipts in 2009 can be directly attributed to an unprecedented<br />
fall-<strong>of</strong>f in the value <strong>of</strong> exports.<br />
Foreign sales are particularly important for U.S. grain,<br />
oilseed and cotton producers. The nation exported more<br />
than half <strong>of</strong> its wheat, rice and cotton harvest in 2007-08<br />
as well as 43 percent <strong>of</strong> its soybeans. And while we<br />
*2009 is Forecast and <strong>2010</strong> in Projected<br />
Source: ERS, USDA<br />
1970 1974 1978 1982 1986 1990 1994 1998 2002 2006 <strong>2010</strong>*<br />
*2009 values are projected<br />
Source: ERS, USDA<br />
Value <strong>of</strong> U.S. <strong>Agricultural</strong> Exports<br />
Fiscal Year (Oct-Sep)<br />
U.S. Farm Cash Receipts and <strong>Agricultural</strong> Exports*<br />
Cash Receipts<br />
Ag Exports<br />
1970 1974 1978 1982 1986 1990 1994 1998 2002 2006 2008<br />
Calendar Year
Major U.S. Export Crops, 2007-08 Crop Years<br />
U.S. U.S. Share <strong>of</strong> U.S. U.S. Share <strong>of</strong><br />
Commodity Production Exports Crop Exported World Exports World Exports<br />
Mil. MT Percent Mil. MT Percent<br />
Corn 331.2 61.9 18.7% 98.61 62.8%<br />
Soybeans 72.9 31.5 43.3% 79.52 39.7%<br />
Wheat 55.8 34.4 61.6% 117.20 29.3%<br />
Rice 6.3 3.4 52.8% 31.09 10.8%<br />
Cotton 4.2 3.0 71.4% 8.35 35.9%<br />
Source: USDA. World <strong>Agricultural</strong> Supply and Demand Estimates, October 2009<br />
exported less than 20 percent <strong>of</strong> our corn, the United<br />
States had a larger share <strong>of</strong> the global market for corn—<br />
63 percent <strong>of</strong> total world exports—than for any other<br />
major U.S. grain crop.<br />
Three crops—soybeans, corn and wheat—accounted for<br />
more than 45 percent <strong>of</strong> U.S. agricultural export value in<br />
2008. Animal products (live animals and meat, poultry<br />
products and dairy products) added another 16 percent,<br />
fruit and vegetable products represented about 10 percent<br />
and cotton comprised 4 percent, while the remaining<br />
25 percent came from a long list <strong>of</strong> products.<br />
The importance <strong>of</strong> agricultural exports to a given state<br />
depends on the mix <strong>of</strong> commodities produced in that<br />
state. California was the leading agricultural exporter<br />
in 2008, because much <strong>of</strong> its large production <strong>of</strong> fruits,<br />
vegetables, tree nuts, rice and cotton was sold overseas.<br />
Several Corn Belt and Great Plains states follow, due to<br />
their feed grain, wheat and oilseed production. <strong>Wisconsin</strong><br />
ranked 15th, with a total agricultural export value<br />
<strong>of</strong> $3 Ubillion.<br />
Dairy Prods<br />
4,099<br />
Cotton<br />
4,782<br />
All Other<br />
28,792<br />
Poultry & Prods<br />
4,922<br />
Vegetables & Preps<br />
5,160<br />
Fruit & Preps<br />
5,926<br />
Live Animals<br />
& Meat<br />
9,455<br />
Soybeans & Prods<br />
19,332<br />
Feed<br />
Grains<br />
18,148<br />
Wheat & Prods<br />
14,836<br />
Values in $Million<br />
Total: $115.5 Billion<br />
Source: ERS, USDA<br />
<strong>Wisconsin</strong> <strong>Agricultural</strong> Exports<br />
<strong>Wisconsin</strong>’s export mix differs significantly from that<br />
<strong>of</strong> the nation, reflecting the unique nature <strong>of</strong> <strong>Wisconsin</strong><br />
agriculture. Not surprisingly, dairy products—primarily<br />
cheese and whey products—accounted for nearly a third<br />
<strong>of</strong> total <strong>Wisconsin</strong> export value in 2008. Next came feed<br />
grains (mainly corn), soybeans, live animals and meat,<br />
and vegetables. Together, these commodity groups represented<br />
75 percent <strong>of</strong> <strong>Wisconsin</strong>’s export value.<br />
<strong>Wisconsin</strong> led the nation in dairy exports in 2008,<br />
accounting for nearly one-fourth <strong>of</strong> the nation’s total <strong>of</strong><br />
$4.1 billion. California, which dominates in exports <strong>of</strong><br />
nonfat dry milk, was in second place, followed by New<br />
York. Exports from these three states represented more<br />
than half <strong>of</strong> the total value <strong>of</strong> U.S. dairy exports.<br />
<strong>Wisconsin</strong> also ranked among the top ten in exports<br />
<strong>of</strong> vegetables (6th), hides and skins (4th) and animal<br />
fats (5th).<br />
U.S. Exports <strong>of</strong> <strong>Agricultural</strong> Products, FY 2008 U.S. <strong>Agricultural</strong> Exports by State, FY 2008<br />
U<br />
All Other<br />
States 36.5<br />
WI 3.0<br />
SD 3.0<br />
NC 3.1<br />
WA 3.2<br />
AR 3.2<br />
MO 3.2<br />
CA 13.7<br />
IA 7.9<br />
KS 5.9<br />
IL 7.5<br />
TX 6.0<br />
NB 5.9<br />
MN 5.5<br />
IN 3.8<br />
ND 3.9<br />
Values in $Billion<br />
Total: $115.5 Billion<br />
Source: ERS, USDA<br />
STATUS OF WISCONSIN AGRICULTURE <strong>2010</strong>—FRAMING THE FINANCIAL CRISIS 37
W<br />
U p y y ,<br />
<strong>Wisconsin</strong> Exports <strong>of</strong> <strong>Agricultural</strong> Products, FY 2008 U.S. Exports <strong>of</strong> Dairy Products by State, FY 2008<br />
Poultry & Prods<br />
117<br />
Wheat & Prods<br />
139<br />
Hides & Skins<br />
174<br />
Vegetables<br />
& Preps<br />
180<br />
$Million<br />
Live<br />
Animals &<br />
Meat<br />
237<br />
3,200<br />
2,800<br />
2,400<br />
2,000<br />
1,600<br />
1,200<br />
800<br />
400<br />
0<br />
All Other<br />
320<br />
Soybeans & Prods<br />
364<br />
Dairy Products<br />
949<br />
Feed Grains<br />
531<br />
Values in $Million<br />
Total: $3.0 Billion<br />
Source: ERS, USDA<br />
<strong>Wisconsin</strong> <strong>Agricultural</strong> Exports<br />
All Other <strong>Agricultural</strong> Products<br />
1975 1979 1983 1987 1991 1995 1999 2003 2007<br />
<strong>Wisconsin</strong> <strong>Agricultural</strong> Exports, FY1999 and FY2008<br />
Product 1999 2008 Change, 1999-2008<br />
$Million $Million Percent<br />
Dairy Products 221 949 729 330%<br />
Feed Gains 275 531 256 93%<br />
Soybeans & Prods. 147 364 216 147%<br />
Live Animals & Meat 186 237 51 28%<br />
Vegetables & Preps. 128 180 52 40%<br />
Hides & Skins 74 174 101 136%<br />
Wheat & Prods. 23 139 116 505%<br />
Poultry & Prods. 38 117 79 211%<br />
Feeds and Fodders 38 70 32 85%<br />
Fats, oils, & Greases 25 51 26 101%<br />
Fruit & Preps. 13 33 20 158%<br />
Seeds 3 4 1 22%<br />
Other 86 162 77 89%<br />
Total 1,256 3,010 1,754 140%<br />
38 STATUS OF WISCONSIN AGRICULTURE <strong>2010</strong>—FRAMING THE FINANCIAL CRISIS<br />
<strong>Wisconsin</strong> agricultural exports grew<br />
slowly but steadily from 1973 to 2005,<br />
from less than $200 million to $1.5 billion,<br />
and then nearly doubled between<br />
2005 and 2008. This recent surge in<br />
value reflects both larger volumes <strong>of</strong><br />
dairy exports and much higher world<br />
prices for most commodities.<br />
Except for wheat exports (which reflect<br />
exceptionally high world prices in<br />
2008), dairy exports showed the largest<br />
percentage growth and accounted for<br />
more than 40 percent <strong>of</strong> the total<br />
increase in export value between 1999<br />
and 2008. Growth in the value <strong>of</strong> poultry<br />
exports was greater than that <strong>of</strong> live<br />
animals and meats, reflecting rapid<br />
growth in export markets for broilers<br />
and turkeys as well as the expansion <strong>of</strong> <strong>Wisconsin</strong>’s<br />
poultry industry. Fruit exports (cranberry products)<br />
reached $33 million in 2008, small in comparison to<br />
vegetable exports (mainly frozen potato products), but<br />
growing at a faster rate.<br />
Economic Impact <strong>of</strong> <strong>Wisconsin</strong> <strong>Agricultural</strong><br />
Exports<br />
Dairy Products<br />
All Other<br />
1,227<br />
Pennsylvania<br />
143<br />
New Mexico<br />
179<br />
Minnesota<br />
191<br />
Idaho<br />
240<br />
New York<br />
333<br />
<strong>Wisconsin</strong><br />
949<br />
California<br />
838<br />
Values in $Million<br />
Total: $4.1 Billion<br />
Source: ERS, USDA<br />
The impact <strong>of</strong> agricultural exports is felt throughout<br />
<strong>Wisconsin</strong>. If <strong>Wisconsin</strong> lost its $3 billion in agricultural<br />
exports (without a commensurate gain in domestic<br />
sales), the state would also lose not just $3 billion, but a<br />
total <strong>of</strong> $4.5 billion in industrial sales.<br />
That’s because, for every dollar <strong>of</strong> agricultural foreign<br />
exports, there is an additional 49 cents in industrial sales<br />
elsewhere within the <strong>Wisconsin</strong> economy. Part <strong>of</strong> this<br />
multiplier effect represents farmers’ purchases <strong>of</strong> input
Economic Impact <strong>of</strong> <strong>Wisconsin</strong> <strong>Agricultural</strong> Exports, FY2008<br />
Direct Indirect Induced Total Multiplier<br />
Industry Sales ($Mil.) 3,010.0 1,146.0 340.4 4,496.5 1.494<br />
Employment 34,068.0 10,116.0 3,281.0 47,464.0 1.393<br />
Employee Compensation ($Mil.) 166.9 268.4 98.2 533.5 3.196<br />
Proprietors Income ($Mil.) 44.4 47.1 10.4 101.9 2.294<br />
Total Income ($Mil.) 967.0 554.1 189.0 1,710.2 1.768<br />
supplies, equipment and other non-labor related<br />
expenses. A much smaller part comes from labor-related<br />
expenditures—workers spending their income in the<br />
local economy.<br />
Producing $3 billion worth <strong>of</strong> agricultural exports<br />
directly supports just over 34,000 jobs, but that increases<br />
to about 47,500 jobs once the multiplier effect is considered.<br />
These exports generated about $533 million in<br />
wages and salaries, $102 million in proprietor income<br />
and nearly $1.7 billion in total income. Every dollar <strong>of</strong><br />
income generated in <strong>Wisconsin</strong>’s agricultural sector to<br />
supply the $3 billion in foreign exports generated an<br />
additional 77 cents elsewhere in the state’s economy.<br />
Through the multiplier effect, nearly every sector in<br />
<strong>Wisconsin</strong> is touched by agricultural foreign exports.<br />
The economic activity required to produce the $3 billion<br />
worth <strong>of</strong> agricultural exports accounts for the large<br />
impacts not just in the agricultural sector, but also in<br />
forestry, fishing and hunting and manufacturing. About<br />
$43 million in new sales is generated in the utilities<br />
industry alone, with 73 jobs created and almost $29 million<br />
in total income. The finance and insurance industry<br />
accounts for $114 million in new sales due to agricultural<br />
exports along with 800 jobs and about $70 million<br />
in total income. Even <strong>Wisconsin</strong>’s arts, entertainment<br />
and recreational industry benefits from the state’s agricultural<br />
exports. Wages and salaries spent on the arts,<br />
entertainment and recreation generated $5.5 million in<br />
sales, along with 140 jobs and $3 million in total income.<br />
Clearly, the state’s foreign agricultural export markets<br />
are becoming increasingly important not just to the<br />
farm sector but also to the larger <strong>Wisconsin</strong> economy.<br />
As these foreign markets expand and <strong>Wisconsin</strong> agriculture<br />
is better positioned to capture them, the entire state<br />
will benefit.<br />
Distribution <strong>of</strong> the Economic Impact <strong>of</strong> <strong>Wisconsin</strong> <strong>Agricultural</strong> Exports, FY2008<br />
Industry Employee Proprietors Total<br />
Sales Employment Comp. Income Income<br />
$Million $Million. $Million $Million<br />
Ag, Forestry, Fish & Hunting 2,793.5 36,562 155.6 55.5 984.7<br />
Mining 1.6 5 0.1 0.3 1.0<br />
Utilities 43.4 73 7.7 0.6 28.7<br />
Construction 25.4 245 9.3 2.1 12.3<br />
Manufacturing 762.2 2,214 108.3 3.6 146.3<br />
Wholesale Trade 109.0 680 38.4 3.3 70.0<br />
Retail Trade 45.2 800 17.4 1.8 30.9<br />
Transportation & Warehousing 81.6 636 27.2 3.6 42.2<br />
Information 20.3 85 4.0 0.3 8.7<br />
Finance & Insurance 114.0 802 38.7 2.5 69.7<br />
Real Estate & Rental 207.5 1,516 13.6 12.7 159.1<br />
Pr<strong>of</strong>., Scientific & Tech. Servs. 100.0 1,131 32.9 10.6 52.9<br />
Management <strong>of</strong> Companies 23.1 108 10.4 (0.0) 12.9<br />
Administrative & Waste Services 25.0 447 10.1 1.1 13.9<br />
Educational Services (non-public) 9.2 153 4.2 0.2 4.7<br />
Health & Social Services 54.9 648 27.4 1.6 33.4<br />
Arts, Entertainment & Recreation 5.5 142 2.2 0.2 3.0<br />
Accommodation & Food Services 30.2 614 8.5 0.6 13.5<br />
Other Services 29.4 496 10.4 1.3 14.5<br />
Government & Non-classified 15.4 109 7.1 - 7.9<br />
Total 4,496.5 47,464 533.5 101.9 1,710.2<br />
STATUS OF WISCONSIN AGRICULTURE <strong>2010</strong>—FRAMING THE FINANCIAL CRISIS 39
A Scan <strong>of</strong> the Farm-Level Financial Situation At the End <strong>of</strong> 2009<br />
Paul Dietmann 8<br />
As discussed elsewhere this publication, 2009 was a very<br />
difficult year for dairy producers. Very low milk prices,<br />
high production costs and severe constraints in agricultural<br />
credit markets combined to create one <strong>of</strong> the most<br />
serious cash flow crises in memory. Nobody expected<br />
milk prices to remain in the neighborhood <strong>of</strong> $20/hundredweight<br />
indefinitely, but the speed <strong>of</strong> the price drop<br />
caught most producers <strong>of</strong>f-guard and unable to adjust<br />
quickly enough to mitigate the negative impacts <strong>of</strong> the<br />
decline. This article considers some <strong>of</strong> the farm-level<br />
ramifications <strong>of</strong> the financial difficulties the dairy industry<br />
faced in 2009.<br />
How much debt was added in 2009?<br />
<strong>Wisconsin</strong> dairy industry prognosticators generally<br />
agree that in 2009, our dairy farmers likely suffered<br />
roughly a $1,000/cow loss for the year. Given that we<br />
have about 1.25 million dairy cows in <strong>Wisconsin</strong>, a back<strong>of</strong>-the-envelope<br />
calculation would suggest that our dairy<br />
producers added $1.25 billion <strong>of</strong> debt in 2009. But while<br />
producers may have lost $1,000/cow, the addition to their<br />
debt load is much lower, because losses do not equal<br />
added debt.<br />
Loss predictions are generally based on the average<br />
expected monthly gross revenue per cow minus the average<br />
monthly cost <strong>of</strong> production (COP). COP typically<br />
includes all variable and overhead costs on a cash basis.<br />
In other words, the calculation assumes that all production<br />
costs are being paid in the current month using cash<br />
from that month’s gross income. Overhead costs in the<br />
calculation <strong>of</strong>ten include a charge that represents a return<br />
to the owner’s labor, management and equity investment<br />
in the farm operation. But most producers take a smaller<br />
family living draw during difficult times, so such a “loss”<br />
does not mean that money will need to be borrowed to<br />
<strong>of</strong>fset it.<br />
A number <strong>of</strong> other adjustments to COP estimates must<br />
be made to arrive at an estimate <strong>of</strong> added debt load. The<br />
first involves prepayment <strong>of</strong> expenses. In 2007 and 2008,<br />
dairy producers enjoyed two <strong>of</strong> the best years in recent<br />
history. Not all producers were flush with cash, but many<br />
were more concerned about managing income tax liability<br />
than about generating enough income to cover operating<br />
expenses. Interest rates on savings, money market<br />
funds, and CDs were in the 1 percent range, so there was<br />
no incentive to build cash reserves. Some producers paid<br />
for intermediate capital investments such as equipment<br />
and buildings out <strong>of</strong> current cash flow. Others chose to<br />
pay down term debt. Some chose to prepay operating<br />
40 STATUS OF WISCONSIN AGRICULTURE <strong>2010</strong>—FRAMING THE FINANCIAL CRISIS<br />
expenses, but given extraordinarily high prices for<br />
fertilizer, seed, and feed at the end <strong>of</strong> 2008, this was<br />
not a very attractive option for most inputs (fuel was the<br />
exception). Even so, it is likely that many producers prepaid<br />
at the end <strong>of</strong> 2008 for at least a portion <strong>of</strong> their 2009<br />
inputs to reduce their tax liabilities.<br />
Another adjustment to COP involves the valuation <strong>of</strong><br />
home-raised feeds. Feed is generally the largest expense<br />
for dairy and other livestock operations. COP estimates<br />
<strong>of</strong>ten value home-raised feeds at current market prices.<br />
This assumes that all feed (home-raised and purchased)<br />
is a cash expense during the current month. In reality,<br />
during 2009 many producers were feeding corn and corn<br />
silage that had been produced and stored in the fall <strong>of</strong><br />
2008. The cost <strong>of</strong> that feed was the cost to plant the crops<br />
in May 2008 plus the cost incurred in the fall to harvest<br />
and store them—not their market value when fed. Thus,<br />
producers in <strong>Wisconsin</strong> who raised their own feed were<br />
not necessarily incurring losses equal to the market value<br />
<strong>of</strong> that feed.<br />
Also not considered in COP calculations is income from<br />
sources other than milk, cull cows and bull calves. Survey<br />
data from the USDA Economic Research Service<br />
(2007) indicates that the average <strong>Wisconsin</strong> dairy farm<br />
had $14,278 <strong>of</strong> crop sales, which is roughly 4 percent<br />
<strong>of</strong> gross farm income. A number <strong>of</strong> our producers do an<br />
excellent job <strong>of</strong> raising calves and experience low cull<br />
rates; thus they have excess breeding stock to sell, which<br />
is not included in estimated income. With the advent <strong>of</strong><br />
sexed semen, there are more heifers being born and so<br />
more surplus breeding stock to market.<br />
COP also doesn’t reflect <strong>of</strong>f-farm income. USDA-ERS<br />
data shows that the average U.S. dairy farm operator<br />
works 100 hours <strong>of</strong>f-farm each year and has a spouse<br />
who works 400 hours. It’s a bit hard to believe that the<br />
average <strong>Wisconsin</strong> dairy farmer works 100 hours <strong>of</strong>ffarm<br />
each year, but it seems quite plausible that the average<br />
dairy farm household generates income from 500<br />
hours <strong>of</strong> <strong>of</strong>f-farm employment each year. At $10 per<br />
hour, that would add $5,000 per year to the household<br />
income <strong>of</strong> the average dairy farm family.<br />
The income side <strong>of</strong> the COP calculation typically<br />
includes the projected Milk Income Loss Contract<br />
(MILC) payment for the month. However, producers can<br />
only receive payments on 2.985 million pounds <strong>of</strong> milk<br />
during the federal fiscal year. A 200-cow dairy with an<br />
average production <strong>of</strong> 23,000 pounds/cow/year would<br />
have exhausted their MILC eligibility in August <strong>of</strong> 2009.<br />
The income side also does not consider the positive
impact experienced by producers who forward-contracted<br />
milk in 2008 for 2009 delivery.<br />
Taking into account all <strong>of</strong> these adjustments needed to<br />
bring calculated COP into line with the real world, along<br />
with the cost-cutting measures taken by dairy producers<br />
in 2009, actual cash losses and added debt are likely to<br />
be significantly less than suggested by raw numbers<br />
based on cash-flow deficits. In Section 1 <strong>of</strong> this report,<br />
Jesse and Jones estimate that dairy farms in total added<br />
$245 million in debt in 2009, or about one-fifth <strong>of</strong> the<br />
added debt calculated using the back-<strong>of</strong>-the-envelope<br />
estimate <strong>of</strong> $1,000 per cow.<br />
What is the impact on producers?<br />
All producers have been affected by the economic situation<br />
in 2009, but some have suffered more than others.<br />
A dairy operation’s debt load, debt structure, timing<br />
<strong>of</strong> major capital investments, purchased feed cost and<br />
reliance on paid labor all affect the producer’s level <strong>of</strong><br />
financial strain. In addition, weather exacerbated the<br />
financial suffering <strong>of</strong> some producers—in particular,<br />
those who endured a multi-year drought in northern <strong>Wisconsin</strong><br />
or two years <strong>of</strong> flooding in parts <strong>of</strong> the south.<br />
One indicator <strong>of</strong> financial stress is the volume <strong>of</strong> calls to<br />
the <strong>Wisconsin</strong> Farm Center’s farmers’ assistance hotline.<br />
The number <strong>of</strong> calls began to increase in early 2008 as<br />
production expenses rose and took a large jump in early<br />
2009 after milk prices crashed. Some callers were on the<br />
verge <strong>of</strong> bankruptcy or foreclosure. Some had no food<br />
and no money to buy it. Some could no longer afford to<br />
pay their health insurance premiums. An increasing number<br />
<strong>of</strong> callers have faced utility disconnection due to<br />
unpaid bills. This level <strong>of</strong> stress is taking a toll on families.<br />
We have fielded calls from producers contemplating<br />
suicide and from family members concerned about<br />
domestic abuse. This highlights the gravity <strong>of</strong> the situation<br />
for many farmers. Clearly the impact goes far<br />
beyond economic hardship.<br />
Despite the increased traffic to the Farm Center hotline<br />
and the substantial difficulties faced by many producers<br />
in 2009, a relatively small number <strong>of</strong> the state’s milk producers<br />
are in imminent danger <strong>of</strong> going out <strong>of</strong> business.<br />
The most vulnerable were victims <strong>of</strong> poor timing—operators<br />
who started their dairy operations or undertook a<br />
major expansion or other capital investment in the past<br />
two years, or lost an <strong>of</strong>f-farm job, or faced significant<br />
weather challenges in the 2007 or 2008 growing seasons.<br />
Producers who had to purchase significant amounts <strong>of</strong><br />
feed in 2008 were generally left in a precarious financial<br />
position at the beginning <strong>of</strong> 2009.<br />
Producers who entered 2009 with high debt levels on<br />
a per-cow basis were in serious trouble at year’s end.<br />
Many highly leveraged producers were denied additional<br />
credit to carry them through this period <strong>of</strong> low prices and<br />
have been unable to pay operating expenses. Some used<br />
credit card debt to maintain their operations. These producers<br />
are accruing interest at rates much higher than<br />
those being paid at the height <strong>of</strong> the farm crisis <strong>of</strong> the<br />
1980s. The Farm Center has worked with producers who<br />
are carrying credit card debt well in excess <strong>of</strong> $100,000<br />
and accruing interest at rates as high as 29 percent.<br />
On the other end <strong>of</strong> the spectrum, some producers<br />
employed a more fiscally conservative approach and<br />
entered 2009 with significant prepaid expenses and<br />
strong cash reserves. A financial analysis in the summer<br />
<strong>of</strong> 2009 <strong>of</strong> one extraordinarily well-managed 180-cow<br />
operation provides a pr<strong>of</strong>ile <strong>of</strong> prudent farm financial<br />
management. The operation has no debt. The owners<br />
prepaid all <strong>of</strong> their fuel and seed and a significant portion<br />
<strong>of</strong> their fertilizer and feed at the end <strong>of</strong> 2008. Their highproducing<br />
herd is milked in a parlor retr<strong>of</strong>itted into an<br />
old stanchion barn. They raise and sell excess crops and<br />
breeding stock. The two families that own this operation<br />
each took sizeable living draws from the dairy in 2008<br />
and made significant contributions to a Simplified<br />
Employee Pension (SEP) plan. None <strong>of</strong> the four owners<br />
work <strong>of</strong>f-farm. This farm was still operating at a pr<strong>of</strong>it<br />
through the summer <strong>of</strong> 2009.<br />
Larger-scale producers tended to be in a more vulnerable<br />
position than smaller, family-scale operators. Larger<br />
operations exhausted their MILC payments earlier in the<br />
year. They are also likely to have payroll obligations that<br />
need to be met, while operations that primarily rely on<br />
family labor will <strong>of</strong>ten forego family living withdrawals<br />
when times are tough. Many large operations are buying<br />
significant quantities <strong>of</strong> feed and have other operating<br />
expenses such as manure pumping/hauling that require a<br />
cash outlay rather than the use <strong>of</strong> unpaid family labor.<br />
These expenses require cash and tend to be fairly inflexible.<br />
On the other hand, larger operations tend to be more<br />
likely to use futures markets or other forward-contracting<br />
strategies to manage the risk <strong>of</strong> price fluctuations, and<br />
may have mitigated some <strong>of</strong> the losses stemming from<br />
these ongoing costs. Nevertheless, an agricultural lender<br />
recently commented to the Farm Center that his smallerscale<br />
dairy farm customers were losing $50-75/cow each<br />
month, while his large-scale producers were losing<br />
$150/cow or more.<br />
How much debt can farmers handle?<br />
Will additional debt bury <strong>Wisconsin</strong> dairy producers,<br />
or will they be able to service it? Many went into<br />
2009 with relatively strong financial positions, which<br />
improved their ability to survive such a difficult year.<br />
And farm equity has been rising since 1987 and has risen<br />
at a remarkably rapid rate since 2000 (see Section I).<br />
Equity is important, because it represents a reserve that<br />
STATUS OF WISCONSIN AGRICULTURE <strong>2010</strong>—FRAMING THE FINANCIAL CRISIS 41
can be borrowed against to get through difficult times.<br />
Unfortunately, dairy producers’ equity declined in 2009,<br />
since cows are worth much less today than they were a<br />
year ago. Machinery seems to be holding its value. The<br />
value <strong>of</strong> land has not been well-tested by the market,<br />
but it was previous noted that farmland fell in value by<br />
3 percent in 2009. But despite an aggregate drop in<br />
equity, many producers should still be in a strong<br />
enough position to collateralize additional debt as<br />
long as loan funds are available.<br />
Borrowing money is one thing, paying it back is another.<br />
In the current economy, cash is king. Much more important<br />
than the amount <strong>of</strong> equity that farmers can use as<br />
collateral for new loans is their ability to cover additional<br />
principal and interest payments with available<br />
cash flows. Lenders aren’t deciding to loan funds based<br />
on equity, but rather on the producer’s ability to generate<br />
enough net cash farm income to make loan payments. A<br />
producer with marginal cash flow is simply not able to<br />
borrow money in the conventional credit market.<br />
As a result <strong>of</strong> the sub-prime lending debacle, all lenders<br />
are under greater scrutiny by regulators. They are being<br />
forced to hold larger loan loss reserves, which reduce<br />
funds available for loans. Loans that are not performing<br />
according to terms are being downgraded, which limits<br />
lenders’ ability to extend additional credit to those borrowers.<br />
Banks are very concerned about their risk ratings.<br />
A reduced rating inhibits a bank’s ability to raise<br />
capital to lend. Also, in recent years some <strong>Wisconsin</strong><br />
community banks were sold to larger banks that have<br />
little experience in agricultural lending. These banks do<br />
not seem to be interested in increasing their farm loan<br />
portfolios, and some seem to be trying to jettison their<br />
agricultural borrowers.<br />
U.S. farmers are generally conservative in their borrowing,<br />
even when their income increases. From the late<br />
1980’s through recent years, the aggregate level <strong>of</strong> farm<br />
debt has been less than half <strong>of</strong> the maximum amount <strong>of</strong><br />
debt that farmers could theoretically service with farm<br />
income. Approximately 70 percent <strong>of</strong> U.S. farmers hold<br />
no debt. However, the farm operations carrying debt<br />
tend to be those with higher gross sales <strong>of</strong> agricultural<br />
products and account for the majority <strong>of</strong> the country’s<br />
production (see Section I). Farmers who carry debt<br />
generally have more than enough equity to adequately<br />
collateralize loans, but many had trouble making loan<br />
payments in 2009 because <strong>of</strong> negative cash flow.<br />
Who is carrying the debt now?<br />
Many farmers have balance sheets strong enough to<br />
enable them to take on additional debt. Net cash flows<br />
are likely to soon return to levels that will allow farmers<br />
to cover payments on that debt. The challenge is in gaining<br />
access to additional capital through commercial<br />
credit markets. These markets are all but frozen right<br />
now. Commercial lenders are not eager to loan capital<br />
at a time when farm cash flows are inadequate to service<br />
new debt. Also, lenders report that they are spending<br />
a significant amount <strong>of</strong> time servicing existing loans<br />
(deferring principal payments, rescheduling or restructuring<br />
debt, etc.) so they are not inclined to write<br />
new ones.<br />
Federal and state loan programs have proven to be<br />
important sources <strong>of</strong> credit. The <strong>Wisconsin</strong> USDA Farm<br />
Service Agency Farm Loan Program made $86 million<br />
in direct operating loans to <strong>Wisconsin</strong> farmers in the fiscal<br />
year ending September 30, 2009 and provided guarantees<br />
to back another $98.5 million in operating loans.<br />
The WHEDA CROP Loan program this year has provided<br />
guarantees backing $27 million in commercial<br />
operating credit. Approximately 72 percent <strong>of</strong> the CROP<br />
guaranteed loans went to dairy producers.<br />
While additional credit is being extended to the most<br />
financially sound borrowers by commercial lenders and<br />
the Farm Credit System, a considerable amount <strong>of</strong> debt<br />
is being accumulated on credit cards, Farm Plan and<br />
other revolving credit products. The allocation <strong>of</strong> this<br />
debt is difficult to quantify. Anecdotal evidence suggests<br />
that a significant amount <strong>of</strong> debt is also being held by<br />
unwilling lenders: farm supply companies, custom<br />
operators, veterinarians, utility companies and others<br />
who provide products or services to farmers. The risk<br />
is mounting that some <strong>of</strong> those businesses could fail<br />
because <strong>of</strong> large accounts receivable balances. The<br />
debt held by suppliers and service providers needs to<br />
be transferred to commercial lenders, where it can be<br />
structured and amortized to reduce the risk <strong>of</strong> default.<br />
The current situation is precarious and unsustainable,<br />
because farmers will be forced into bankruptcy and will<br />
pull their suppliers in that direction.<br />
Risks going forward<br />
42 STATUS OF WISCONSIN AGRICULTURE <strong>2010</strong>—FRAMING THE FINANCIAL CRISIS<br />
Risk <strong>of</strong> subsequent volatility in agricultural product<br />
markets. The pressure on dairy producers appears to be<br />
easing. At the end <strong>of</strong> 2009, milk prices were rebounding<br />
and production costs were on the decline. <strong>Wisconsin</strong>’s<br />
milk production not only held up through the crisis but<br />
increased to break a long-standing record. However, it<br />
will take three to five years for farmers to recover from<br />
the lingering effects <strong>of</strong> 2009. Many producers who survived<br />
2009 would not be able to withstand another<br />
extended period <strong>of</strong> negative cash flow. A comparable<br />
cost-price squeeze would cause the loss <strong>of</strong> many more<br />
dairy farms and jeopardize <strong>Wisconsin</strong>’s dairy industry.<br />
Risk <strong>of</strong> drastic declines in land values. The market<br />
value <strong>of</strong> dairy cows has declined by about one-third over<br />
the past year. Land values appear to have declined<br />
slightly, although the market has been largely untested.
Lenders are very nervous about the potential for rapid<br />
erosion <strong>of</strong> asset values. Many lenders have been updating<br />
balance sheets semi-annually or even quarterly for their<br />
most highly leveraged farm borrowers. If we begin to see<br />
forced sales <strong>of</strong> farmland, land values could decline<br />
quickly, creating a snowball effect and making it even<br />
harder for farmers to get credit.<br />
Risk <strong>of</strong> slow stabilization <strong>of</strong> agricultural credit markets.<br />
The longer it takes for credit to become more readily<br />
available, the larger the number <strong>of</strong> farms that will be<br />
pushed out <strong>of</strong> business. Producers have become heavily<br />
dependent on access to credit. Denying that access is like<br />
denying access to other production inputs; farmers can<br />
survive for a while but ultimately won’t be able to remain<br />
competitive and their businesses will perish. Banks need<br />
to have their confidence in the dairy industry restored to<br />
get credit flowing again.<br />
Risk <strong>of</strong> failure <strong>of</strong> a major agricultural lender. The failure<br />
<strong>of</strong> New Frontier Bank, based in Greeley, Colorado,<br />
illustrates the dangers facing agricultural borrowers if<br />
their lending institution goes bust. New Frontier failed in<br />
April, 2009. On August 18, the FDIC auctioned <strong>of</strong>f 418<br />
agricultural loans with a total book value <strong>of</strong> $455 million.<br />
The auction was conducted online and results will not be<br />
made public for months. In past FDIC auctions, loans<br />
sold at a 25–50 percent discount to book value. Borrowers<br />
with large loan balances who were successfully making<br />
their scheduled principal and interest<br />
payments have been unable to find other lenders willing<br />
to take them on. Borrowers who were not meeting loan<br />
payment obligations worry that successful bidders will<br />
quickly foreclose and seize and sell farms in order to<br />
pr<strong>of</strong>it from their loan purchases. A recent piece on the<br />
Brownfield Network indicated that at least six dairy<br />
producers who had loans with New Frontier have filed<br />
for bankruptcy to protect their assets against actions by<br />
those who bought their loans.<br />
Risk <strong>of</strong> failure <strong>of</strong> farm suppliers or service providers.<br />
If farm suppliers and service providers are unable to<br />
collect the bills owed to them, there is a risk that some<br />
<strong>of</strong> them could go out <strong>of</strong> business. The loss <strong>of</strong> these businesses<br />
could result in less competition and longer travel<br />
distances to obtain needed products and services, thus<br />
driving up production costs. And if the business in question<br />
is a farmer cooperative, farmer members will lose<br />
their equity in the co-op.<br />
What will be different after 2009?<br />
The events <strong>of</strong> 2009 will change farm financial management.<br />
While the farm crisis <strong>of</strong> the 1980’s stemmed from<br />
inadequate levels <strong>of</strong> equity, the current crisis is related to<br />
cash flow, so cash management will become much more<br />
important in the future. Prior to this year, farmers had<br />
little incentive to build cash reserves, so they tended to<br />
put excess cash flow to work, investing in new equipment<br />
and buildings or paying down debt. Going forward,<br />
producers will have reason to build cash reserves to help<br />
carry them through lean times. Some lenders are beginning<br />
to require that producers zero out their operating<br />
loans at least one month each year. There is a much<br />
greater emphasis on having working capital in the form<br />
<strong>of</strong> cash rather than in feed inventories, a practice which<br />
has become common in recent years.<br />
This new emphasis on cash management will change<br />
how producers make investment decisions. They will<br />
need to postpone or revise capital investments to preserve<br />
cash. Producers will need to be able to understand and<br />
analyze their financial statements and to stress test any<br />
potential capital investments to gauge how those could<br />
affect their operations in the event <strong>of</strong> a drop in cash flow.<br />
Banks are likely to remain extraordinarily cautious in<br />
their lending to farmers for quite some time. While most<br />
agricultural lenders understand the cyclical nature <strong>of</strong><br />
farming, loan decisions are <strong>of</strong>ten being made far from the<br />
lender’s desk. Some banks have pulled out <strong>of</strong> agricultural<br />
lending altogether, and others are trying to reduce their<br />
exposure in the farm sector. We are hearing reports <strong>of</strong><br />
regulators increasing their scrutiny <strong>of</strong> agricultural loans.<br />
Credit is going to be tighter for a while.<br />
Government assistance in the short term will be important<br />
to restoring confidence in the agricultural credit markets.<br />
The USDA Farm Service Agency has increased the<br />
number <strong>of</strong> direct and guaranteed loans to farmers— a<br />
crucial move. The <strong>Wisconsin</strong> Housing and Economic<br />
Development Authority has also increased its level <strong>of</strong><br />
loan guarantees. Beyond extending additional credit<br />
support, it will be important for UW System institutions<br />
and the <strong>Wisconsin</strong> Technical College System to continue<br />
helping farmers improve their farm financial management<br />
skills.<br />
During 2009, <strong>Wisconsin</strong>’s dairy sector faced some<br />
incredibly difficult challenges, but it will emerge strong.<br />
Producers had invested more than $1 billion in capital<br />
improvements in the five years leading up to 2009,<br />
and dairy processors made an equal investment in their<br />
facilities. <strong>Wisconsin</strong> continued increasing production in<br />
2009 while other regions <strong>of</strong> the country saw precipitous<br />
declines. The structure <strong>of</strong> <strong>Wisconsin</strong>’s dairy industry at<br />
the farm level is more sustainable than in some other<br />
parts <strong>of</strong> the country. Our producers grow a larger percentage<br />
<strong>of</strong> their own feed and have a larger land base that<br />
provides equity to draw upon during tough times. Our<br />
climate is more conducive to growing quality forage. The<br />
expertise and work ethic <strong>of</strong> our producers cannot be beat.<br />
One year <strong>of</strong> extraordinary difficulty will not negate all <strong>of</strong><br />
the positive factors that work in our state’s favor.<br />
STATUS OF WISCONSIN AGRICULTURE <strong>2010</strong>—FRAMING THE FINANCIAL CRISIS 43
Price Stability in an Era <strong>of</strong> Roller-Coaster Rides<br />
Brad Barham 9<br />
In 2008-09, Organic Valley Cooperative undertook an<br />
old-school strategy <strong>of</strong> supply management in the face <strong>of</strong><br />
tremendous downward price pressures on U.S. dairy<br />
markets. Supply management strategies were once commonplace<br />
in U.S. agriculture (Mueller, Helmberger, and<br />
Paterson) and remain a mainstay <strong>of</strong> the Canadian and<br />
European dairy industries. They involve government,<br />
cooperative or other restrictions on production by farmers<br />
to maintain higher prices and price stability. While<br />
the success <strong>of</strong> this strategy depended in part on the<br />
strong market position and high barriers to entry that<br />
exist in the case <strong>of</strong> Organic Valley Cooperative, a deeper<br />
look into this response points out two things pertinent to<br />
the <strong>Wisconsin</strong> dairy industry. One is that farmers working<br />
together can <strong>of</strong>ten find creative ways to achieve their<br />
goals <strong>of</strong> higher income and price stability. The second<br />
is that <strong>Wisconsin</strong>’s diversity <strong>of</strong> farm strategies and<br />
business enterprises provides a basis for resilience<br />
in performance and continued experimentation with<br />
distinctive approaches that is worth noting during<br />
hard times.<br />
What did Organic Valley do to Manage Supply?<br />
As conventional milk prices plummeted in 2009,<br />
Organic Valley made two $1-per-hundredweight cuts in<br />
price in February and May from their $24.75 base price.<br />
Then in July, the cooperative introduced a quota program<br />
that required producers to cut by 7 percent the<br />
amount <strong>of</strong> milk they delivered to the cooperative until<br />
January <strong>of</strong> <strong>2010</strong>. This combination <strong>of</strong> price and volume<br />
reductions during the first seven months <strong>of</strong> 2009 translates<br />
into about a 14 percent reduction in organic sales<br />
revenues for Organic Valley’s nearly 1,000 dairy farm<br />
members nationwide. Averaged over all <strong>of</strong> 2009,<br />
Organic Valley dairy farmers experienced about a<br />
10 percent reduction in revenues, probably less than<br />
one-third that experienced by conventional dairy<br />
farmers, who faced milk price declines averaging well<br />
over 40 percent. This four-fold gap in percent revenue<br />
decline probably understates the pr<strong>of</strong>itability gap that<br />
emerged between organic and conventional dairy<br />
farmers in 2009.<br />
One reason this strategy worked is that Organic Valley is<br />
a lead player in the organic milk market, and other<br />
major private organic processors, such as Horizon and<br />
Hood, also reduced pay prices, revised or did not renew<br />
contracts and reduced purchase volumes. Thus, organic<br />
dairy prices as a whole stabilized in the latter part <strong>of</strong><br />
2009. Members <strong>of</strong> Organic Valley Cooperative avoided<br />
the potential for much larger price and revenue losses<br />
and experienced a less-severe farm income shock in<br />
2009 than did other dairy farmers around the country.<br />
With the current rebound in dairy prices, the worst <strong>of</strong><br />
the most recent price decline may be over, and Organic<br />
Valley’s production quota reductions could be lifted in<br />
part or in full early in <strong>2010</strong>. The upshot is that supply<br />
management is alive and well in the organic dairy sector.<br />
But, the deeper message <strong>of</strong> this article requires some<br />
historical context.<br />
Historical Reflections<br />
44 STATUS OF WISCONSIN AGRICULTURE <strong>2010</strong>—FRAMING THE FINANCIAL CRISIS<br />
Seventeen years ago, I began working as the staff economist<br />
for the UW–Madison’s <strong>Agricultural</strong> Technology<br />
and Family Farm Institute (ATFFI), a research and<br />
extension program that had been recently formed. Now,<br />
we go by the name Program on <strong>Agricultural</strong> Technology<br />
Studies, or PATS (www.pats.wisc.edu). Our mandate is<br />
to study the impact <strong>of</strong> new technologies, public policies<br />
and market trends on <strong>Wisconsin</strong> agriculture, with a special<br />
focus on the welfare <strong>of</strong> family farms.<br />
Over the past two decades, we have conducted numerous<br />
studies that document and explain many changes in<br />
the structure and organization <strong>of</strong> <strong>Wisconsin</strong> agriculture,<br />
including the increased diversity <strong>of</strong> farming systems in<br />
the dairy sector. We have highlighted the dramatic<br />
expansion <strong>of</strong> confinement dairy operations (Barham,<br />
Foltz, and Aldana), the continued importance <strong>of</strong> moderate-sized<br />
conventional dairy farms (Jackson-Smith and<br />
Barham; Jackson-Smith and Buttel) and the emergence<br />
<strong>of</strong> alternative dairy farming systems (Brock and<br />
Barham), including management-intensive rotational<br />
grazing, organic and Amish. Recently, PATS has also<br />
examined the logic and implications <strong>of</strong> the increased use<br />
<strong>of</strong> immigrant workers on <strong>Wisconsin</strong> dairy farms (Harrison,<br />
Lloyd, and O’Kane). Farming systems, and the<br />
faces <strong>of</strong> many <strong>of</strong> the people working those farms, have<br />
changed a lot over the past two decades.<br />
Among the most important findings in this research is<br />
that part <strong>of</strong> the strength and resilience <strong>of</strong> the <strong>Wisconsin</strong><br />
dairy sector comes from its diversity and the capacity <strong>of</strong><br />
farmers to find new, better and distinctive ways to manage<br />
their farms. That diversity is very evident in today’s<br />
dairy sector, as suggested by the many types <strong>of</strong> dairy<br />
farm systems mentioned above. It is also implicitly<br />
highlighted in Brian Gould’s article, which shows that<br />
<strong>Wisconsin</strong> dairy farms have performed relatively well<br />
during the very difficult times <strong>of</strong> the past 18 months.<br />
It is also true that the strength and resilience <strong>of</strong> the <strong>Wisconsin</strong><br />
dairy farm sector derives from the capacity <strong>of</strong>
farmers and other industry participants to work together<br />
in networks, cooperatives, farm groups and other types<br />
<strong>of</strong> organizations. In these collaborative efforts, farmers<br />
discover ways to improve their efficacy on the farm, in<br />
the marketplace and in social and political forums that<br />
shape their well-being. The rest <strong>of</strong> this article explores<br />
one <strong>of</strong> those collaborative efforts, Organic Valley Cooperative,<br />
and how it was able to undertake an effective<br />
supply management strategy in 2009.<br />
The 1990s Call for Price Stability through<br />
Supply Management<br />
Organic Valley’s formation brought together several<br />
currents in <strong>Wisconsin</strong> agriculture. One <strong>of</strong> these, related<br />
to supply management, dates back to the mid 1990s,<br />
when dairy farmers, especially in Western <strong>Wisconsin</strong>,<br />
were discussing the potential <strong>of</strong> farmer-led supply<br />
management initiatives to improve prices. In 1996, Congress<br />
had voted to remove explicit government support<br />
for grain prices, and milk prices were beginning the<br />
rollercoaster ride we have seen over the past 15 years.<br />
As a participant in some <strong>of</strong> those meetings, I witnessed<br />
much heated debate about whether farmer-led supply<br />
management efforts could work, and what support from<br />
the university, state agencies and other leaders might or<br />
might not do.<br />
As a newcomer to <strong>Wisconsin</strong> dairy issues, I was quiet<br />
most <strong>of</strong> the time. When I <strong>of</strong>fered my two-cents, I usually<br />
came across as a wet blanket. It just did not seem feasible<br />
to me that <strong>Wisconsin</strong> dairy farmers could achieve<br />
supply management in the U.S. market without explicit<br />
coordination with the federal government or several<br />
major national processors, and the prospects for support<br />
from those quarters seemed unlikely in an era when<br />
financial markets were booming and market deregulation<br />
was the mantra. Simply put, supply management<br />
policies were out <strong>of</strong> favor politically.<br />
Moreover, as a student <strong>of</strong> cartel<br />
efforts <strong>of</strong> mineral- and even bananaexporting<br />
countries around the<br />
world, the only time I had under-<br />
26<br />
stood those efforts to be effective<br />
24<br />
was when central coordination was<br />
provided by major, low-cost leaders<br />
22<br />
for very critical resources (like oil).<br />
On those occasions, when I was<br />
asked by farmers what I could do to<br />
help, I had little to <strong>of</strong>fer except economic<br />
rationales for government<br />
support that might point to how<br />
improvements in efficiency and productivity<br />
could be associated with<br />
reducing price instability. Needless<br />
to say, the weight <strong>of</strong> history buried<br />
20<br />
18<br />
16<br />
14<br />
12<br />
10<br />
supply management initiatives in conventional dairy<br />
markets, other than occasional voluntary programs. And<br />
while they have been mentioned by some industry participants<br />
during the past 18 months <strong>of</strong> low dairy prices,<br />
they are not really in play in many farm organization<br />
discussions or in federal policy circles.<br />
Organic Milk Supply Management in 2008-09<br />
Take a look now at the figure that compares pay prices<br />
for Organic Valley milk to conventional milk over the<br />
past two decades. It shows the roller-coaster ride <strong>of</strong> conventional<br />
milk prices alongside a mostly steady rise in<br />
the pay price for dairy farmers associated with Organic.<br />
While it is easy to focus on the price premium associated<br />
with organics, which can be quite high at times<br />
(more than $9/hundredweight in 2006), the other major<br />
difference in comparison with conventional milk prices<br />
has been the relative stability <strong>of</strong> organic milk prices.<br />
Until recently, that stability could readily be attributed to<br />
the exponential rise in demand for organic products during<br />
what Organic Valley CEO George Siemon has called<br />
the “organic gold rush” (Siemon). In several years prior<br />
to 2008, Organic Valley experienced more than a 20 percent<br />
annual growth in sales, which explains how the<br />
Cooperative went from under 100 dairy farm members<br />
in the 1990s to more than 1,000 in 2008. A regional<br />
snapshot <strong>of</strong> that growth is illustrated by a time series <strong>of</strong><br />
maps that shows the growth in organic dairy farms in<br />
the six counties closest to Organic Valley’s headquarters<br />
in LaFarge.<br />
There was more to that price stability than just demand<br />
growth, however. From the beginning, Organic Valley<br />
organizers, many <strong>of</strong> whom were active in the 1990s supply<br />
management efforts, have attempted to coordinate<br />
supply (what they call “pools”) with demand at a<br />
regional level. These pools are organized to add produc-<br />
Pay Prices for Organic Valley and Conventional Milk in <strong>Wisconsin</strong><br />
$ per Hundredweight<br />
Organic Valley Pay Price<br />
<strong>Wisconsin</strong> All-Milk Price<br />
1990 1992 1994 1996 1998 2000 2002 2004 2006 2008<br />
STATUS OF WISCONSIN AGRICULTURE <strong>2010</strong>—FRAMING THE FINANCIAL CRISIS 45
Spatial Expansion <strong>of</strong> Organic Dairy Farms in Southwest <strong>Wisconsin</strong><br />
Legend<br />
• Organic farms<br />
•<br />
•<br />
Conventional farms<br />
* Organic Valley<br />
★✪<br />
★✪<br />
5 organic farms<br />
ers commensurate with the cooperative’s penetration<br />
and sales growth in new markets. Each year, contracts<br />
with members coordinate on both price and quantity.<br />
Members seeking to make significant expansions or<br />
increases in production need the Organic Valley’s<br />
explicit permission to add more milk to the cooperative’s<br />
regional pool. In periods <strong>of</strong> rapid demand growth,<br />
quantity restrictions were not much <strong>of</strong> an issue, but they<br />
were written into the contract and in producer’s expansion<br />
plans. This meant that joining Organic Valley<br />
Cooperative was easier during periods <strong>of</strong> initial expansion<br />
into markets than when it had become established<br />
in a market, unless demand growth was strong enough<br />
to warrant adding new members. In other words, for<br />
Organic Valley Cooperative, a fundamental aspect <strong>of</strong><br />
★✪<br />
1998 2001<br />
2004<br />
81 organic farms 131 organic farms<br />
46 STATUS OF WISCONSIN AGRICULTURE <strong>2010</strong>—FRAMING THE FINANCIAL CRISIS<br />
★✪<br />
39 organic farms<br />
★✪<br />
2008<br />
developing an effective supply management strategy<br />
has been limiting the number and rights <strong>of</strong> members<br />
and coordinating their production. To reiterate, this<br />
approach is not novel to cooperatives. There is a long<br />
history <strong>of</strong> such efforts, as cooperatives have legal rights<br />
to try to shape supply conditions in a way that private<br />
firms do not.<br />
It is no accident that in 2009, when it faced the end <strong>of</strong><br />
tremendous demand growth and the prospect for much<br />
lower prices, Organic Valley had the supply management<br />
architecture in place to deploy. It was part <strong>of</strong> the<br />
cooperative’s original organizational design, available<br />
when needed. When it was needed, the cooperative’s<br />
leadership activated it. Of course, it did not hurt that<br />
Organic Valley was a national market leader <strong>of</strong> organic
dairy products, and perhaps one <strong>of</strong> the lower-cost producers<br />
as well, with less brick-and-mortar facilities that<br />
would require high volume to operate at efficient scale.<br />
Such a strategy could not have been replicated in the<br />
broader conventional dairy market without similar<br />
industry-wide supply architecture to support it.<br />
A constant theme at PATS has been that the resilience<br />
<strong>of</strong> the <strong>Wisconsin</strong> dairy sector is likely to be enhanced<br />
by the state’s diversity <strong>of</strong> farm systems and the wide<br />
range <strong>of</strong> farm organizations working to find new ways<br />
to do things and to redeploy some old strategies.<br />
Organic Valley Cooperative has clearly been an innovator<br />
in finding ways to develop the organic dairy<br />
industry on both the demand and supply side, working<br />
closely with retailers, consumer and producers to build<br />
a robust business climate for itself. However, it has<br />
also built into its design some <strong>of</strong> the old-school ways<br />
<strong>of</strong> managing supply that agricultural cooperatives have<br />
pursued in other contexts. The combination <strong>of</strong> establishing<br />
a strong position in an emerging market and<br />
pursuing a resilient management approach has helped<br />
nearly 1,000 dairy farmers around <strong>Wisconsin</strong> and the<br />
nation to avoid a more severe shock during the current<br />
Great Recession.<br />
References:<br />
Income Tax Consequences <strong>of</strong> Farm Financial Distress<br />
Philip E. Harris 10<br />
Recognition <strong>of</strong> Gain or Loss from the Transfer<br />
<strong>of</strong> Assets<br />
The rules that require the recognition <strong>of</strong> gain or loss as a<br />
result <strong>of</strong> transferring assets do not distinguish between<br />
whether or not the assets were sold as a result <strong>of</strong> financial<br />
distress. Sellers must pay income tax on the difference<br />
between the fair market value and the income tax<br />
basis <strong>of</strong> assets that are transferred, even if the assets<br />
were repossessed by a lender to pay debt. For example,<br />
if a taxpayer owed $1 million and the debt was secured<br />
with a lien on assets that have a $980,000 fair market<br />
value and $140,000 income tax basis, a transfer <strong>of</strong> the<br />
Barham, B.L., J.D. Foltz, and U. Aldana (2005). “Expansion,<br />
Modernization, and Specialization in the <strong>Wisconsin</strong> Dairy<br />
Industry,” Program on <strong>Agricultural</strong> Technology Studies,<br />
Research Summaries 7.<br />
Brock, C. and B. L. Barham (2009). “Farm Structural Change<br />
<strong>of</strong> a Different Kind: Alternative Dairy Farms in <strong>Wisconsin</strong> –<br />
Graziers, Organic, and Amish”, Renewable <strong>Agriculture</strong> and<br />
Food Systems, 24 (1): 25-37.<br />
Harrison, J., S. Lloyd, and T. O’Kane (2009). “Overview <strong>of</strong><br />
Immigrant Workers on <strong>Wisconsin</strong> Dairy Farms,” PATS Briefing<br />
Paper #1 (<strong>of</strong> 5).<br />
Jackson-Smith, D. and B.L. Barham (2000). “The Changing<br />
Face <strong>of</strong> <strong>Wisconsin</strong> Dairy Farms: A Summary <strong>of</strong> PATS<br />
Research on Structural Change in the 1990s,” Program on<br />
<strong>Agricultural</strong> Technology Studies, Research Report 7.<br />
Jackson-Smith, D. and F. Buttel (1998). “Explaining the<br />
Uneven Penetration <strong>of</strong> Industrialization in the <strong>Wisconsin</strong><br />
Dairy Sector,” Program on <strong>Agricultural</strong> Technology Studies,<br />
Staff Paper 2.<br />
Mueller, W.,P. Helmberger, and T. Paterson (1987). The<br />
Sunkist case : a study in legal-economic analysis, Lexington,<br />
MA: Lexington Books.<br />
Siemon, G. (2009). “Crisis in the Dairy Farmer World:<br />
Organic and Non-Organic.” October 11. Available at:<br />
http://www.organicvalley.coop/ourstory/organicsense/archive<br />
Some <strong>of</strong>ten-overlooked aspects <strong>of</strong> farm financial stress, such as that experienced by <strong>Wisconsin</strong> dairy farmers<br />
in 2009, relate to tax treatment <strong>of</strong> distressed transactions. This section gives examples and provides planning<br />
advice for the two most common income tax consequences from these transactions: (1) recognition <strong>of</strong> gain<br />
(or loss) from transfer <strong>of</strong> assets, and (2) income from the discharge <strong>of</strong> indebtedness.<br />
assets (either in a voluntary sale or a repossession by the<br />
lender) would result in $840,000 ($980,000 – $140,000)<br />
<strong>of</strong> taxable gain. However, the taxpayer would receive<br />
none <strong>of</strong> the $980,000 because it would all go to the<br />
secured lender, leaving the taxpayer with $20,000<br />
remaining debt to the lender as well as the income tax<br />
liability on $840,000 <strong>of</strong> gain.<br />
Tax planning for the gain on the sale <strong>of</strong> assets in financial<br />
distress is the same as planning for the sale <strong>of</strong> assets<br />
when times are good. Two strategies that are particularly<br />
useful are income averaging and timing <strong>of</strong> income.<br />
STATUS OF WISCONSIN AGRICULTURE <strong>2010</strong>—FRAMING THE FINANCIAL CRISIS 47
Income Averaging<br />
The income-averaging rules allow farmers to use tax<br />
brackets from the three prior years to compute taxes on<br />
some or all <strong>of</strong> the current-year farm income. Therefore,<br />
income in the high brackets <strong>of</strong> the current year can be<br />
taxed at lower rates.<br />
Timing <strong>of</strong> Income<br />
If farmers can control the timing <strong>of</strong> asset sales, they may<br />
want to delay selling some assets until the following tax<br />
year. Doing so can affect both income taxes and selfemployment<br />
taxes.<br />
Bunching up self-employment income in one year can<br />
push some <strong>of</strong> that income above the social security wage<br />
base, which is $106,800 for 2009. This is an important<br />
threshold to reach, as earned income above the wage<br />
base is subject to a 2.9 percent self-employment tax rate<br />
instead <strong>of</strong> the 15.3 percent tax rate that applies to earned<br />
income up to $106,800. The income averaging rules can<br />
then be used to reduce the income tax rate on the<br />
bunched income.<br />
Bunching up ordinary income in one year has the added<br />
advantage <strong>of</strong> emptying the 15 percent regular income<br />
tax bracket for the following year, so that long-term capital<br />
gains in the following year qualify for the lower tax<br />
rate for capital gains, which is 0 percent in 2008, 2009<br />
and <strong>2010</strong>.<br />
For example, a taxpayer who has $200,000 <strong>of</strong> grain and<br />
$100,000 <strong>of</strong> land to sell could sell all <strong>of</strong> the grain in one<br />
year and the land the next year. The self-employment tax<br />
on the grain sale in excess <strong>of</strong> $106,800 is only 2.9%. In<br />
the next year, the first $67,900 <strong>of</strong> gain from the sale <strong>of</strong><br />
land is taxed at the zero percent rate on capital gains if<br />
the taxpayer files a married filing jointly tax return and<br />
has no other income. The remaining gain is taxed at a<br />
15 percent rate.<br />
Discharge <strong>of</strong> Debt<br />
Creditors <strong>of</strong> financially distressed taxpayers sometimes<br />
forgive some or all <strong>of</strong> the taxpayer’s debt because the<br />
taxpayer is unable to pay or because the cost <strong>of</strong> collecting<br />
the debt is more than the debt itself. For income tax<br />
purposes, if the creditor forgives debt for any reason<br />
other than for the purpose <strong>of</strong> making a gift to the debtor,<br />
the discharged debt is potentially cancellation <strong>of</strong> debt<br />
income (CODI) that is subject to taxation.<br />
For example, if the bank repossesses a tractor that has a<br />
$50,000 fair market value and $45,000 income tax basis<br />
and forgives the remaining $25,000 <strong>of</strong> a $75,000 debt,<br />
the debtor has $25,000 <strong>of</strong> potential CODI and $5,000<br />
($50,000 fair market value – $45,000 income tax basis)<br />
<strong>of</strong> taxable gain.<br />
48 STATUS OF WISCONSIN AGRICULTURE <strong>2010</strong>—FRAMING THE FINANCIAL CRISIS<br />
Exceptions to CODI<br />
If one <strong>of</strong> the following exceptions applies, the debtor<br />
does not have to include CODI in income:<br />
1. The taxpayer had paid the debt that was discharged,<br />
the taxpayer would have been allowed to deduct the<br />
amount paid [I.R.C. § 108(e)(2)].<br />
2. The debt was discharged bankruptcy. [I.R.C.<br />
§ 108(a)(1)(A)].<br />
3. The debt discharged was qualified principal residence<br />
debt that was discharged before January 1, 2013.<br />
4. The debtor was insolvent at the time the debt was<br />
discharged [I.R.C. § 108(a)(1)(B)].<br />
5. The seller <strong>of</strong> property under an installment contract<br />
discharged the debt and the original purchaser under the<br />
contract owed the debt discharged [I.R.C. § 108(e)(5)].<br />
6. The debt discharged is qualified farm indebtedness<br />
[I.R.C. § 108(a)(1)(C)].<br />
7. The debtor is not a C corporation and the debt discharged<br />
is qualified real property business indebtedness.<br />
[I.R.C. § 108(a)(1)(D)].<br />
Note that if discharged debt qualifies for more than one<br />
<strong>of</strong> these exceptions, the first applicable exception in the<br />
list is applied to the discharged debt.<br />
Paying the Price<br />
In most cases, the taxpayer must pay a price for not recognizing<br />
CODI. The price is a reduction <strong>of</strong> the taxpayer’s<br />
following tax attributes:<br />
1. Net Operating Loss. Any net operating loss for the<br />
taxable year <strong>of</strong> the discharge, and any net operating loss<br />
carryover to such taxable year.<br />
2. General Business Credit. Any carryover to or from<br />
the taxable year <strong>of</strong> a discharge <strong>of</strong> an amount for purposes<br />
for determining the amount allowable as a credit<br />
under I.R.C. § 38 (relating to general business credit).<br />
3. Minimum Tax Credit. The amount <strong>of</strong> the minimum<br />
tax credit available under I.R.C. § 53(b) as <strong>of</strong> the beginning<br />
<strong>of</strong> the taxable year immediately following the taxable<br />
year <strong>of</strong> the discharge.<br />
4. Capital Loss Carryovers. Any net capital loss for the<br />
taxable year <strong>of</strong> the discharge, and any capital loss carryover<br />
to such taxable year under I.R.C. § 1212<br />
5. Basis Reduction. The basis <strong>of</strong> the property <strong>of</strong> the<br />
taxpayer. See I.R.C. § 1017<br />
6. Passive Activity Loss and Credit Carryovers. Any<br />
passive activity loss or credit carryover <strong>of</strong> the taxpayer<br />
under I.R.C. § 469(b) from the taxable year <strong>of</strong> the<br />
discharge.
7. Foreign Tax Credit Carryovers. Any carryover<br />
to or from the taxable year <strong>of</strong> the discharge for purposes<br />
<strong>of</strong> determining the amount <strong>of</strong> the credit allowable<br />
under I.R.C. § 27.<br />
Credits are reduced $1 for every $3 <strong>of</strong> CODI that is<br />
excluded from income. The other tax attributes are<br />
reduced $1 for every $1 <strong>of</strong> CODI that is excluded<br />
from income.<br />
Order<br />
The general rule is that the tax attributes are reduced in<br />
the order listed above [I.R.C. § 108(b)(2)]. However, the<br />
taxpayer can elect to reduce the basis in depreciable<br />
property first [I.R.C. § 108(b)(5)].<br />
Limit on Bases Reduction<br />
If the debt discharge is excluded from income under the<br />
bankruptcy or insolvency exceptions, there is a limit on<br />
the reduction <strong>of</strong> the aggregate bases in the taxpayer’s<br />
assets. The aggregate <strong>of</strong> the bases in the taxpayer’s<br />
assets is reduced only down to the remaining debt after<br />
the discharge [I.R.C. § 1017(b)(2)].<br />
Timing<br />
The attribute reduction occurs after the taxes have been<br />
computed for the year <strong>of</strong> the discharge. Therefore, the<br />
attributes are used on the tax return before they are subject<br />
to the reduction under the CODI rules.<br />
Summary<br />
Farmers in financial distress face income tax consequences<br />
from transferring their assets as well as from<br />
cancellation <strong>of</strong> debt. Those taxes can be minimized by<br />
planning the timing <strong>of</strong> when the assets are transferred<br />
and when the debt is cancelled as well as by electing<br />
income tax options that reduce taxes. The guidelines<br />
noted here are very general in nature. It is important for<br />
farmers to consult their tax advisor before they make<br />
transactions to restructure their debt in order to make<br />
the best use <strong>of</strong> the tax-planning opportunities .<br />
STATUS OF WISCONSIN AGRICULTURE <strong>2010</strong>—FRAMING THE FINANCIAL CRISIS 49
End Notes<br />
1 Turnquist is Outreach Specialist for the Program on <strong>Agricultural</strong><br />
Technology Studies (PATS) Cooperative Extension, UW-<br />
Extension. Barham is a pr<strong>of</strong>essor in the Department <strong>of</strong><br />
<strong>Agricultural</strong> and <strong>Applied</strong> Economics and an Economist at<br />
PATS.<br />
2 Associate Pr<strong>of</strong>essor, Department <strong>of</strong> <strong>Agricultural</strong> and <strong>Applied</strong><br />
Economics, University <strong>of</strong> <strong>Wisconsin</strong>-Madison<br />
3 These data can be obtained from the following website:<br />
http://www.ers.usda.gov/Data/CostsAndReturns/testpick.htm#<br />
milkproduction .<br />
4 For more information concerning this herd reduction program<br />
refer to the following website: http://www.cwt.coop.<br />
Over the course <strong>of</strong> 3 rounds in 2009, a total <strong>of</strong> 211,000 cows<br />
will have been removed from the U.S. dairy herd from 963<br />
farms for an average <strong>of</strong> 219 cows per accepted bid.<br />
5 Part <strong>of</strong> this work was supported by a grant from the Center<br />
for World Affairs and the Global Economy (WAGE) at the<br />
University <strong>of</strong> <strong>Wisconsin</strong>-Madison.<br />
50 STATUS OF WISCONSIN AGRICULTURE <strong>2010</strong>—FRAMING THE FINANCIAL CRISIS<br />
6 The authors are emeritus pr<strong>of</strong>essor and pr<strong>of</strong>essor, respectively,<br />
Department <strong>of</strong> <strong>Agricultural</strong> and <strong>Applied</strong> Economics.<br />
Deller is also a rural development specialist, Cooperative<br />
Extension, UW-Extension<br />
7 Much <strong>of</strong> the harvest <strong>of</strong> some crops harvested in the fall <strong>of</strong><br />
the calendar year is exported in the following calendar year.<br />
8 Director, Bureau <strong>of</strong> Farm and Rural Services, <strong>Wisconsin</strong><br />
Department <strong>of</strong> <strong>Agriculture</strong>, Trade and Consumer Protection<br />
9 Pr<strong>of</strong>essor, Department <strong>of</strong> <strong>Agricultural</strong> and <strong>Applied</strong> Economics,<br />
Economist, Program on <strong>Agricultural</strong> Technology Studies<br />
10 Pr<strong>of</strong>essor, Department <strong>of</strong> <strong>Agricultural</strong> and <strong>Applied</strong> Economics<br />
and Center for Dairy Pr<strong>of</strong>itability UW-Madison, and Farm<br />
Law Specialist, Cooperative Extension, UW-Extension