Status of Wisconsin Agriculture 2010 - Agricultural & Applied ...
Status of Wisconsin Agriculture 2010 - Agricultural & Applied ...
Status of Wisconsin Agriculture 2010 - Agricultural & Applied ...

Create successful ePaper yourself
Turn your PDF publications into a flip-book with our unique Google optimized e-Paper software.
Regional Differences in the Response to Low Milk Prices:<br />
Herd Size, Production and Pr<strong>of</strong>itability<br />
Brian W. Gould 2<br />
Since the beginning <strong>of</strong> 2009, the dairy industry has<br />
experienced unprecedented decreases in farm-level milk<br />
prices. At the same time, the costs <strong>of</strong> many inputs were<br />
relatively high. This cost-price squeeze yielded negative<br />
cash flows for most producers.<br />
Over the first 11 months <strong>of</strong> 2009, the <strong>Wisconsin</strong> average<br />
All-Milk price was $12.74, down 33 percent from<br />
the 2008 average <strong>of</strong> $19.11 and the lowest 11-month<br />
average since 2002. We estimate that the <strong>Wisconsin</strong><br />
average Mailbox price will be $12.52/hundredweight,<br />
down from $18.81/hundredweight in 2008. With respect<br />
to feed costs, the average prices paid for corn grain and<br />
soybeans by producers in <strong>Wisconsin</strong> were $3.78/bu and<br />
$10.07/bu, respectively. These prices are up approximately<br />
30 percent higher from the January-November<br />
period <strong>of</strong> the previous 5 years.<br />
Dairy farmers in other regions suffered<br />
from the same negative cash<br />
flow problems as <strong>Wisconsin</strong>, but the<br />
severity <strong>of</strong> losses and the response<br />
by farmers to those losses varied<br />
across regions. These differential<br />
impacts reflect differences in farm<br />
structure, product mix and technology<br />
and other factors. What follows<br />
is a review <strong>of</strong> how dairy sectors in a<br />
number <strong>of</strong> the major producing<br />
states responded to the challenges <strong>of</strong><br />
the last year.<br />
Regional Differences in Farm<br />
Pr<strong>of</strong>itability<br />
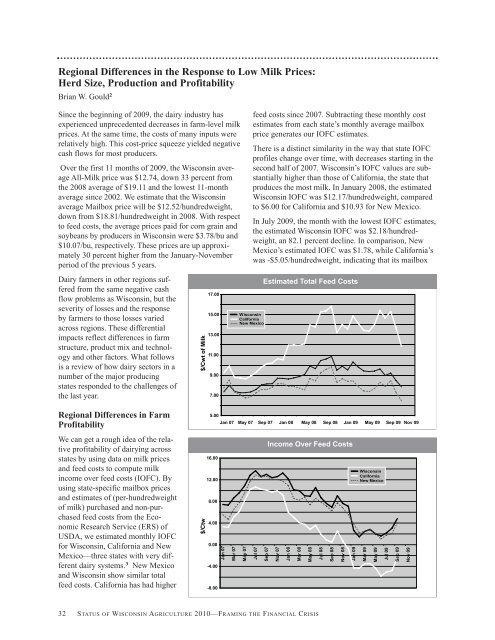
We can get a rough idea <strong>of</strong> the relative<br />
pr<strong>of</strong>itability <strong>of</strong> dairying across<br />
states by using data on milk prices<br />
and feed costs to compute milk<br />
income over feed costs (IOFC). By<br />
using state-specific mailbox prices<br />
and estimates <strong>of</strong> (per-hundredweight<br />
<strong>of</strong> milk) purchased and non-purchased<br />
feed costs from the Economic<br />
Research Service (ERS) <strong>of</strong><br />
USDA, we estimated monthly IOFC<br />
for <strong>Wisconsin</strong>, California and New<br />
Mexico—three states with very different<br />
dairy systems. 3 New Mexico<br />
and <strong>Wisconsin</strong> show similar total<br />
feed costs. California has had higher<br />
32 STATUS OF WISCONSIN AGRICULTURE <strong>2010</strong>—FRAMING THE FINANCIAL CRISIS<br />
$/Cwt <strong>of</strong> Milk<br />
$/Ctw<br />
17.00<br />
15.00<br />
13.00<br />
11.00<br />
9.00<br />
7.00<br />
16.00<br />
12.00<br />
8.00<br />
4.00<br />
0.00<br />
-4.00<br />
-8.00<br />
Jan 07<br />
Mar 07<br />
May 07<br />
feed costs since 2007. Subtracting these monthly cost<br />
estimates from each state’s monthly average mailbox<br />
price generates our IOFC estimates.<br />
There is a distinct similarity in the way that state IOFC<br />
pr<strong>of</strong>iles change over time, with decreases starting in the<br />
second half <strong>of</strong> 2007. <strong>Wisconsin</strong>’s IOFC values are substantially<br />
higher than those <strong>of</strong> California, the state that<br />
produces the most milk. In January 2008, the estimated<br />
<strong>Wisconsin</strong> IOFC was $12.17/hundredweight, compared<br />
to $6.00 for California and $10.93 for New Mexico.<br />
In July 2009, the month with the lowest IOFC estimates,<br />
the estimated <strong>Wisconsin</strong> IOFC was $2.18/hundredweight,<br />
an 82.1 percent decline. In comparison, New<br />
Mexico’s estimated IOFC was $1.78, while California’s<br />
was -$5.05/hundredweight, indicating that its mailbox<br />
<strong>Wisconsin</strong><br />
California<br />
New Mexico<br />
Jul 07<br />
Estimated Total Feed Costs<br />
5.00<br />
Jan 07 May 07 Sep 07 Jan 08 May 08 Sep 08 Jan 09 May 09 Sep 09 Nov 09<br />
Sep 07<br />
Income Over Feed Costs<br />
Nov 07<br />
Jan 08<br />
Mar 08<br />
May 08<br />
Jul 08<br />
Sep 08<br />
Nov 08<br />
Jan 09<br />
<strong>Wisconsin</strong><br />
California<br />
New Mexico<br />
Mar 09<br />
May 09<br />
Jul 09<br />
Sep 09<br />
Nov 09