Status of Wisconsin Agriculture 2010 - Agricultural & Applied ...
Status of Wisconsin Agriculture 2010 - Agricultural & Applied ...
Status of Wisconsin Agriculture 2010 - Agricultural & Applied ...

Create successful ePaper yourself
Turn your PDF publications into a flip-book with our unique Google optimized e-Paper software.
Dairy<br />
Bob Cropp (262-9483)<br />
Review <strong>of</strong> 2009<br />
<strong>Wisconsin</strong> dairy farmers had more<br />
financial stress in 2009 than in any<br />
year since the early 1970’s. Fortunately,<br />
milk prices were strong going<br />
into 2009—highest on record in 2007<br />
and second highest in 2008. But<br />
those years also brought high prices<br />
for feed and energy, which kept<br />
returns over operating costs modest.<br />
Feed and energy prices dropped<br />
some during 2009, but milk prices<br />
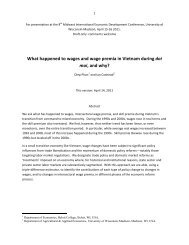
plunged. The <strong>Wisconsin</strong> All-Milk<br />
Price fell as much as $9.10 per hundredweight<br />
below year-earlier levels<br />
and averaged $6.82 lower January<br />
through October. Returns over feed<br />
costs reached a low <strong>of</strong> $1.71 per<br />
hundredweight for February 2009<br />
and averaged just $2.53 Januarythrough-October.<br />
Returns over feed<br />
costs had averaged $9.22 per hundredweight<br />
during 2008.<br />
This wasn’t the decade’s only bad<br />
stretch for dairy farmers—there were<br />
major price declines in 2000, 2002<br />
and 2006—but this one was different.<br />
Each <strong>of</strong> the earlier price drops<br />
were due to a relatively large<br />
increase in U.S. milk production.<br />
The 2009 plunge in milk prices was<br />
caused by a fall in demand. Production<br />
in 2009 increased just 0.4 percent<br />
for the first six months, was flat<br />
in July and fell below year-ago levels<br />
in August (0.1 percent), September<br />
(0.6 percent) , October (1.1 percent)<br />
and November (1.0 percent). At the<br />
same time, however, the downturn<br />
that began in 2008 curbed the growth<br />
in domestic dairy sales and reduced<br />
U.S. dairy exports.<br />
Domestic dairy sales grew just 0.4<br />
percent in 2008 due to very high<br />
retail prices. 4 USDA forecasts<br />
improvement for 2009, with growth<br />
4 The milk equivalent <strong>of</strong> domestic use and<br />
exports <strong>of</strong> dairy products are expressed here as a<br />
weighted average <strong>of</strong> reported sales on a fat basis<br />
(40 percent) and skim-solids basis (60 percent).<br />
<strong>of</strong> 2 percent. But the economic<br />
downturn has also brought a shift in<br />
eating habits. Consumers are eating<br />
out less, which has brought a shift in<br />
the composition <strong>of</strong> domestic dairy<br />
product consumption. This shift<br />
improved beverage milk sales in<br />
2009, but slowed sales <strong>of</strong> butter and<br />
cheese, particularly mozzarella, both<br />
<strong>of</strong> which are consumed mostly in<br />
restaurants. From January through<br />
October, beverage milk sales were up<br />
1.2 percent from the same period in<br />
2008. Domestic sales <strong>of</strong> cheese, butter<br />
and cream products were also<br />
expected to show relatively good<br />
increases during the October to<br />
Dollars Per Hundredweight<br />
Dollars per Hundredwieght<br />
$22<br />
$20<br />
$18<br />
$16<br />
$14<br />
$12<br />
$10<br />
$14<br />
$12<br />
$10<br />
$8<br />
$6<br />
$4<br />
$2<br />
$0<br />
Jan<br />
2007<br />
2008<br />
<strong>Wisconsin</strong> All-Milk Price (NASS, USDA)<br />
less Estimated Feed Costs (ERS, USDA)<br />
Mar<br />
2008<br />
2009<br />
May<br />
<strong>Wisconsin</strong> All-Milk Price<br />
Jul<br />
Sep<br />
Nov<br />
December period, thanks to lower<br />
wholesale and retail prices along<br />
with store specials.<br />
Farm milk prices took a bigger hit<br />
from the loss in U.S. dairy exports<br />
than from changes in domestic sales.<br />
U.S. dairy exports had climbed 9.4<br />
percent in 2007 and 14.5 percent in<br />
2008, countering anemic gains in<br />
domestic use. Those exports represented<br />
9.2 percent <strong>of</strong> U.S. milk production<br />
in 2007 and 10.8 percent in<br />
2008. But exports began to decline<br />
during the last half <strong>of</strong> 2008. Exports<br />
in the first half <strong>of</strong> 2009 were half <strong>of</strong><br />
what they were during the first half<br />
Jan Feb Mar Apr May Jun Jul Aug Sept Oct Nov Dec<br />
<strong>Wisconsin</strong> Dairy Returns over Feed Costs<br />
STATUS OF WISCONSIN AGRICULTURE <strong>2010</strong>—CURRENT OUTLOOK: DAIRY 17<br />
Jan<br />
Mar<br />
May<br />
Source: NASS, USDA<br />
2009<br />
Jul<br />
Sep<br />
Nov