Status of Wisconsin Agriculture 2010 - Agricultural & Applied ...
Status of Wisconsin Agriculture 2010 - Agricultural & Applied ...
Status of Wisconsin Agriculture 2010 - Agricultural & Applied ...

You also want an ePaper? Increase the reach of your titles
YUMPU automatically turns print PDFs into web optimized ePapers that Google loves.
Million Bushels<br />
6,000<br />
5,000<br />
4,000<br />
3,000<br />
2,000<br />
1,000<br />
0<br />
Total Industrial Use<br />
(Including Food and Seed)<br />
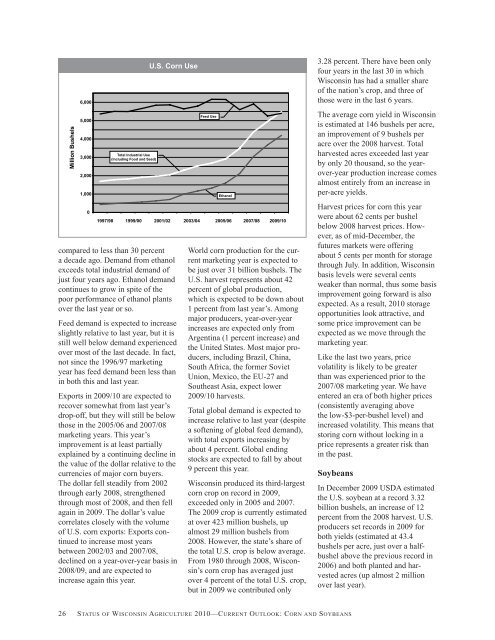
U.S. Corn Use<br />
compared to less than 30 percent<br />
a decade ago. Demand from ethanol<br />
exceeds total industrial demand <strong>of</strong><br />
just four years ago. Ethanol demand<br />
continues to grow in spite <strong>of</strong> the<br />
poor performance <strong>of</strong> ethanol plants<br />
over the last year or so.<br />
Feed demand is expected to increase<br />
slightly relative to last year, but it is<br />
still well below demand experienced<br />
over most <strong>of</strong> the last decade. In fact,<br />
not since the 1996/97 marketing<br />
year has feed demand been less than<br />
in both this and last year.<br />
Exports in 2009/10 are expected to<br />
recover somewhat from last year’s<br />
drop-<strong>of</strong>f, but they will still be below<br />
those in the 2005/06 and 2007/08<br />
marketing years. This year’s<br />
improvement is at least partially<br />
explained by a continuing decline in<br />
the value <strong>of</strong> the dollar relative to the<br />
currencies <strong>of</strong> major corn buyers.<br />
The dollar fell steadily from 2002<br />
through early 2008, strengthened<br />
through most <strong>of</strong> 2008, and then fell<br />
again in 2009. The dollar’s value<br />
correlates closely with the volume<br />
<strong>of</strong> U.S. corn exports: Exports continued<br />
to increase most years<br />
between 2002/03 and 2007/08,<br />
declined on a year-over-year basis in<br />
2008/09, and are expected to<br />
increase again this year.<br />
Feed Use<br />
World corn production for the current<br />
marketing year is expected to<br />
be just over 31 billion bushels. The<br />
U.S. harvest represents about 42<br />
percent <strong>of</strong> global production,<br />
which is expected to be down about<br />
1 percent from last year’s. Among<br />
major producers, year-over-year<br />
increases are expected only from<br />
Argentina (1 percent increase) and<br />
the United States. Most major producers,<br />
including Brazil, China,<br />
South Africa, the former Soviet<br />
Union, Mexico, the EU-27 and<br />
Southeast Asia, expect lower<br />
2009/10 harvests.<br />
Total global demand is expected to<br />
increase relative to last year (despite<br />
a s<strong>of</strong>tening <strong>of</strong> global feed demand),<br />
with total exports increasing by<br />
about 4 percent. Global ending<br />
stocks are expected to fall by about<br />
9 percent this year.<br />
<strong>Wisconsin</strong> produced its third-largest<br />
corn crop on record in 2009,<br />
exceeded only in 2005 and 2007.<br />
The 2009 crop is currently estimated<br />
at over 423 million bushels, up<br />
almost 29 million bushels from<br />
2008. However, the state’s share <strong>of</strong><br />
the total U.S. crop is below average.<br />
From 1980 through 2008, <strong>Wisconsin</strong>’s<br />
corn crop has averaged just<br />
over 4 percent <strong>of</strong> the total U.S. crop,<br />
but in 2009 we contributed only<br />
26 STATUS OF WISCONSIN AGRICULTURE <strong>2010</strong>—CURRENT OUTLOOK: CORN AND SOYBEANS<br />
Ethanol<br />
1997/98 1999/00 2001/02 2003/04 2005/06 2007/08 2009/10<br />
3.28 percent. There have been only<br />
four years in the last 30 in which<br />
<strong>Wisconsin</strong> has had a smaller share<br />
<strong>of</strong> the nation’s crop, and three <strong>of</strong><br />
those were in the last 6 years.<br />
The average corn yield in <strong>Wisconsin</strong><br />
is estimated at 146 bushels per acre,<br />
an improvement <strong>of</strong> 9 bushels per<br />
acre over the 2008 harvest. Total<br />
harvested acres exceeded last year<br />
by only 20 thousand, so the yearover-year<br />
production increase comes<br />
almost entirely from an increase in<br />
per-acre yields.<br />
Harvest prices for corn this year<br />
were about 62 cents per bushel<br />
below 2008 harvest prices. However,<br />
as <strong>of</strong> mid-December, the<br />
futures markets were <strong>of</strong>fering<br />
about 5 cents per month for storage<br />
through July. In addition, <strong>Wisconsin</strong><br />
basis levels were several cents<br />
weaker than normal, thus some basis<br />
improvement going forward is also<br />
expected. As a result, <strong>2010</strong> storage<br />
opportunities look attractive, and<br />
some price improvement can be<br />
expected as we move through the<br />
marketing year.<br />
Like the last two years, price<br />
volatility is likely to be greater<br />
than was experienced prior to the<br />
2007/08 marketing year. We have<br />
entered an era <strong>of</strong> both higher prices<br />
(consistently averaging above<br />
the low-$3-per-bushel level) and<br />
increased volatility. This means that<br />
storing corn without locking in a<br />
price represents a greater risk than<br />
in the past.<br />
Soybeans<br />
In December 2009 USDA estimated<br />
the U.S. soybean at a record 3.32<br />
billion bushels, an increase <strong>of</strong> 12<br />
percent from the 2008 harvest. U.S.<br />
producers set records in 2009 for<br />
both yields (estimated at 43.4<br />
bushels per acre, just over a halfbushel<br />
above the previous record in<br />
2006) and both planted and harvested<br />
acres (up almost 2 million<br />
over last year).