Status of Wisconsin Agriculture 2010 - Agricultural & Applied ...
Status of Wisconsin Agriculture 2010 - Agricultural & Applied ...
Status of Wisconsin Agriculture 2010 - Agricultural & Applied ...

You also want an ePaper? Increase the reach of your titles
YUMPU automatically turns print PDFs into web optimized ePapers that Google loves.
U.S. Dairy Exports, October and Year-to-date, 2009 vs. 2008<br />
Dairy Product October January-October<br />
Million Lbs. % Change Million Lbs. % Change<br />
Nonfat dry milk 64.5 +19 473.0 -40<br />
Cheese 20.3 -5 191.0 -24<br />
Butter 8.8 -40 39.0 -79<br />
Dry whey 47.0 +13 394.8 -1<br />
Whey protein concentrates 27.2 +33 163.8 +13<br />
Lactose 43.4 +35 403.2 +17<br />
Source: USDA, FAS<br />
<strong>of</strong> 2008 on a volume basis and even<br />
less on a value basis.<br />
A look at dairy exports for October<br />
2009 indicates some strengthening.<br />
Nonfat dry milk exports for October<br />
were 19 percent higher than 2008,<br />
but year-to-date exports were 40<br />
percent lower. Dry whey exports<br />
were 13 percent higher than a year<br />
ago, and exports <strong>of</strong> whey protein<br />
concentrates were 33 percent higher<br />
in October and 13 percent higher<br />
year-to-date. Lactose exports were<br />
33 percent higher in October and 17<br />
percent higher year-to-date.<br />
USDA expects exports for 2009 to<br />
be just under 15 billion pounds milk<br />
equivalent, about three-fourths <strong>of</strong><br />
what they were in 2008, and equal<br />
to about 8 percent <strong>of</strong> projected 2009<br />
U.S. milk production.<br />
On a dollar basis, exports for the<br />
first nine months totaled $1.605 billion,<br />
48 percent less than during the<br />
first nine months <strong>of</strong> 2008. For the<br />
year, exports will exceed $2 billion,<br />
the third highest on record. Nevertheless,<br />
the loss <strong>of</strong> export volume<br />
in 2009 was equivalent to about 5<br />
billion pounds <strong>of</strong> milk. This meant<br />
that compared to 2008, about 3 percent<br />
more milk had to clear domestic<br />
markets.<br />
U.S. dairy imports are <strong>of</strong>ten blamed<br />
for lower milk prices, but in 2009<br />
imports were lower than a year ago.<br />
For the first nine months <strong>of</strong> the year,<br />
imports totaled $1.581 billion, down<br />
18 percent, netting a small dairy<br />
trade surplus <strong>of</strong> $23.6 million. On a<br />
volume basis, during the first nine<br />
months <strong>of</strong> 2009 the United States<br />
imported 15 percent less cheese, 23<br />
percent less casein, 53 percent less<br />
caseinates, and 8 percent less milk<br />
protein for food use than in the same<br />
period for 2008.<br />
With the slowdown in domestic<br />
sales and the loss <strong>of</strong> dairy exports, a<br />
recovery <strong>of</strong> farm milk prices in 2009<br />
required a reduction in milk production,<br />
which in turn required fewer<br />
milk cows. But higher milk prices<br />
during 2007 and most <strong>of</strong> 2008 had<br />
spurred dairy producers to add<br />
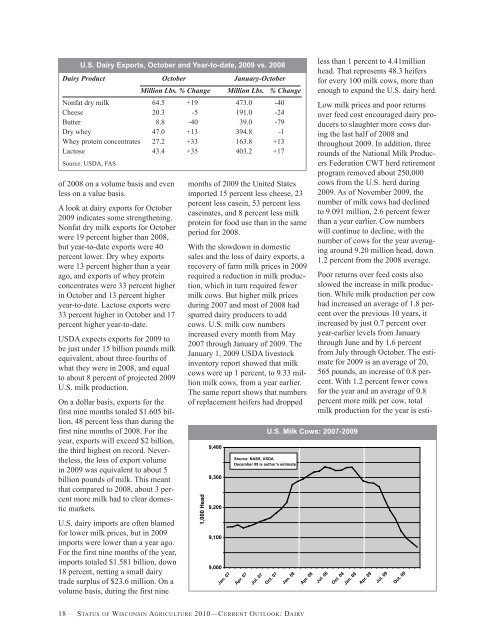
cows. U.S. milk cow numbers<br />
increased every month from May<br />
2007 through January <strong>of</strong> 2009. The<br />
January 1, 2009 USDA livestock<br />
inventory report showed that milk<br />
cows were up 1 percent, to 9.33 million<br />
milk cows, from a year earlier.<br />
The same report shows that numbers<br />
<strong>of</strong> replacement heifers had dropped<br />
9,400<br />
9,300<br />
9,200<br />
9,100<br />
9,000<br />
Source: NASS, USDA<br />
December 09 is author’s estimate<br />
18 STATUS OF WISCONSIN AGRICULTURE <strong>2010</strong>—CURRENT OUTLOOK: DAIRY<br />
1,000 Head<br />
Jan. 07<br />
Apr. 07<br />
U.S. Milk Cows: 2007-2009<br />
Jul. 07<br />
Oct. 07<br />
Jan. 08<br />
less than 1 percent to 4.41million<br />
head. That represents 48.3 heifers<br />
for every 100 milk cows, more than<br />
enough to expand the U.S. dairy herd.<br />
Low milk prices and poor returns<br />
over feed cost encouraged dairy producers<br />
to slaughter more cows during<br />
the last half <strong>of</strong> 2008 and<br />
throughout 2009. In addition, three<br />
rounds <strong>of</strong> the National Milk Producers<br />
Federation CWT herd retirement<br />
program removed about 250,000<br />
cows from the U.S. herd during<br />
2009. As <strong>of</strong> November 2009, the<br />
number <strong>of</strong> milk cows had declined<br />
to 9.091 million, 2.6 percent fewer<br />
than a year earlier. Cow numbers<br />
will continue to decline, with the<br />
number <strong>of</strong> cows for the year averaging<br />
around 9.20 million head, down<br />
1.2 percent from the 2008 average.<br />
Poor returns over feed costs also<br />
slowed the increase in milk production.<br />
While milk production per cow<br />
had increased an average <strong>of</strong> 1.8 percent<br />
over the previous 10 years, it<br />
increased by just 0.7 percent over<br />
year-earlier levels from January<br />
through June and by 1.6 percent<br />
from July through October. The estimate<br />
for 2009 is an average <strong>of</strong> 20,<br />
565 pounds, an increase <strong>of</strong> 0.8 percent.<br />
With 1.2 percent fewer cows<br />
for the year and an average <strong>of</strong> 0.8<br />
percent more milk per cow, total<br />
milk production for the year is esti-<br />
Apr. 08<br />
Jul. 08<br />
Oct. 08<br />
Jan. 09<br />
Apr. 09<br />
Jul. 09<br />
Oct. 09