Status of Wisconsin Agriculture 2010 - Agricultural & Applied ...
Status of Wisconsin Agriculture 2010 - Agricultural & Applied ...
Status of Wisconsin Agriculture 2010 - Agricultural & Applied ...

You also want an ePaper? Increase the reach of your titles
YUMPU automatically turns print PDFs into web optimized ePapers that Google loves.
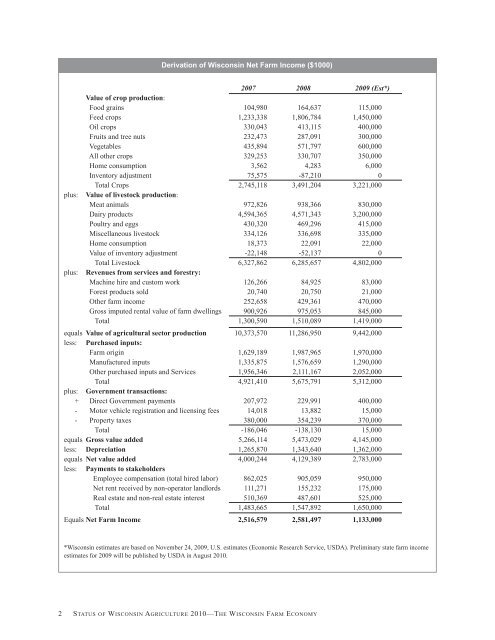
Derivation <strong>of</strong> <strong>Wisconsin</strong> Net Farm Income ($1000)<br />
2007 2008 2009 (Est*)<br />
Value <strong>of</strong> crop production:<br />
Food grains 104,980 164,637 115,000<br />
Feed crops 1,233,338 1,806,784 1,450,000<br />
Oil crops 330,043 413,115 400,000<br />
Fruits and tree nuts 232,473 287,091 300,000<br />
Vegetables 435,894 571,797 600,000<br />
All other crops 329,253 330,707 350,000<br />
Home consumption 3,562 4,283 6,000<br />
Inventory adjustment 75,575 -87,210 0<br />
Total Crops 2,745,118 3,491,204 3,221,000<br />
plus: Value <strong>of</strong> livestock production:<br />
Meat animals 972,826 938,366 830,000<br />
Dairy products 4,594,365 4,571,343 3,200,000<br />
Poultry and eggs 430,320 469,296 415,000<br />
Miscellaneous livestock 334,126 336,698 335,000<br />
Home consumption 18,373 22,091 22,000<br />
Value <strong>of</strong> inventory adjustment -22,148 -52,137 0<br />
Total Livestock 6,327,862 6,285,657 4,802,000<br />
plus: Revenues from services and forestry:<br />
Machine hire and custom work 126,266 84,925 83,000<br />
Forest products sold 20,740 20,750 21,000<br />
Other farm income 252,658 429,361 470,000<br />
Gross imputed rental value <strong>of</strong> farm dwellings 900,926 975,053 845,000<br />
Total 1,300,590 1,510,089 1,419,000<br />
equals Value <strong>of</strong> agricultural sector production 10,373,570 11,286,950 9,442,000<br />
less: Purchased inputs:<br />
Farm origin 1,629,189 1,987,965 1,970,000<br />
Manufactured inputs 1,335,875 1,576,659 1,290,000<br />
Other purchased inputs and Services 1,956,346 2,111,167 2,052,000<br />
Total 4,921,410 5,675,791 5,312,000<br />
plus: Government transactions:<br />
+ Direct Government payments 207,972 229,991 400,000<br />
- Motor vehicle registration and licensing fees 14,018 13,882 15,000<br />
- Property taxes 380,000 354,239 370,000<br />
Total -186,046 -138,130 15,000<br />
equals Gross value added 5,266,114 5,473,029 4,145,000<br />
less: Depreciation 1,265,870 1,343,640 1,362,000<br />
equals Net value added 4,000,244 4,129,389 2,783,000<br />
less: Payments to stakeholders<br />
Employee compensation (total hired labor) 862,025 905,059 950,000<br />
Net rent received by non-operator landlords 111,271 155,232 175,000<br />
Real estate and non-real estate interest 510,369 487,601 525,000<br />
Total 1,483,665 1,547,892 1,650,000<br />
Equals Net Farm Income 2,516,579 2,581,497 1,133,000<br />
*<strong>Wisconsin</strong> estimates are based on November 24, 2009, U.S. estimates (Economic Research Service, USDA). Preliminary state farm income<br />
estimates for 2009 will be published by USDA in August <strong>2010</strong>.<br />
2 STATUS OF WISCONSIN AGRICULTURE <strong>2010</strong>—THE WISCONSIN FARM ECONOMY