Status of Wisconsin Agriculture 2010 - Agricultural & Applied ...
Status of Wisconsin Agriculture 2010 - Agricultural & Applied ...
Status of Wisconsin Agriculture 2010 - Agricultural & Applied ...

You also want an ePaper? Increase the reach of your titles
YUMPU automatically turns print PDFs into web optimized ePapers that Google loves.
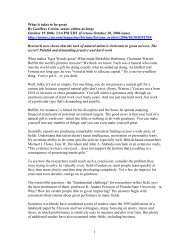
Major U.S. Export Crops, 2007-08 Crop Years<br />
U.S. U.S. Share <strong>of</strong> U.S. U.S. Share <strong>of</strong><br />
Commodity Production Exports Crop Exported World Exports World Exports<br />
Mil. MT Percent Mil. MT Percent<br />
Corn 331.2 61.9 18.7% 98.61 62.8%<br />
Soybeans 72.9 31.5 43.3% 79.52 39.7%<br />
Wheat 55.8 34.4 61.6% 117.20 29.3%<br />
Rice 6.3 3.4 52.8% 31.09 10.8%<br />
Cotton 4.2 3.0 71.4% 8.35 35.9%<br />
Source: USDA. World <strong>Agricultural</strong> Supply and Demand Estimates, October 2009<br />
exported less than 20 percent <strong>of</strong> our corn, the United<br />
States had a larger share <strong>of</strong> the global market for corn—<br />
63 percent <strong>of</strong> total world exports—than for any other<br />
major U.S. grain crop.<br />
Three crops—soybeans, corn and wheat—accounted for<br />
more than 45 percent <strong>of</strong> U.S. agricultural export value in<br />
2008. Animal products (live animals and meat, poultry<br />
products and dairy products) added another 16 percent,<br />
fruit and vegetable products represented about 10 percent<br />
and cotton comprised 4 percent, while the remaining<br />
25 percent came from a long list <strong>of</strong> products.<br />
The importance <strong>of</strong> agricultural exports to a given state<br />
depends on the mix <strong>of</strong> commodities produced in that<br />
state. California was the leading agricultural exporter<br />
in 2008, because much <strong>of</strong> its large production <strong>of</strong> fruits,<br />
vegetables, tree nuts, rice and cotton was sold overseas.<br />
Several Corn Belt and Great Plains states follow, due to<br />
their feed grain, wheat and oilseed production. <strong>Wisconsin</strong><br />
ranked 15th, with a total agricultural export value<br />
<strong>of</strong> $3 Ubillion.<br />
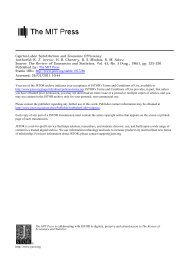
Dairy Prods<br />
4,099<br />
Cotton<br />
4,782<br />
All Other<br />
28,792<br />
Poultry & Prods<br />
4,922<br />
Vegetables & Preps<br />
5,160<br />
Fruit & Preps<br />
5,926<br />
Live Animals<br />
& Meat<br />
9,455<br />
Soybeans & Prods<br />
19,332<br />
Feed<br />
Grains<br />
18,148<br />
Wheat & Prods<br />
14,836<br />
Values in $Million<br />
Total: $115.5 Billion<br />
Source: ERS, USDA<br />
<strong>Wisconsin</strong> <strong>Agricultural</strong> Exports<br />
<strong>Wisconsin</strong>’s export mix differs significantly from that<br />
<strong>of</strong> the nation, reflecting the unique nature <strong>of</strong> <strong>Wisconsin</strong><br />
agriculture. Not surprisingly, dairy products—primarily<br />
cheese and whey products—accounted for nearly a third<br />
<strong>of</strong> total <strong>Wisconsin</strong> export value in 2008. Next came feed<br />
grains (mainly corn), soybeans, live animals and meat,<br />
and vegetables. Together, these commodity groups represented<br />
75 percent <strong>of</strong> <strong>Wisconsin</strong>’s export value.<br />
<strong>Wisconsin</strong> led the nation in dairy exports in 2008,<br />
accounting for nearly one-fourth <strong>of</strong> the nation’s total <strong>of</strong><br />
$4.1 billion. California, which dominates in exports <strong>of</strong><br />
nonfat dry milk, was in second place, followed by New<br />
York. Exports from these three states represented more<br />
than half <strong>of</strong> the total value <strong>of</strong> U.S. dairy exports.<br />
<strong>Wisconsin</strong> also ranked among the top ten in exports<br />
<strong>of</strong> vegetables (6th), hides and skins (4th) and animal<br />
fats (5th).<br />
U.S. Exports <strong>of</strong> <strong>Agricultural</strong> Products, FY 2008 U.S. <strong>Agricultural</strong> Exports by State, FY 2008<br />
U<br />
All Other<br />
States 36.5<br />
WI 3.0<br />
SD 3.0<br />
NC 3.1<br />
WA 3.2<br />
AR 3.2<br />
MO 3.2<br />
CA 13.7<br />
IA 7.9<br />
KS 5.9<br />
IL 7.5<br />
TX 6.0<br />
NB 5.9<br />
MN 5.5<br />
IN 3.8<br />
ND 3.9<br />
Values in $Billion<br />
Total: $115.5 Billion<br />
Source: ERS, USDA<br />
STATUS OF WISCONSIN AGRICULTURE <strong>2010</strong>—FRAMING THE FINANCIAL CRISIS 37