Status of Wisconsin Agriculture 2010 - Agricultural & Applied ...
Status of Wisconsin Agriculture 2010 - Agricultural & Applied ...
Status of Wisconsin Agriculture 2010 - Agricultural & Applied ...

Create successful ePaper yourself
Turn your PDF publications into a flip-book with our unique Google optimized e-Paper software.
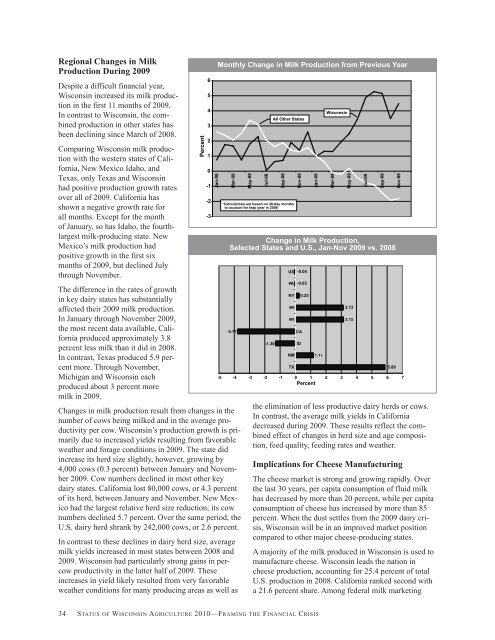
Regional Changes in Milk<br />
Production During 2009<br />
Despite a difficult financial year,<br />
<strong>Wisconsin</strong> increased its milk production<br />
in the first 11 months <strong>of</strong> 2009.<br />
In contrast to <strong>Wisconsin</strong>, the combined<br />
production in other states has<br />
been declining since March <strong>of</strong> 2008.<br />
Comparing <strong>Wisconsin</strong> milk production<br />
with the western states <strong>of</strong> California,<br />
New Mexico Idaho, and<br />
Texas, only Texas and <strong>Wisconsin</strong><br />
had positive production growth rates<br />
over all <strong>of</strong> 2009. California has<br />
shown a negative growth rate for<br />
all months. Except for the month<br />
<strong>of</strong> January, so has Idaho, the fourthlargest<br />
milk-producing state. New<br />
Mexico’s milk production had<br />
positive growth in the first six<br />
months <strong>of</strong> 2009, but declined July<br />
through November.<br />
The difference in the rates <strong>of</strong> growth<br />
in key dairy states has substantially<br />
affected their 2009 milk production.<br />
In January through November 2009,<br />
the most recent data available, California<br />
produced approximately 3.8<br />
percent less milk than it did in 2008.<br />
In contrast, Texas produced 5.9 percent<br />
more. Through November,<br />
Michigan and <strong>Wisconsin</strong> each<br />
produced about 3 percent more<br />
milk in 2009.<br />
Changes in milk production result from changes in the<br />
number <strong>of</strong> cows being milked and in the average productivity<br />
per cow. <strong>Wisconsin</strong>’s production growth is primarily<br />
due to increased yields resulting from favorable<br />
weather and forage conditions in 2009. The state did<br />
increase its herd size slightly, however, growing by<br />
4,000 cows (0.3 percent) between January and November<br />
2009. Cow numbers declined in most other key<br />
dairy states. California lost 80,000 cows, or 4.3 percent<br />
<strong>of</strong> its herd, between January and November. New Mexico<br />
had the largest relative herd size reduction; its cow<br />
numbers declined 5.7 percent. Over the same period, the<br />
U.S. dairy herd shrank by 242,000 cows, or 2.6 percent.<br />
In contrast to these declines in dairy herd size, average<br />
milk yields increased in most states between 2008 and<br />
2009. <strong>Wisconsin</strong> had particularly strong gains in percow<br />
productivity in the latter half <strong>of</strong> 2009. These<br />
increases in yield likely resulted from very favorable<br />
weather conditions for many producing areas as well as<br />
Percent<br />
6<br />
5<br />
4<br />
3<br />
2<br />
1<br />
0<br />
-1<br />
-2<br />
-3<br />
Jan-08<br />
Monthly Change in Milk Production from Previous Year<br />
Mar-08<br />
-3.77<br />
May-08<br />
Jul-08<br />
-1.30<br />
All Other States<br />
Sep-08<br />
*Calculations are based on 30-day months<br />
to account for leap year in 2008<br />
Change in Milk Production,<br />
Selected States and U.S., Jan-Nov 2009 vs. 2008<br />
US -0.04<br />
PA -0.03<br />
NY<br />
MI<br />
WI<br />
NM<br />
TX<br />
CA<br />
ID<br />
0.25<br />
-5 -4 -3 -2 -1 0 1 2 3 4 5 6 7<br />
Percent<br />
34 STATUS OF WISCONSIN AGRICULTURE <strong>2010</strong>—FRAMING THE FINANCIAL CRISIS<br />
Nov-08<br />
Jan-09<br />
1.17<br />
<strong>Wisconsin</strong><br />
the elimination <strong>of</strong> less productive dairy herds or cows.<br />
In contrast, the average milk yields in California<br />
decreased during 2009. These results reflect the combined<br />
effect <strong>of</strong> changes in herd size and age composition,<br />
feed quality, feeding rates and weather.<br />
Implications for Cheese Manufacturing<br />
Mar-09<br />
The cheese market is strong and growing rapidly. Over<br />
the last 30 years, per capita consumption <strong>of</strong> fluid milk<br />
has decreased by more than 20 percent, while per capita<br />
consumption <strong>of</strong> cheese has increased by more than 85<br />
percent. When the dust settles from the 2009 dairy crisis,<br />
<strong>Wisconsin</strong> will be in an improved market position<br />
compared to other major cheese-producing states.<br />
A majority <strong>of</strong> the milk produced in <strong>Wisconsin</strong> is used to<br />
manufacture cheese. <strong>Wisconsin</strong> leads the nation in<br />
cheese production, accounting for 25.4 percent <strong>of</strong> total<br />
U.S. production in 2008. California ranked second with<br />
a 21.6 percent share. Among federal milk marketing<br />
May-09<br />
3.13<br />
3.15<br />
Jul-09<br />
Sep-09<br />
5.86<br />
Nov-09