Status of Wisconsin Agriculture 2010 - Agricultural & Applied ...
Status of Wisconsin Agriculture 2010 - Agricultural & Applied ...
Status of Wisconsin Agriculture 2010 - Agricultural & Applied ...

You also want an ePaper? Increase the reach of your titles
YUMPU automatically turns print PDFs into web optimized ePapers that Google loves.
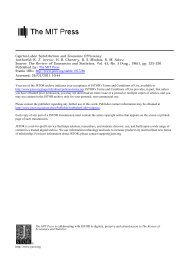
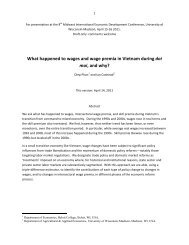
$Billion<br />
70<br />
60<br />
50<br />
40<br />
30<br />
20<br />
10<br />
Assets<br />
Debt<br />
Debt–Asset Ratio (Right Axis)<br />
0<br />
1960 1965 1970 1975 1980 1985 1990 1995 2000 2005<br />
time <strong>of</strong>f-farm jobs, account for<br />
nearly half <strong>of</strong> <strong>Wisconsin</strong> farm assets<br />
and less than 30 percent <strong>of</strong> farm<br />
debt. The 1,400 <strong>Wisconsin</strong> farms<br />
with 2008 sales exceeding $1 million<br />
had an average year end debtto-asset<br />
ratio <strong>of</strong> 0.23, more than<br />
double the state average. The 60,000<br />
<strong>Wisconsin</strong> farms with sales less than<br />
$100,000 had a debt-to-asset ratio <strong>of</strong><br />
0.064. These smaller farms with<br />
very strong balance sheets are not at<br />
financial risk. Large farms, with a<br />
much smaller share <strong>of</strong> assets comprised<br />
<strong>of</strong> equity, are generally more<br />
vulnerable.<br />
Dairy Farm Balance Sheet1 <strong>Wisconsin</strong> dairy farms, which were<br />
hit hardest by the drastic fall in net<br />
income in 2009, have a composition<br />
1 This section makes extensive use <strong>of</strong> data<br />
provided through the <strong>Agricultural</strong> Resource<br />
Management Survey (ARMS) database maintained<br />
by the Economic Research Service,<br />
USDA. <strong>Wisconsin</strong> data can be accessed at:<br />
www.ers.usda.gov/Data/ARMS/app/States.aspx.<br />
<strong>Wisconsin</strong> Farm Assets, Debt, and Debt-Asset Ratio<br />
Source: Economic Research Service, USDA<br />
<strong>of</strong> assets and debts that is different<br />
and more troubling than that<br />
reported for all farms. Compared to<br />
the average for all farms, large <strong>Wisconsin</strong><br />
dairy farms (more than $1<br />
million in sales) hold a larger share<br />
<strong>of</strong> total assets (20 percent) as well as<br />
debt (37 percent) and had a debt-toasst<br />
ratio <strong>of</strong> 0.275 in 2008. Dairy<br />
farms with less than $100,000 in<br />
sales held less than 10 percent <strong>of</strong><br />
both assets and debt and had a debtto-asset<br />
ratio <strong>of</strong> 0.09. This suggests<br />
that dairy farms overall are more<br />
financially vulnerable than other<br />
farms and that larger dairy farms<br />
may be particularly stressed in <strong>2010</strong>.<br />
However, we need to consider differences<br />
in productivity by dairy<br />
farm size. While the largest <strong>Wisconsin</strong><br />
dairy farms held only 20 percent<br />
<strong>of</strong> total dairy farm assets, they generated<br />
a disproportionately large<br />
share <strong>of</strong> gross returns to assets (net<br />
farm income before interest<br />
expenses and operator labor returns).<br />
Because <strong>of</strong> greater asset productiv-<br />
0.35<br />
0.30<br />
0.25<br />
0.20<br />
0.15<br />
0.10<br />
0.05<br />
0.00<br />
ity, dairy farms with more than $1<br />
million in sales accounted for about<br />
35 percent <strong>of</strong> the total gross returns<br />
produced by all dairy farms in 2008.<br />
Because they held more debt relative<br />
to assets, large dairy farms’ interest<br />
per dollar <strong>of</strong> gross return to assets<br />
was higher than smaller dairies. The<br />
ratio <strong>of</strong> interest expense to gross<br />
returns to assets—a financial measure<br />
comparable to the debt-to-asset<br />
ratio—was over 0.15 for dairies in<br />
the largest two size classes and only<br />
about 0.10 for the smallest size class.<br />
While the largest dairies have a<br />
higher ratio <strong>of</strong> interest expense to<br />
gross returns to assets compared to<br />
that <strong>of</strong> smaller operations, this ratio<br />
is lower than expected given that<br />
these operators average about 27<br />
cents <strong>of</strong> debt per dollar <strong>of</strong> assets.<br />
Normally, these two ratios are similar<br />
in value. This emphasizes the relatively<br />
high rate <strong>of</strong> returns to assets<br />
that the largest farms were able to<br />
generate.<br />
STATUS OF WISCONSIN AGRICULTURE <strong>2010</strong>—THE WISCONSIN FARM ECONOMY 3