Status of Wisconsin Agriculture 2010 - Agricultural & Applied ...
Status of Wisconsin Agriculture 2010 - Agricultural & Applied ...
Status of Wisconsin Agriculture 2010 - Agricultural & Applied ...

Create successful ePaper yourself
Turn your PDF publications into a flip-book with our unique Google optimized e-Paper software.
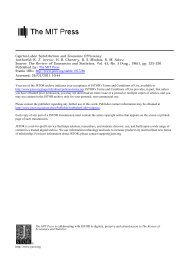
<strong>Wisconsin</strong> Farm Income<br />
After two consecutive record-setting<br />
years, <strong>Wisconsin</strong> net farm income<br />
plummeted in 2009. We estimate it<br />
to be $1.1 billion, which is less than<br />
half <strong>of</strong> 2008’s $2.6 billion and the<br />
lowest net farm income since 2002.<br />
U.S. net farm income also fell, but<br />
only by a third, compared to <strong>Wisconsin</strong>’s<br />
drop <strong>of</strong> 56 percent. <strong>Wisconsin</strong><br />
was hit harder because <strong>of</strong> a<br />
disproportionately large drop in the<br />
price <strong>of</strong> milk relative to changes in<br />
farm prices for other commodities.<br />
Sales <strong>of</strong> commodities from <strong>Wisconsin</strong><br />
farms in 2009 were <strong>of</strong>f $1.8 billion<br />
from 2008. Nearly 80 percent <strong>of</strong><br />
that decline came from milk sales,<br />
which were down $1.4 billion.<br />
<strong>Wisconsin</strong> farmers got some relief in<br />
2009 from a decrease in the costs <strong>of</strong><br />
$Million<br />
2,750<br />
2,500<br />
2,250<br />
2,000<br />
1,750<br />
1,500<br />
1,250<br />
1,000<br />
750<br />
500<br />
250<br />
I. <strong>Status</strong> <strong>of</strong> the <strong>Wisconsin</strong> Farm Economy<br />
Ed Jesse (608-262-6348) and Bruce Jones (608) 265-8508<br />
<strong>Wisconsin</strong> (Left Axis)<br />
United States (Right Axis)<br />
many inputs, which had soared in<br />
2008. In particular, expenditures for<br />
fertilizers and lime were down 28<br />
percent and fuel costs were 32 percent<br />
lower. But these savings on purchased<br />
inputs did little to <strong>of</strong>fset<br />
farmers’ massive loss <strong>of</strong> revenue.<br />
<strong>Wisconsin</strong> Farm Balance Sheet<br />
Dairy farm revenue for most <strong>of</strong> 2009<br />
fell far short <strong>of</strong> operating costs,<br />
causing many dairy farmers to tap<br />
financial reserves, liquidate assets or<br />
borrow operating capital to make up<br />
the shortfall. Equity was eroded<br />
through a decrease in assets or an<br />
increase in liabilities.<br />
Fortunately, the <strong>Wisconsin</strong> farm sector—in<br />
the aggregate—was on solid<br />
financial ground going into 2009.<br />
Following the mid-1980s crash in<br />
land values, <strong>Wisconsin</strong> farmers paid<br />
Source: Economic Research Service, USDA<br />
*2009 <strong>Wisconsin</strong> Income Estimated by Authors<br />
Net Farm Income: U.S. and <strong>Wisconsin</strong><br />
<strong>of</strong>f debt and enjoyed steady<br />
increases in land values through the<br />
1990s. Land values have escalated<br />
during the current decade, especially<br />
since 2005, while farm debt<br />
increased only modestly. At the end<br />
<strong>of</strong> 2008, the debt-to-asset ratio for<br />
<strong>Wisconsin</strong> farms in the aggregate<br />
stood at 0.11, lower than at any time<br />
over the last 50 years.<br />
However, aggregate figures hide<br />
some red flags pertaining to the<br />
composition <strong>of</strong> farm assets and debt<br />
across farms by economic class.<br />
Commercial farms—responsible for<br />
the bulk <strong>of</strong> commodity sales—hold<br />
a small share <strong>of</strong> total farm assets relative<br />
to their share <strong>of</strong> farm sales and<br />
a disproportionately large share <strong>of</strong><br />
debt. Farms with sales <strong>of</strong> less than<br />
$100,000, most <strong>of</strong> which are rural<br />
residences whose owners have full-<br />
0<br />
0<br />
1981 1985 1989 1993 1997 2001 2005 2009*<br />
STATUS OF WISCONSIN AGRICULTURE <strong>2010</strong>—THE WISCONSIN FARM ECONOMY 1<br />
120<br />
110<br />
100<br />
90<br />
80<br />
70<br />
60<br />
50<br />
40<br />
30<br />
20<br />
10<br />
$Billion