32 - Drees & Sommer
32 - Drees & Sommer
32 - Drees & Sommer

You also want an ePaper? Increase the reach of your titles
YUMPU automatically turns print PDFs into web optimized ePapers that Google loves.
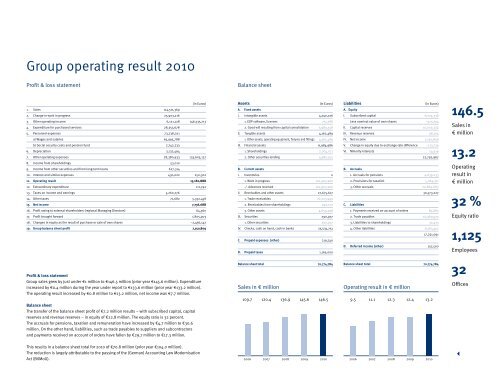
Group operating result 2010<br />
Profit & loss statement<br />
1. Sales<br />
2. Change in work in progress<br />
3. Other operating income<br />
4. Expenditure for purchased services<br />
5. Personnel expenses<br />
a) Wages and salaries<br />
b) Social security costs and pension fund<br />
6. Depreciation<br />
7. Other operating expenses<br />
8. Income from shareholdings<br />
9. Income from other securities and from long-term loans<br />
10. Interest and similar expenses<br />
11. Operating result<br />
12. Extraordinary expenditure<br />
13. Taxes on income and earnings<br />
14. Other taxes<br />
15. Net income<br />
16. Profit owing to external shareholders (regional Managing Directors)<br />
17. Profit brought forward<br />
18. Changes in equity as the result of purchase or sale of own shares<br />
19. Group balance sheet profit<br />
114,511,369<br />
25,903,216<br />
6,121,128<br />
28,353,678<br />
73,738,021<br />
65,995,788<br />
7,742,233<br />
3,1<strong>32</strong>,494<br />
28,380,933<br />
53,010<br />
627,314<br />
430,022<br />
5,260,776<br />
71,682<br />
(in Euros)<br />
146,535,713<br />
133,605,127<br />
250,302<br />
13,180,888<br />
111,742<br />
5,3<strong>32</strong>,458<br />
7,736,688<br />
64,360<br />
1,805,903<br />
–2,456,142<br />
7,150,809<br />
Profit & loss statement<br />
Group sales grew by just under €1 million to €146.5 million (prior year €145.6 million). Expenditure<br />
increased by €0.4 million during the year under report to €133.6 million (prior year €133.2 million).<br />
The operating result increased by €0.8 million to €13.2 million, net income was €7.7 million.<br />
Balance sheet<br />
The transfer of the balance sheet profit of €7.2 million results – with subscribed capital, capital<br />
reserves and revenue reserves – in equity of €22.8 million. The equity ratio is <strong>32</strong> percent.<br />
The accruals for pensions, taxation and remuneration have increased by €4.7 million to €30.6<br />
million. On the other hand, liabilities, such as trade payables to suppliers and subcontractors<br />
and payments received on account of orders have fallen by €29.7 million to €17.3 million.<br />
This results in a balance sheet total for 2010 of €70.8 million (prior year €104.0 million).<br />
The reduction is largely attributable to the passing of the (German) Accounting Law Modernisation<br />
Act (BilMoG).<br />
Balance sheet<br />
Assets (in Euros)<br />
A. Fixed assets<br />
I. Intangible assets<br />
4,740,726<br />
1. EDP software, licenses<br />
751,188<br />
2. Good will resulting from capital consolidation 3,989,538<br />
II. Tangible assets<br />
4,162,489<br />
1. Other assets, operating equipment, fixtures and fittings 4,162,489<br />
III. Financial assets<br />
6,984,986<br />
1. Shareholdings<br />
2,004,071<br />
2. Other securities lending<br />
4,980,915<br />
B. Current assets<br />
I. Inventories<br />
1. Work in progress<br />
./. Advances received<br />
II. Receivables and other assets<br />
1. Trade receivables<br />
2. Receivables from shareholdings<br />
3. Other assets<br />
III. Securities<br />
1. Other securities<br />
IV. Checks, cash on hand, cash in banks<br />
C. Prepaid expenses (other)<br />
D. Prepaid taxes<br />
Balance sheet total<br />
Sales in € million<br />
0<br />
101,907,960<br />
101,907,960<br />
27,675,617<br />
22,723,949<br />
292,170<br />
4,659,498<br />
290,977<br />
290,977<br />
25,535,251<br />
109.7 120.4 136.9 145.6 146.5<br />
2006 2007 2008 2009 2010<br />
219,740<br />
1,165,000<br />
70,774,784<br />
Liabilities<br />
A. Equity<br />
(in Euros)<br />
I. Subscribed capital<br />
6,074,336<br />
Less nominal value of own shares<br />
–373,794<br />
II. Capital reserves<br />
10,002,3<strong>32</strong><br />
III. Revenue reserves<br />
98,104<br />
IV. Net income<br />
7,150,809<br />
V. Change in equity due to exchange rate difference –213,739<br />
VI. Minority interests<br />
54,919<br />
22,792,967<br />
B. Accruals<br />
1. Accruals for pensions<br />
2. Provisions for taxation<br />
3. Other accruals<br />
C. Liabilities<br />
1. Payments received on account of orders<br />
2. Trade payables<br />
3. Liabilities to shareholdings<br />
4. Other liabilities<br />
D. Deferred income (other)<br />
Balance sheet total<br />
Operating result in € million<br />
4,639,233<br />
5,064,311<br />
20,869,683<br />
30,573,227<br />
85,682<br />
10,969,525<br />
<strong>32</strong>,433<br />
6,163,452<br />
17,251,091<br />
9.5 11.1 12.3 12.4 13.2<br />
2006 2007 2008 2009 2010<br />
157,500<br />
70,774,784<br />
146.5<br />
Sales in<br />
€ million<br />
13.2<br />
Operating<br />
result in<br />
€ million<br />
<strong>32</strong> %<br />
Equity ratio<br />
1,125<br />
Employees<br />
<strong>32</strong><br />
Offices