2011 Annual Report - OTCIQ.com
2011 Annual Report - OTCIQ.com
2011 Annual Report - OTCIQ.com

Create successful ePaper yourself
Turn your PDF publications into a flip-book with our unique Google optimized e-Paper software.
<strong>2011</strong> <strong>Annual</strong> <strong>Report</strong>
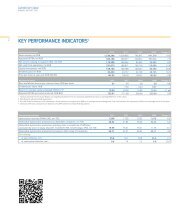
E.ON Group Financial Highlights 1<br />
€ in millions <strong>2011</strong> 2010 +/- %<br />
Electricity sales 2 (billion kWh) 1,144.8 1,030.4 +11<br />
Gas sales 2 (billion kWh) 1,718.1 1,342.4 +28<br />
Sales 112,954 92,863 +22<br />
EBITDA 3 9,293 13,346 -30<br />
EBIT 3 5,438 9,454 -42<br />
Net loss/Net in<strong>com</strong>e -1,861 6,281 -130<br />
Net loss/Net in<strong>com</strong>e attributable to shareholders of E.ON AG -2,219 5,853 -138<br />
Underlying net in<strong>com</strong>e 3 2,501 4,882 -49<br />
Investments 6,524 8,286 -21<br />
Cash provided by operating activities of continuing operations 6,610 10,614 -38<br />
Economic net debt (at year-end) -36,385 -37,701 +1,316 4<br />
Debt factor 5 3.9 2.8 +1.1 4<br />
Equity 39,613 45,585 -13<br />
Total assets 152,872 152,881 –<br />
ROACE (in %) 8.4 14.4 -6.0 6<br />
Pretax cost of capital (%) 8.3 8.3 –<br />
After-tax cost of capital (%) 6.1 6.1 –<br />
Value added 90 4,000 -98<br />
Employees (at year-end) 78,889 85,105 -7<br />
Earnings per share 7, 8 (€) -1.16 3.07 –<br />
Equity per share 7, 8 (€) 18.76 21.87 -14<br />
Dividend per share 9 (€) 1.00 1.50 -33<br />
Dividend payout 1,905 2,858 -33<br />
Market capitalization8 (€ in billions) 31.8 43.7 -27<br />
1 Adjusted for discontinued operations.<br />
2 Includes trading sales volume.<br />
3 Adjusted for extraordinary effects (see Glossary).<br />
4 Change in absolute terms.<br />
5 Ratio of economic net debt and EBITDA.<br />
6 Change in percentage points.<br />
7 Attributable to shareholders of E.ON AG.<br />
8 Based on shares outstanding.<br />
9 For the respective financial year; the <strong>2011</strong> figure is management’s proposed dividend.
Contents<br />
2 CEO Letter<br />
4 E.ON Stock<br />
6 Combined Group Management <strong>Report</strong><br />
6 Corporate Profile and Operating Environment<br />
24 Earnings Situation<br />
36 Financial Condition<br />
40 Asset Situation<br />
41 E.ON AG’s Earnings, Financial, and Asset Situation<br />
42 Corporate Sustainability<br />
43 Employees<br />
47 Technology and Innovation<br />
50 Risk <strong>Report</strong><br />
60 Forecast<br />
66 Consolidated Financial Statements<br />
66 Independent Auditor’s <strong>Report</strong><br />
68 Consolidated Statements of In<strong>com</strong>e<br />
69 Consolidated Statements of Recognized In<strong>com</strong>e<br />
and Expenses<br />
70 Consolidated Balance Sheets<br />
72 Consolidated Statements of Cash Flows<br />
74 Statement of Changes in Equity<br />
76 Notes<br />
158 Declaration of the Board of Management<br />
159 Disclosures on Companies in which<br />
Share Investments Are Held<br />
174 Corporate Governance <strong>Report</strong><br />
174 Corporate Governance Declaration 1<br />
180 Compensation <strong>Report</strong> 1<br />
190 Supervisory Board and Board of Management<br />
190 <strong>Report</strong> of the Supervisory Board<br />
194 Members of the Supervisory Board<br />
196 Disclosure of Takeover Barriers 1<br />
199 Internal Control System for the Accounting Process 1<br />
202 Explanatory <strong>Report</strong> of the Board of Management<br />
203 Members of the Board of Management<br />
204 Tables and Explanations<br />
204 Summary of Financial Highlights<br />
205 Glossary of Financial Terms<br />
209 Financial Calendar<br />
1 Part of the Combined Group Management <strong>Report</strong>.<br />
CEO Letter<br />
E.ON Stock<br />
Combined Group Management <strong>Report</strong><br />
Consolidated Financial Statements<br />
Corporate Governance <strong>Report</strong><br />
Supervisory Board and Board of Management<br />
Tables and Explanations
2<br />
CEO Letter<br />
Despite a difficult business environment—weak energy demand and its adverse impact on capacity utilization, prices, and<br />
margins; keen <strong>com</strong>petitive pressure in our gas wholesale business; and the early shutdown of a number of our nuclear power<br />
stations in Germany—in <strong>2011</strong> we were able to move forward with our strategy and, under our E.ON 2.0 program, to take the<br />
first important steps towards a significantly more efficient organizational setup.<br />
Our EBITDA reflects two main effects: a non-recurring adverse effect of €1.5 billion relating to the early shutdown of nuclear<br />
power stations in Germany and a loss in our gas wholesale business in the high three-digit million range. It was predominantly<br />
these factors that necessitated a correction in our earnings guidance at the time of our half-year interim report. Our full-year<br />
results are in line with this adjusted guidance. Our sales rose to €113 billion. Our <strong>2011</strong> EDITDA of €9.3 billion was 30 percent below<br />
the high prior-year figure, and our underlying net in<strong>com</strong>e was €2.5 billion. Nevertheless, we’ll re<strong>com</strong>mend to the <strong>Annual</strong><br />
Shareholders Meeting the payment of a cash dividend of €1 per share for the <strong>2011</strong> financial year. Furthermore, E.ON plans to<br />
pay a divided of €1.10 per share for the 2012 financial year and at least €1.10 for the 2013 financial year.<br />
To ensure that we continue to have the necessary earnings strength going forward, we’re systematically realigning our business<br />
for the future. We’re guided by the four key <strong>com</strong>ponents of our strategy for cleaner & better energy: focus our business in Europe,<br />
enhance our performance by increasing our efficiency and improving our organizational setup, optimize our investment strategy,<br />
and achieve selective growth outside Europe. We made significant progress in all of these areas in <strong>2011</strong>.<br />
We’re focusing our businesses in Europe and systematically seizing the opportunities created by the transformation of its energy<br />
system. A key focus of our growth in Europe is renewables, particularly offshore wind. In <strong>2011</strong>, our pacesetting role earned us a<br />
Global Energy Award in the category Green Power Producer of the Year. Our strong growth will continue. Over the next five years,<br />
we plan to invest €7 billion to expand our renewables capacity. More than €2 billion of this figure is for the construction of<br />
three large offshore wind farms in the North Sea and Baltic Sea. Going forward, we intend to <strong>com</strong>mission a new offshore wind<br />
farm every 18 months and at the same time further significantly reduce the costs of building and operating these assets. Together<br />
with careful site selection and planning, these cost reductions will ensure that our investments yield consistently attractive<br />
returns. Distributed generation also has the potential to play an important role in the energy world of the future. A team of experts<br />
drawn from across our <strong>com</strong>pany is currently designing a strategy for propelling E.ON’s growth in this area.<br />
The business environment for conventional generation, however, has deteriorated in most European markets. The economic<br />
situation is temporarily dampening the demand for power, resulting in markedly narrower margins and lower utilization factors<br />
for our conventional power stations. Primarily in our markets in Southern Europe but also in the Benelux countries and Central<br />
Europe, we currently face overcapacity, low power prices, and narrower margins, particularly in power generation. This made it<br />
necessary for us to record impairment charges totaling approximately €3 billion on our businesses in <strong>2011</strong>. We’re responding by<br />
taking steps to further optimize our conventional generation portfolio. We’re reducing costs, enhancing our assets’ ability to be<br />
dispatched more flexibly where possible, and looking into shutting down facilities temporarily or permanently where necessary.<br />
We’re also responding to a dramatically altered market environment in our gas business. The extraction of new, unconventional<br />
reserves has massively altered the global gas market, and, at least for now, is resulting in oversupply and is putting our business<br />
under enormous pressure. From an organizational perspective, the separation of our gas-supply, gas-storage, and LNG businesses<br />
from our trading business no longer offers any advantages. We’re going to <strong>com</strong>bine these businesses, which will enable us to<br />
better realize synergy potential by, for example, taking an integrated approach to marketing our assets and contracts and by<br />
having a consistent market presence. As for our long-term gas supply contracts, we’ve made further progress in adjusting them<br />
to reflect new market realities. In <strong>2011</strong>, we negotiated more favorable terms for about 40 percent of our long-term contracted<br />
gas offtake. We continue to expect that we can bring all our long-term gas supply contracts to a <strong>com</strong>petitive level by 2013.
Europe’s energy markets are consolidating. The growth opportunities are primarily elsewhere. We’re already very successful in<br />
two markets outside Europe: onshore wind in North America and conventional power generation in Russia. In North America,<br />
we’re building what is already our seventeenth wind farm, and our 2.2 gigawatts (“GW”) of installed capacity ranks us among<br />
the top-five wind-power players in the United States. In Russia, we <strong>com</strong>missioned three technologically advanced gas-fired<br />
generating units with a total capacity of 1.2 GW through year-end <strong>2011</strong>, and all of them offer attractive returns on our investment.<br />
Many other parts of the world face the challenge of producing enough electricity to power their robust economic growth. Our<br />
intention to forge a strategic partnership with Brazil’s MPX represents our first step. Together, we plan to build roughly 20 GW<br />
of conventional and renewable-source generating capacity in this booming region. We’re currently also talking to potential<br />
partners in Turkey and India about opportunities for cooperation. We expect concrete results in the course of 2012.<br />
In view of the business challenges we face in Europe in the next several years, however, we need to adopt a different strategy<br />
for our growth investments. We need to create more value with less capital. This means, for example, that we’ll no longer<br />
necessarily be both operator and sole owner of wind farms. Instead, we’ll create value through wind-farm design, planning,<br />
construction, and operation. But our business remains capital intensive. E.ON 2.0, our efficiency-enhancement program, is<br />
making good progress. In mid-January, we reached an agreement with two trade unions (ver.di and IGBCE) on a collective-bargaining<br />
contract for the implementation of E.ON 2.0 in Germany. The contract establishes binding mechanisms and a socially<br />
responsible framework for the staff reductions that are necessary at E.ON. It lays the groundwork for employees to transition<br />
to a job elsewhere and for us to implement E.ON 2.0 as planned. This will enable us to reduce our controllable costs from<br />
roughly €11 billion in <strong>2011</strong> to not more than €9.5 billion anually by 2015 and give us flexibility for our investments in the future.<br />
I’d like to add that E.ON’s business performance is clearly reflected in the Board of Management’s <strong>com</strong>pensation, which will<br />
be significantly lower than in the prior year and is also below average among DAX 30 <strong>com</strong>panies.<br />
In line with our strategy, in <strong>2011</strong> we also worked systematically to improve E.ON’s financial strength and flexibility. By the end<br />
of the year, we had reduced E.ON’s net debt to about €36.4 billion and our net financial position to about -€18 billion. The<br />
main driver was the implementation of our divestment program. For example, in <strong>2011</strong> we sold Central Networks in the United<br />
Kingdom. Since November 2010, we’ve divested businesses worth approximately €9.2 billion.<br />
Policy decisions and massive changes in our markets are presenting us with unprecedented challenges. Our clear strategy gives<br />
us the answers for our business. We’re systematically reorganizing our business in Europe and in fast-growing markets elsewhere,<br />
achieving substantial cost reductions, and boosting our performance. Renewables, new markets like Russia, and gas production<br />
will already be mainstays of our business and earnings by 2013. We know that the <strong>com</strong>panies that remain successful in the new<br />
energy world will do more than adapt. They’ll set off in new directions. Just like E.ON is doing.<br />
Best wishes,<br />
Dr. Johannes Teyssen<br />
CEO Letter<br />
E.ON Stock<br />
Combined Group Management <strong>Report</strong><br />
Consolidated Financial Statements<br />
Corporate Governance <strong>Report</strong><br />
Supervisory Board and Board of Management<br />
Tables and Explanations<br />
3
4<br />
E.ON Stock<br />
E.ON Stock in <strong>2011</strong><br />
E.ON stock (factoring in reinvested dividends) finished <strong>2011</strong><br />
23 percent below its year-end closing price for 2010, thereby<br />
underperforming the STOXX Utilities index (-13 percent),<br />
Ten-Year Performance of E.ON Stock<br />
Investors who purchased €5,000 worth of E.ON stock at the<br />
end of 2001 and reinvested their cash dividends (including<br />
the special dividend in 2006) saw the value of their investment<br />
increase to €6,804 by the end of <strong>2011</strong>, which represents an<br />
average annual return of 3.1 percent. E.ON stock thus slightly<br />
underperformed the STOXX Utilities (+3.5 percent) but outperformed<br />
the DAX (+1.3 percent) and the EURO STOXX 50<br />
(-2.2 percent).<br />
Development 2000–<strong>2011</strong><br />
E.ON<br />
+/- %<br />
+36<br />
STOXX Utilities +41<br />
DAX +14<br />
EURO STOXX -20<br />
Germany’s DAX index (-15 percent), and the EURO STOXX 50<br />
index (-14 percent). E.ON’s stock-exchange trading volume<br />
declined by 4 percent year on year to €57.4 billion due to the<br />
stock’s lower average price.<br />
Percentages E.ON EURO STOXX1 STOXX Utilities1 E.ON Stock Performance<br />
110<br />
100<br />
90<br />
80<br />
70<br />
60<br />
12/31/10 1/31/11 2/28/11 3/31/11 4/29/11 5/31/11 6/30/11 7/29/11 8/31/11 9/30/11 10/31/11 11/30/11 12/31/11<br />
1 Based on performance index.<br />
E.ON Stock Key Figures1 € per share<br />
Earnings attributable to the<br />
<strong>2011</strong> 2010<br />
shareholders of E.ON AG -1.16 3.07<br />
Earnings from underlying net in<strong>com</strong>e 1.31 2.56<br />
Dividend2 1.00 1.50<br />
Dividend payout (€ in millions) 1,905 2,858<br />
Twelve-month high3 25.11 29.36<br />
Twelve-month low3 Year-end closing price as of<br />
12.88 21.13<br />
December 303 Number of shares outstanding<br />
16.67 22.94<br />
(in millions) 1,905 1,905<br />
Market capitalization4 (€ in billions)<br />
E.ON stock trading volume<br />
31.8 43.7<br />
5<br />
(€ in billions) 57.4 59.8<br />
1 Adjusted for discontinued operations.<br />
2 For the respective financial year; the <strong>2011</strong> figure is management’s proposed<br />
dividend.<br />
3 Xetra.<br />
4 Based on ordinary shares outstanding.<br />
5 On all German stock exchanges, including Xetra.
Dividend<br />
At the 2012 <strong>Annual</strong> Shareholders Meeting, management will<br />
propose a cash dividend of €1 per share for the <strong>2011</strong> financial<br />
year (prior year: €1.50). The payout ratio (as a percentage of<br />
underlying net in<strong>com</strong>e) would be 76 percent <strong>com</strong>pared with<br />
a ratio of 59 percent in the prior year. Based on E.ON stock’s<br />
year-end <strong>2011</strong> closing price, the dividend yield is 6 percent. E.ON<br />
plans to pay out a per-share dividend of €1.10 for the 2012<br />
financial year and at least €1.10 for the 2013 financial year.<br />
Shareholder Structure<br />
Our most recent survey shows that we have roughly 79 percent<br />
institutional investors and 21 percent retail investors.<br />
Investors in Germany hold about 35 percent of our stock, those<br />
outside Germany the remaining about 65 percent .<br />
Shareholder Structure by Group 1<br />
Retail<br />
investors 21%<br />
Institutional<br />
investors 79%<br />
1 Percentages based on total investors identified.<br />
Sources: Share register (as of January 31, 2012),<br />
Thomson Reuters (as of December 31, <strong>2011</strong>).<br />
Shareholder Structure by Country/Region 1<br />
Rest of world<br />
Switzerland<br />
4%<br />
5%<br />
France 10%<br />
U.K. 13%<br />
Rest of Europe 14%<br />
USA and Canada 19%<br />
1 Percentages based on total investors identified.<br />
Sources: Share register (as of January 31, 2012),<br />
Thomson Reuters (as of December 31, <strong>2011</strong>).<br />
35% Germany<br />
1.50<br />
1.00<br />
0.50<br />
1.12<br />
47<br />
Investor Relations<br />
1.37<br />
51<br />
CEO Letter<br />
E.ON Stock<br />
Combined Group Management Management <strong>Report</strong><br />
Consolidated Financial Financial Statements<br />
Corporate Governance <strong>Report</strong><br />
Supervisory Board and Board of Management<br />
Tables and Explanations<br />
Dividend per Share<br />
€ per share Dividend Payout ratio1 (%)<br />
Our investor relations (“IR”) are founded on four principles:<br />
openness, continuity, credibility, and equal treatment of all<br />
investors. Each year we work hard to be even better in each<br />
of these areas. Our mission is to provide prompt, transparent<br />
information at our periodic road shows, at conferences,<br />
at eon.<strong>com</strong>, and when we meet personally with investors.<br />
The <strong>2011</strong> financial year was characterized by challenges<br />
resulting from the transformation of Germany’s energy system.<br />
On the release of our half-year results in August, we therefore<br />
adjusted our financial targets for <strong>2011</strong> and 2013 to reflect<br />
our altered business environment. Despite the adjustments<br />
to key metrics (EBITDA, underlying net in<strong>com</strong>e, and dividend),<br />
we will continue on the strategic course we have set. Furthermore,<br />
to underscore the importance of our IR principles, we<br />
also issued, for the first time, a longer-term forecast. The<br />
disclosure of our targets for 2015 is designed to provide investors<br />
with even more transparency. Alongside the sale of noncore<br />
assets and the focus on growth businesses, we have<br />
launched a significant cost-cutting program that will permanently<br />
reduce our controllable costs to €9.5 billion by 2015.<br />
Despite our difficult business environment, we continued to<br />
seek opportunities for intensive, personal dialog with our<br />
analysts and investors. Continually <strong>com</strong>municating with our<br />
investors and strengthening our relationships with them are<br />
essential for good IR.<br />
Want to find out more?<br />
eon.<strong>com</strong>/investors<br />
You can contact us at:<br />
investorrelations@eon.<strong>com</strong><br />
1.50<br />
51<br />
1.50<br />
54<br />
1.50<br />
59<br />
1.00<br />
2006 2007 2008 2009 2010 <strong>2011</strong><br />
1Payout ratio not adjusted for discontinued operations.<br />
76<br />
5
6 Combined Group Management <strong>Report</strong><br />
EBITDA down by 30 percent<br />
Cash provided by operating activities down by 38 percent<br />
Management to propose dividend of €1 per share<br />
2012 EBITDA expected at between €9.6 and €10.2 billion and<br />
2013 EBITDA still expected to be between €11.6 and €12.3 billion<br />
Corporate Profile and Operating Environment<br />
Corporate Structure and Operations<br />
E.ON is a major investor-owned energy <strong>com</strong>pany. Our setup<br />
ensures that roles and responsibilities are clearly defined<br />
across our organization so that we can achieve our objectives<br />
in the most efficient way possible. Our operations are segmented<br />
into global units and regional units. This setup took<br />
effect on January 1, <strong>2011</strong>. Figures of our former market units<br />
were allocated to our new entities.<br />
E.ON AG in Düsseldorf serves as Group Management. It oversees<br />
and coordinates the operations of the entire Group.<br />
We see ourselves as a global, specialized provider of energy<br />
solutions. Five global units are responsible for Generation,<br />
Renewables, New Build & Technology, Gas, and Trading. Twelve<br />
regional units manage our operating business in Europe.<br />
Russia is a special focus country. Support functions like IT, procurement,<br />
and business processes are organized functionally.<br />
Group Management<br />
Group Management in Düsseldorf oversees the E.ON Group<br />
as a whole and coordinates its operations. Its tasks include<br />
charting E.ON’s strategic course, defining its financial policy<br />
and initiatives, managing business issues that transcend<br />
individual markets, managing risk, continually optimizing the<br />
Group’s business portfolio, and conducting stakeholder<br />
management.<br />
IT, procurement, insurance, consulting, and business processes<br />
provide valuable support for our core businesses wherever<br />
we operate. These functions are centrally organized so that<br />
we pool professional expertise across our organization and<br />
leverage synergies.
Global Units<br />
We manage all our operations in Europe’s converging markets<br />
on a cross-border basis through functionally segmented<br />
entities called global units.<br />
Four of our global units are reporting segments: Generation,<br />
Renewables, Gas, and Trading (see the Forecast section for<br />
our new segmentation effective 2012). A fifth, New Build &<br />
Technology, is not.<br />
New Build & Technology brings together our <strong>com</strong>prehensive<br />
project-management and engineering expertise to support<br />
the construction of new power plants and the operation of<br />
existing plants across E.ON. This unit also coordinates our<br />
Group-wide research and development projects for the E.ON<br />
Innovation Centers.<br />
Generation<br />
Our generation fleet is one of the biggest and most efficient<br />
in Europe. We have major asset positions in Germany, the<br />
United Kingdom, Sweden, Italy, Spain, France, and the Benelux<br />
countries, giving us one of the broadest geographic footprints<br />
among European power producers. We also have one of the<br />
most balanced fuel mixes in our industry.<br />
The Generation global unit consists of all of our conventional<br />
(fossil and nuclear) generation assets in Europe. It manages<br />
and optimizes these assets across national boundaries.<br />
Renewables<br />
Our Renewables global unit plays a key role in expanding<br />
renewables capacity in many countries across Europe and the<br />
world. Renewables are good for the environment and have<br />
great potential as a business. This is why we are steadily<br />
increasing renewables’ share of our generation portfolio and<br />
aim to play a leading role in this growing market. We continually<br />
seek out new solutions and technologies that will make<br />
the energy supply more environmentally friendly. We therefore<br />
make significant investments in wind, biomass, solar, and<br />
marine energy.<br />
Gas<br />
Our Gas global unit operates along the entire gas value chain.<br />
It has a growing exploration and production business and<br />
is also active in the global liquefied natural gas business. We<br />
rank among Europe’s largest gas <strong>com</strong>panies and supply gas<br />
to resellers (regional and municipal utilities), large industrial<br />
customers, and gas-fired power stations in Germany and in<br />
other European countries. Our geographically diverse portfolio<br />
of long-term supply contracts with key producing countries<br />
CEO Letter<br />
E.ON Stock<br />
Combined Group Management Management <strong>Report</strong><br />
Consolidated Financial Financial Statements<br />
Corporate Governance <strong>Report</strong><br />
Supervisory Board and Board of Management<br />
Tables and Explanations<br />
makes us a mainstay of gas supply security in Europe. We are<br />
also engaged in gas storage in Germany, Austria, Hungary,<br />
and the United Kingdom and in gas transmission in Germany.<br />
Trading<br />
As the link between E.ON and the world’s wholesale energy<br />
markets, our Trading global unit buys and sells electricity,<br />
natural gas, oil, coal, freight, biomass, and carbon allowances.<br />
It ensures the best-possible utilization of our generation<br />
fleet in Europe, trades and procures worldwide the fuel and<br />
carbon allowances needed to operate this fleet, and locks<br />
in margins for our generation in forward markets. By doing<br />
so, it aggregates and minimizes our <strong>com</strong>modity price risk.<br />
Regional Units<br />
Twelve regional units manage our operating business in<br />
Europe. They are responsible for sales, regional energy networks,<br />
and distributed generation. They are also close partners of<br />
the global units operating in their respective region, for which<br />
they provide a broad range of important functions, such as<br />
HR management and accounting. In addition, they are the sole<br />
point of contact for all stakeholders, including policymakers,<br />
government agencies, trade associations, and the media.<br />
In <strong>2011</strong>, we were active in the following countries: Germany,<br />
the United Kingdom, Sweden, Italy, Spain, France, the Netherlands,<br />
Hungary, Czechia, Slovakia, Romania, and Bulgaria.<br />
Russia is a special focus country, where our business centers<br />
on power generation. This business is not integrated into<br />
the Generation global unit because of its geographic location<br />
and because Russia’s power system is not part of Europe’s<br />
integrated grid.<br />
In addition, through E.ON International Energy (which is not<br />
a reporting segment) we want to work with local partners to<br />
develop renewable-source and conventional generating<br />
capacity in attractive, fast-growing regions outside Europe.<br />
7
8 Corporate Profile and Operating Environment<br />
Strategy<br />
Cleaner & better energy—in and outside Europe—is the<br />
guiding theme of the new strategic course we announced in<br />
November 2010. E.ON will transform itself from a primarily<br />
European energy utility into a global, specialized provider of<br />
energy solutions. Our new course states a clear <strong>com</strong>mitment<br />
on our part and provides answers not only to current challenges<br />
but also to long-term megatrends in the European and global<br />
energy world.<br />
By making cleaner & better energy our guiding theme, we are<br />
not setting targets for E.ON or for policymakers but rather<br />
stating our <strong>com</strong>mitment to improving the world of energy<br />
wherever we operate. We purposely chose “clean” and not<br />
“green.” And we purposely chose the <strong>com</strong>parative form because<br />
this is not about defining absolute metrics or uniform targets for<br />
all parts of the world but rather about continual improvement<br />
processes. In this sense, our products and services are cleaner<br />
if they substantially improve energy quality in terms of environmental<br />
protection and efficiency. Our energy is better when<br />
our performance and the way we deploy technologies are<br />
significantly better than our <strong>com</strong>petitors, thereby enabling us<br />
to design superior products and services for our customers.<br />
Though the market environment in Europe became even more<br />
difficult for us in <strong>2011</strong>, we remain firmly convinced that this<br />
strategy prepares us well for the future. We believe that the<br />
European energy system’s trend towards renewables will<br />
continue. And we believe that in many markets outside Europe<br />
the demand for energy will continue to increase, fueled by<br />
steady population growth and rising living standards. In all<br />
our markets, however, we will only achieve lasting success<br />
if we focus on what we do better than others and if our superior<br />
performance enables us to offer products and services at<br />
<strong>com</strong>petitive terms.<br />
E.ON’s transformation will not happen overnight. Nevertheless,<br />
we already made noteworthy progress in executing our<br />
strategy in many areas during <strong>2011</strong>. This is all the more<br />
remarkable because we continue to face a challenging market<br />
environment in Europe. Power and gas markets remain oversupplied,<br />
and government regulation and intervention continue<br />
to increase. In addition, our business is affected by Germany’s<br />
decision to transform its energy system and to accelerate the<br />
phaseout of nuclear energy as well as by new recessionary<br />
fears stemming from Europe’s debt crisis. It is also affected by<br />
technological developments, such as the significant decrease<br />
in the manufacturing costs of equipment for renewable-source<br />
power generation.<br />
Our strategy focuses on achieving clear <strong>com</strong>petitive advantages<br />
and offering efficient, environmentally friendly energy<br />
solutions in and outside Europe. The transformation of our<br />
<strong>com</strong>pany will benefit our employees, customers, and investors<br />
alike.<br />
Strategic Focus Areas<br />
Everywhere we operate we have a single objective: we want<br />
energy to be cleaner and better. Even in economically difficult<br />
times, we are convinced that affordability, security of supply,<br />
and climate protection can be mutually <strong>com</strong>patible elements<br />
of a successful business strategy.<br />
In the years ahead, we will adjust E.ON’s business portfolio<br />
in line with our strategy, thereby propelling E.ON’s transformation.<br />
Our main focus will be on expanding our operations<br />
in renewables, generation outside Europe, and decentralized<br />
energy solutions. These are the areas in which we see significant<br />
market opportunities and can capitalize on our capabilities.<br />
We will therefore direct our new growth investments<br />
at these businesses. In Europe, we will sharpen the focus of<br />
our current position. To achieve this, we will concentrate on<br />
activities in which we can leverage our expertise as well as<br />
cross-border and cross-business synergies of scale and scope<br />
into attractive returns. To propel E.ON’s transformation and to<br />
increase our financial flexibility, we plan to divest €15 billion<br />
worth of businesses by the end of 2013. By the end of <strong>2011</strong>, we<br />
had already made approximately €9.2 billion of divestments.<br />
Another key focus area will be performance and <strong>com</strong>petitiveness,<br />
which are decisive success factors in an increasingly<br />
demanding market environment. We will therefore not only<br />
make our organizational setup and processes significantly<br />
more efficient but also further enhance our operating performance.<br />
This will enable us to achieve sustained cost savings<br />
and to react more swiftly to market changes.
How will we achieve all this? The four key <strong>com</strong>ponents of our<br />
strategy provide answers:<br />
Europe<br />
Focused and<br />
synergetic<br />
positioning<br />
Investment<br />
Less capital,<br />
more value<br />
Performance<br />
Effi cient and<br />
effective<br />
organization<br />
Outside<br />
Europe<br />
Targeted<br />
expansion<br />
cleaner & better energy<br />
Europe<br />
Europe is and will remain our home market and the main focus<br />
of our business operations. But we will sharpen the focus of<br />
our businesses in Europe and, in light of the difficult market<br />
environment, systematically assess their <strong>com</strong>petitiveness<br />
and optimize them where necessary. The transformation of<br />
Europe’s energy system offers us attractive growth opportunities<br />
which we intend to seize. Electricity offers so many<br />
distinct advantages as an energy source that the electrification<br />
of daily life—at our homes and businesses, in industry and<br />
transportation—is nowhere near to <strong>com</strong>plete. Examples include<br />
electric heat pumps and electric vehicles. With these factors<br />
in mind, we have set the following course for our businesses<br />
in Europe:<br />
A key focus of our growth in Europe is renewables, primarily<br />
onshore and offshore wind but also solar and biomass. At<br />
the end of <strong>2011</strong>, we had almost 2 GW of installed capacity in<br />
these technologies in Europe, 17 percent more than at the<br />
end of 2010. In <strong>2011</strong>, our successful development of offshore<br />
wind projects earned us the coveted Global Energy Award<br />
in the category Green Power Producer of the Year. In the years<br />
ahead, E.ON will continue to rapidly expand its renewable<br />
capacity on an industrial scale. In doing so, we strive to further<br />
reduce the specific costs of renewables relative to conventional<br />
technologies, helping to make renewables increasingly<br />
<strong>com</strong>petitive. Over the next five years, we plan to invest at<br />
least €7 billion in renewables worldwide, a large portion of<br />
which will be in Europe. Focusing exclusively on the best<br />
locations and partners will ensure that our projects yield<br />
attractive returns.<br />
CEO Letter<br />
E.ON Stock<br />
Combined Group Management <strong>Report</strong><br />
Consolidated Financial Statements<br />
Corporate Governance <strong>Report</strong><br />
Supervisory Board and Board of Management<br />
Tables and Explanations<br />
Alongside renewables, <strong>com</strong>petitive conventional generation<br />
assets will remain an important part of E.ON’s business in<br />
Europe. Flexible, conventional generating capacity ideally<br />
supplements the steadily increasing proportion of renewables<br />
and ensures a reliable power supply even on cloudy, windless<br />
days. However, the conventional power generation business in<br />
Europe is facing substantial margin pressure due to the<br />
massive, publicly supported expansion of renewables and due<br />
to overcapacity in the wake of the economic crisis. In the<br />
years ahead, E.ON will therefore focus on optimizing its existing<br />
conventional generation portfolio to enhance its <strong>com</strong>petitiveness.<br />
This includes shutting down about 6 GW of installed<br />
capacity over the next three years for technical and regulatory<br />
reasons. In addition, we are investigating, on a case-by-case<br />
basis, the shutdown of unprofitable power stations. At the same<br />
time, we plan to invest selectively in flexible and climatefriendly<br />
generating capacity, such as new pumped-storage<br />
hydro stations.<br />
Due to the gradual phaseout of nuclear energy in Germany<br />
by 2022, we expect to achieve our emissions target—to halve,<br />
by 2020, our European generation portfolio’s specific carbon<br />
emissions from a 1990 baseline—five years later. This development<br />
is consistent with the EU’s ambitious targets, published<br />
at the end of <strong>2011</strong> in the European Energy Roadmap 2050,<br />
which also call for a 50-percent cut in specific carbon emissions<br />
in the power sector by 2025.<br />
We intend to enhance the <strong>com</strong>petitiveness of our sales business<br />
by making our organizational setup and processes even<br />
more efficient and by offering innovative power, gas, and<br />
heat products. In Germany, for example, we already offer certified<br />
green power tariffs. We aim to selectively expand our<br />
decentralized energy business and have accordingly made it<br />
a strategic development focus. Innovative customer solutions<br />
that we already offer in this area or are currently developing<br />
9
10 Corporate Profile and Operating Environment<br />
include decentralized generation systems such as small CHP<br />
units, energy-efficiency services such as energy-smart building<br />
upgrades, and integrated offerings such as smart-home packages<br />
that optimize residential energy consumption and supply.<br />
We will <strong>com</strong>bine our gas-supply, gas-storage, and LNG operations<br />
with our current energy trading business. This will enable<br />
us to better realize existing synergy potential and to ensure<br />
maximum value creation through the integrated optimization<br />
and marketing of E.ON’s assets and contracts. The successful<br />
adjustment of our long-term gas supply contracts to reflect<br />
new market realities remains a strategic priority. In <strong>2011</strong>, we<br />
achieved beneficial contract adjustments for about 40 percent<br />
of our long-term contracted gas offtake. Our aim is for our gas<br />
import business to return to a normal earnings level in 2013.<br />
On the production side, we intend to focus on organic growth<br />
in the North Sea and on continual performance improvements.<br />
Attractive distribution network businesses contribute significantly<br />
to the balance of our overall portfolio and play a critical<br />
role in the transformation of Europe’s energy system towards<br />
a greater reliance on renewables. We intend to focus on network<br />
businesses that deliver a consistently high financial<br />
and operating performance. We will develop these businesses<br />
in a way that is consistent with the requirements of the new<br />
energy world.<br />
Outside Europe<br />
The European Union is concentrating on transforming its<br />
energy system, whereas other parts of the world are experiencing<br />
strong demand growth and therefore need to add a<br />
huge amount of technologically advanced generating capacity.<br />
We have outstanding expertise in planning, building, and<br />
operating conventional and renewable generating facilities.<br />
Going forward, we intend to increasingly profit from this<br />
expertise outside Europe, as well.<br />
We will not only develop our existing businesses in Russia<br />
and North America but also expand into other attractive,<br />
fast-growing regions. After a thorough analysis phase in <strong>2011</strong>,<br />
we selected three countries as potential target markets:<br />
Brazil, Turkey, and India. Drawing on our capabilities, we intend<br />
to work with local partners in these markets to build renewable<br />
and conventional generating capacity in order to achieve<br />
profitable growth for <strong>com</strong>paratively less capital.<br />
Our operations in North America focus on renewables, particularly<br />
the development and operation of large onshore wind<br />
farms. We will continue to develop our current position, which<br />
consists of more than 2.2 GW of installed capacity, in accordance<br />
with the policy and regulatory framework. In Russia, our<br />
strategic focus is on the successful <strong>com</strong>pletion of our conventional<br />
power new-build program. After <strong>com</strong>missioning three<br />
state-of-the-art <strong>com</strong>bined-cycle gas turbines with a total<br />
capacity of 1.2 GW through the end of <strong>2011</strong>, we are now concentrating<br />
on rapidly <strong>com</strong>pleting the construction of a 0.8 GW<br />
coal-fired generating unit, which is scheduled to enter service<br />
in 2014. Our entire new-build program offers attractive returns<br />
and is making an important contribution to the modernization<br />
of power generation in Russia.<br />
We have already reached an important first milestone in<br />
executing our strategy to expand into new regions. We agreed<br />
to form a strategic partnership with Brazil’s MPX for investments<br />
in the Brazilian and Chilean energy markets. MPX has<br />
the largest portfolio of already licensed power generation<br />
projects in South America. E.ON and MPX intend to form a<br />
joint venture in which each holds 50 percent. Our ambition<br />
is to develop conventional and renewable generation projects<br />
with a total capacity of around 20 GW. This would give the<br />
joint venture 20 percent of the Brazilian generation market,<br />
making it the largest private energy <strong>com</strong>pany in Brazil. The<br />
formation of the joint venture is planned for the first half of<br />
2012 and will represent E.ON’s successful entry into the Brazilian<br />
market. We are currently also talking to promising local<br />
partners in Turkey and India about opportunities for cooperation.<br />
We expect concrete progress in the course of 2012.<br />
Performance<br />
Top performance is indispensable to remain successful in an<br />
increasingly <strong>com</strong>petitive and demanding environment. Only<br />
if E.ON can demonstrate superior performance will it create<br />
real added value and thus offer truly better energy to its customers.<br />
Our aim is to be in the top quartile of our industry for<br />
all the businesses we are active in. We want to be measured<br />
by our ability to deliver top performance and to actively and<br />
consistently embrace a performance culture.
Top performance requires efficient processes and an efficient<br />
organizational setup. Through an efficiency program called<br />
PerformtoWin, we already defined and delivered annual cost<br />
reductions and operational improvements of €1.5 billion starting<br />
in <strong>2011</strong>. We intend to build on this achievement. In August<br />
<strong>2011</strong>, we launched the E.ON 2.0 program. Its objective is to<br />
reduce E.ON’s controllable costs from roughly €11 billion in <strong>2011</strong><br />
to €9.5 billion by 2015 at the latest in order to give us greater<br />
flexibility for investments. It also aims to simplify E.ON’s<br />
organizational setup in order to speed up our decision-making.<br />
The third objective is to reduce our administrative functions<br />
to the absolute minimum in order to put our operating business<br />
at the center of what we do.<br />
E.ON 2.0 is making swift progress. In its first phase, twelve<br />
working groups, set up according to the structure of our business,<br />
identified specific efficiency-improvement potential<br />
in four key areas: changes to our organizational setup, leaner<br />
administrative functions, improvements in procurement, and<br />
operational excellence.<br />
On the organizational side, E.ON 2.0 aims to create a lean, transparent<br />
organizational setup with flat hierarchies. Currently,<br />
there are a number of E.ON <strong>com</strong>panies in <strong>com</strong>plex hierarchical<br />
structures, largely due to past mergers and acquisitions.<br />
Structural changes like the streamlining of Group Management,<br />
the reorganization of the Germany regional unit, the <strong>com</strong>bination<br />
of E.ON Energy Trading and E.ON Ruhrgas, and organizational<br />
improvements at the Generation global unit will<br />
s ignificantly improve management structures and clearly delineate<br />
responsibilities. At the same time, we intend to reduce<br />
the number of E.ON entities to create an organization with<br />
a clear focus on steering and management and on our operating<br />
business.<br />
On the administrative side, the program aims to streamline<br />
and consolidate IT and a number of other support functions.<br />
A benchmarking conducted in the summer of <strong>2011</strong> made possible<br />
a <strong>com</strong>prehensive and nuanced analysis of the effectiveness<br />
and efficiency of several corporate functions (finance,<br />
HR, procurement, and business services). The results show that<br />
many of our processes in these areas are highly effective but,<br />
<strong>com</strong>pared with our best peers, could be more efficient. E.ON 2.0<br />
will create standardized business and decision-making<br />
processes that are leaner and faster. A key focus is on establishing<br />
efficient support services tailored to the needs of<br />
E.ON’s operating business. For example, E.ON 2.0 also aims to<br />
CEO Letter<br />
E.ON Stock<br />
Combined Group Management <strong>Report</strong><br />
Consolidated Financial Statements<br />
Corporate Governance <strong>Report</strong><br />
Supervisory Board and Board of Management<br />
Tables and Explanations<br />
<strong>com</strong>bine into separate entities those support functions that<br />
offer considerable potential for standardization and thus for<br />
synergies and bundling effects.<br />
On the procurement side, the program aims to increase the<br />
efficiency and effectiveness of E.ON’s entire procurement<br />
organization. Currently, procurement functions are carried out<br />
by a range of E.ON entities and are not always clearly aligned<br />
with the requirements of our operating business. E.ON 2.0<br />
will help create functional, overarching procurement teams<br />
that can systematically leverage scale and synergy effects.<br />
Achieving procurement advantages through price negotiations,<br />
specification adjustments, and demand reduction is an important<br />
part of E.ON’s effort to meet its cost-reduction targets.<br />
On the operational side, E.ON 2.0 aims to make E.ON more<br />
<strong>com</strong>petitive relative to its peers in the long run. This applies<br />
primarily to our global generation operations and our local<br />
sales and infrastructure operations. The initiatives will include<br />
the standardization of processes as well as changes to our<br />
corporate structure that will enable us to achieve a top-quartile<br />
position in all our businesses.<br />
Completed in November <strong>2011</strong>, the first phase of E.ON 2.0<br />
identified specific savings potential and the levers for realizing<br />
this potential. In the next phase, this savings potential will be<br />
articulated in greater detail in more than 50 projects, delivered<br />
gradually through numerous individual measures starting in<br />
2012, and <strong>com</strong>pletely realized by the end of 2014 at the latest.<br />
In parallel to E.ON 2.0, E.ON will develop a performance culture<br />
that focuses on implementing decisions swiftly, standardizing<br />
processes and activities, delineating responsibilities clearly,<br />
and, more generally, always paying attention to what will create<br />
value for the Group. E.ON’s senior leadership is closely involved<br />
with E.ON 2.0 and will actively expedite the implementation of<br />
the changes that are ahead.<br />
11
12 Corporate Profile and Operating Environment<br />
Investments<br />
Although our market environment has be<strong>com</strong>e even more<br />
difficult, we see clear growth opportunities in energy markets,<br />
particularly in renewables and in conventional power generation<br />
outside Europe. But we also need to consider that in the<br />
years ahead E.ON will face significant business challenges<br />
resulting from public policy decisions and a significantly altered<br />
environment in European markets.<br />
If we want to optimally seize the market opportunities that<br />
are out there, we need to find new ways to achieve growth<br />
with less capital. We need to grow by deploying our expertise<br />
and less by deploying ever-increasing amounts of capital.<br />
We will take a variety of approaches to getting more value<br />
growth from less capital. For example, in renewables we will<br />
no longer necessarily be both operator and sole owner of<br />
wind farms. Instead, for projects where we find interested partners<br />
to be co-owners, we intend to concentrate on making<br />
our money through wind-farm design, planning, construction,<br />
and operation.<br />
This will apply even more so in new markets, where capital is<br />
available. What we will bring to the table is our expertise.<br />
We will work with financially sound partners that have good<br />
local connections. Our role will be to contribute our expertise<br />
in building and operating various generation technologies as<br />
well as our understanding of global wholesale markets. The<br />
idea behind this new strategy is for us to focus more on activities<br />
and process steps in which we are a world leader and<br />
in which the potential for value creation is high.<br />
We have high expectations for our planned investments for<br />
the period 2012–2014. In times of limited capital, it is essential<br />
to seize the most profitable opportunities in the market. We<br />
are therefore applying strict investment discipline and expect<br />
new growth projects, such as our planned offshore wind<br />
farms in Europe, to deliver a return significantly above their<br />
cost of capital. This additional return is generally 2.5 percentage<br />
points, but can vary by business area.<br />
Energy Policy and Regulatory Environment<br />
International<br />
Following a natural disaster, an accident occurred at a nuclear<br />
power station in Fukushima, Japan, on March 11, <strong>2011</strong>, resulting<br />
in the destruction of its reactors and the uncontrolled release<br />
of nuclear radiation. The 17th United Nations climate change<br />
conference took place in Durban, South Africa, from November<br />
28 to December 11, <strong>2011</strong>. Its resolutions included a <strong>com</strong>mitment<br />
to agree on a unilateral climate-protection agreement<br />
by 2015.<br />
Europe<br />
At the center of Europe’s energy-policy debate was the Energy<br />
Roadmap 2050 presented by the European Commission in<br />
December <strong>2011</strong>. It describes how Europe’s energy system will<br />
need to be transformed to reduce greenhouse-gas emissions<br />
by 80 to 95 percent by 2050 and at the same time to ensure<br />
supply security and affordable energy prices. The roadmap<br />
is not intended to replace the energy policies of the member<br />
states but rather to provide a framework for them.<br />
The main <strong>com</strong>ponents of the Energy Roadmap announced by<br />
EU Energy Commissioner Günther Oettinger are also contained<br />
in E.ON’s cleaner & better energy strategy.<br />
The Commission’s approach to transforming the energy<br />
system is substantially different from the German federal<br />
government’s. The EU approach is technology neutral, promotes<br />
further integration of EU internal market for energy,<br />
and requires a greater coordination of member-state energy<br />
policies, leading over the medium term to an extensive harmonization<br />
of energy-policy mechanisms.
The Energy Roadmap 2050 adopts a scenario technique in<br />
which five different scenarios are <strong>com</strong>pared with two reference<br />
scenarios. The four main decarbonization routes—energy<br />
efficiency, renewables, nuclear, and carbon capture and storage<br />
(“CCS”)—are <strong>com</strong>bined in the scenarios in different ways.<br />
Electricity is expected to double its share of energy consumption<br />
by 2050, decentralization will increase, and, with renewables<br />
providing most of Europe’s electricity (over 86 percent),<br />
electricity prices could increase by 82 percent by 2050 <strong>com</strong>pared<br />
with 2005. For the Commission, nuclear energy remains<br />
indispensible, particularly if CCS is not deployed.<br />
Regardless of the future energy mix, the cost of energy will<br />
rise. Yet the more European in scope the energy system is in<br />
the future, the more affordable energy will be for consumers,<br />
since the synergies of the internal market will make it possible<br />
to realize cost savings.<br />
The roadmap will now be submitted for debate in the European<br />
Parliament and European Council. The Commission’s first<br />
concrete step will be to present a Renewable Energy Strategy<br />
2030 late in the spring of 2012.<br />
Germany<br />
The energy-policy debate in Germany in <strong>2011</strong> focused on implementing<br />
the <strong>com</strong>ponents of the energy strategy announced<br />
in 2010. The strategy’s purpose is to enable Germany to gradually<br />
transition from its current energy supply to one based<br />
predominantly on renewables by 2050. Following the Fukushima<br />
accident, the federal government adopted resolutions on<br />
June 6, <strong>2011</strong>, that revised its energy strategy into what it calls<br />
the Energiewende: the transformation of the energy system.<br />
A central <strong>com</strong>ponent of this significantly accelerated transformation<br />
is moving Germany’s phaseout of nuclear energy up<br />
to 2022, thus rescinding the extension of nuclear power plant<br />
(“NPP”) operating lives. At the same time, the seven NPPs<br />
temporarily shut down during the moratorium were permanently<br />
shut down. Other <strong>com</strong>ponents of the transformation<br />
continue the course set by the energy strategy of 2010: the<br />
expansion of renewables and the expansion of network infrastructure.<br />
Many <strong>com</strong>ponents of the transformation (such<br />
as the building-upgrade program) had not yet been put into<br />
legislation in <strong>2011</strong>.<br />
CEO Letter<br />
E.ON Stock<br />
Combined Group Management <strong>Report</strong><br />
Consolidated Financial Statements<br />
Corporate Governance <strong>Report</strong><br />
Supervisory Board and Board of Management<br />
Tables and Explanations<br />
Incentive-Based Regulation<br />
The German Federal Court of Justice ruled in June <strong>2011</strong> that<br />
the German Federal Network Agency had set revenue caps,<br />
which are used to calculate network charges for the years<br />
2009 to 2012/2013, too low. The court stated that the German<br />
Energy Act does not give the agency the power to set a general<br />
productivity factor. Furthermore, it stated that network<br />
operators are entitled to a risk premium for equity of more<br />
than 40 percent. However, in <strong>2011</strong> the German federal government<br />
had already amended the general legislative foundation<br />
for the application of a productivity factor starting in 2012<br />
and plans to implement the Incentive Regulation Ordinance<br />
in 2012.<br />
Central Eastern Europe<br />
In view of the current economic and financial crisis, it is anticipated<br />
that energy markets in this region will see increasing<br />
political and regulatory intervention in the form of additional<br />
taxes, price moratoriums, and changes to support schemes<br />
for renewables.<br />
France<br />
Drawing on the Champsaur Commission’s report, in 2010 the<br />
French government produced a draft package of electricitymarket<br />
reforms (the package is known by its French acronym,<br />
NOME). Under NOME, regulated tariffs for medium-sized and<br />
industrial customers will be <strong>com</strong>pletely eliminated by 2015;<br />
regulated tariffs for residential and small-business customers<br />
will be retained for an initial period. NOME also calls for a<br />
15-year transition period during which <strong>com</strong>petitors in France’s<br />
electricity market will be given regulated access (at the<br />
ARENH tariff) to the baseload capacity of EdF’s existing NPPs.<br />
In the future, tariffs for small-business and residential customers<br />
will be adjusted towards the ARENH tariff in a way that<br />
ensures that alternative suppliers can be <strong>com</strong>petitive against<br />
the regulated tariff. In addition, the French government decided<br />
to introduce a capacity market by 2015 in order to ensure supply<br />
security during peakload hours. France also made changes<br />
to its support schemes for photovoltaic plants. In order to<br />
better manage the growth in new capacity, in <strong>2011</strong> France<br />
instituted a tender process for selected photovoltaic projects.<br />
13
14<br />
Corporate Profile and Operating Environment<br />
Italy<br />
In response to the economic crisis, the Italian government<br />
introduced a special tax levied only on energy <strong>com</strong>panies.<br />
Other policy debates affecting Italy’s energy market included<br />
the introduction of new dispatching rules, a reevaluation of<br />
existing incentive programs for renewables (which could result<br />
in lower feed-in tariffs), and a power-market reform focusing<br />
on changes to the clearing mechanism. Discussions continued<br />
on the introduction of a capacity market starting in 2017.<br />
Netherlands<br />
In <strong>2011</strong>, energy <strong>com</strong>panies and the Dutch government agreed<br />
to a Green Deal under which the operators of coal-fired power<br />
stations pledged to continue cofiring biomass at current levels<br />
from 2012 to 2014 (that is, after cofiring subsidies expire). In<br />
return, the government pledged to introduce a scheme to <strong>com</strong>pensate<br />
operators starting in 2015.<br />
Spain<br />
On October 1, 2010, Spain’s Council of Ministers promulgated<br />
a law to support domestic coal production. The measures to<br />
implement this law are supposed to be in place by 2014. In<br />
addition, a new ministerial decree to raise capacity payments<br />
was approved in November <strong>2011</strong>. These payments apply to<br />
all generation technologies except nuclear. Spain’s regulatory<br />
agency is now tasked with developing, in the first half of<br />
2012, a new market design for the capacity market, which would<br />
take effect after 2013. A royal decree of 2010 calls for the<br />
tariff deficit to be <strong>com</strong>pletely eliminated by 2013.<br />
Sweden<br />
Effective January 1, 2012, Sweden and Norway became the first<br />
countries to have a joint trading scheme for green-power<br />
certificates. The scheme is expected to add further impetus<br />
to the growth of renewables in both countries.<br />
In late <strong>2011</strong>, the Swedish government decided to double, for<br />
the next three years, the fee that NPP operators in Sweden<br />
pay for nuclear-waste management.<br />
The Swedish government is currently evaluating policies that<br />
give third parties access to the district-heating market. Such<br />
policies could enhance <strong>com</strong>petition in this market.<br />
United Kingdom<br />
The U.K. government is currently reforming the country’s<br />
wholesale power market with the aim of improving the investment<br />
climate for low-carbon technologies and enhancing<br />
supply security. The introduction of feed-in tariffs is intended<br />
to provide greater certainty of revenues for new nuclear<br />
capacity, renewables, and CCS. The introduction of a capacity<br />
market is intended to enhance supply security by promoting<br />
investment in flexible generating capacity that has short rampup<br />
and ramp-down times. It is anticipated that the drafting<br />
of legislation to implement these reforms will continue in the<br />
first half of 2012 and that the reforms will be in place by the<br />
end of 2014.<br />
Russia<br />
The gradual liberalization of Russia’s electricity market was<br />
<strong>com</strong>pleted in <strong>2011</strong>. Effective January 1, <strong>2011</strong>, <strong>com</strong>panies can<br />
sell their entire power output, with the exception of power<br />
supplied to residential and similarly classed customers, on<br />
the wholesale market. <strong>2011</strong> was also the first year in which<br />
the government’s pricing scheme for new generating capacity<br />
took full effect. The scheme allows power producers to conclude<br />
ten-year supply contracts for their new capacity at prices<br />
that cover their fixed costs plus a reasonable return on their<br />
investment.<br />
USA<br />
It remains uncertain whether the United States will enact<br />
legislation that takes a long-term approach to climate protection.<br />
On the other hand, federal policies to support renewables<br />
have made the United States a global leader in wind power.<br />
These policies include production tax credits and investment<br />
cash grants. In addition, many states have established programs<br />
that set mandatory targets for renewables in their power<br />
markets, which has resulted in trading in green-power certificates<br />
at a regional level. Currently, Washington is considering<br />
whether to extend tax credits for new wind farms beyond 2012;<br />
support for solar energy is in place through 2016.
Macroeconomic Environment<br />
In <strong>2011</strong>, the global economy did not continue its strong recovery<br />
from the prior year. According to the OECD, global gross<br />
domestic product (“GDP”) grew at a rate of 3.8 percent in real<br />
terms in <strong>2011</strong>, down from 5 percent in 2010. This lower growth<br />
rate, however, roughly matches the average growth rate for the<br />
years 1999 to 2008. Following a recession year (2009) and a<br />
boom year (2010), global trade expanded at a rate of 6.7 percent,<br />
which also marks a return to its long-term average.<br />
The OECD attributes the global economy’s weak growth in <strong>2011</strong><br />
to anti-inflationary (and thus growth-dampening) policies,<br />
lower import demand in emerging countries, and a decline in<br />
confidence in OECD countries. Positive trends in the OECD<br />
zone largely fizzled during the course of the year. Surveys<br />
taken since the summer show that economic confidence has<br />
declined, but not to the levels seen during the crisis of 2008.<br />
Weak growth in the OECD zone in <strong>2011</strong> was propelled by private<br />
consumption and investment activity. Growth in domestic<br />
demand declined by nearly 50 percent <strong>com</strong>pared with the<br />
prior year, and growth in net exports, which had helped drive<br />
economic growth in 2010, fell back to its pre-crisis level prior<br />
to 2007.<br />
Economic recovery in the United States slowed significantly.<br />
Because of high unemployment and restrictive fiscal policies,<br />
domestic demand grew at a lower rate despite robust demand<br />
for consumption and investment goods. Growth in U.S. net<br />
exports, which also returned to its normal rate after the boom<br />
of 2010, was not sufficient to offset the decline in domestic<br />
demand.<br />
The economic performance in the euro zone was also tepid<br />
in <strong>2011</strong>. Private investment activity provided some impetus,<br />
but the increase in private consumption was generally weak,<br />
and there was no increase in public consumption due to<br />
restrictive fiscal policies. Little growth impetus came from net<br />
exports. Southern European countries (Greece, Italy, Portugal,<br />
Spain) recorded the lowest growth rates. Buoyed by robust<br />
domestic demand, Sweden’s GDP growth was among the highest<br />
in the EU. The United Kingdom experienced lower domestic<br />
demand despite fiscal policies designed to stimulate it. Its<br />
economy expanded only incrementally thanks to net exports.<br />
CEO Letter<br />
E.ON Stock<br />
Combined Group Management <strong>Report</strong><br />
Consolidated Financial Statements<br />
Corporate Governance <strong>Report</strong><br />
Supervisory Board and Board of Management<br />
Tables and Explanations<br />
Germany was one of the few countries to have a high rate of<br />
economic growth in <strong>2011</strong>. Fueled by net exports and, <strong>com</strong>pared<br />
with recent years, by un<strong>com</strong>monly robust private consumption<br />
demand, Germany’s economy continued its solid recovery<br />
from the recession of 2009 and, almost without interruption,<br />
its upward trend of 2010.<br />
The BRIC countries (Brazil, Russia, India, China) continue to<br />
offer growth potential. Higher oil prices helped stabilize<br />
Russia’s economy, but GDP growth in China was lower due to<br />
restrictive monetary policy.<br />
<strong>2011</strong> GDP Growth in Real Terms<br />
<strong>Annual</strong> change in percent<br />
Germany<br />
France<br />
Italy<br />
Spain<br />
Euro zone<br />
Sweden<br />
United<br />
Kingdom<br />
OECD<br />
USA<br />
Russian<br />
Federation<br />
0.7<br />
0.7<br />
0.9<br />
0 1.0 2.0 3.0 4.0 5.0<br />
Source: OECD, <strong>2011</strong>.<br />
1.6<br />
1.6<br />
1.7<br />
1.9<br />
3.0<br />
4.1<br />
4.0<br />
15
16 Corporate Profile and Operating Environment<br />
Energy Industry<br />
According to preliminary figures from AGEB, an energy industry<br />
working group, Germany’s consumption of primary energy<br />
in <strong>2011</strong> declined by just under 5 percent to about 457.6 million<br />
metric tons of hard coal equivalent (“MTCE”). The biggest<br />
factor was mild weather in <strong>2011</strong>, which significantly reduced<br />
the need for energy for heating. Higher energy prices constituted<br />
another important factor. Adjusted for temperature<br />
effects, Germany consumed just 1 percent less energy.<br />
Germany’s petroleum consumption fell by 3 percent to the<br />
lowest level since 1990. Gas consumption declined by more<br />
than 10 percent because of significantly warmer weather<br />
<strong>com</strong>pared with the cold prior year and because less gas was<br />
used to fuel power and heat plants. Consumption of hard coal<br />
was slightly lower year on year, with the steel industry using<br />
4 percent more, but the power industry using 2 percent less.<br />
Lignite consumption rose by just under 4 percent. Lignite<br />
production reflects the increase in deliveries to power stations,<br />
which consume 90 percent of Germany’s lignite. Nuclear<br />
power’s contribution declined by just under 23 percent due<br />
to the phaseout decision. Renewables’ share of primary<br />
energy consumption increased by just over 4 percent. Wind<br />
generation was up by 22 percent, whereas hydroelectric<br />
generation (excluding pumped storage) declined by 9 percent.<br />
Photovoltaic production recorded a sharp increase (67 percent).<br />
For the year as a whole, Germany exported slightly more<br />
power to neighboring countries than it imported. However,<br />
this masks a trend towards significantly higher power imports<br />
and lower power exports.<br />
<strong>2011</strong> Primary Energy Consumption<br />
in Germany by Energy Source<br />
Percentages <strong>2011</strong> 2010<br />
Petroleum 33.8 33.4<br />
Natural gas 20.6 21.8<br />
Hard coal 12.6 12.0<br />
Lignite 11.7 10.7<br />
Nuclear 8.8 10.9<br />
Renewables 10.8 9.9<br />
Other (including net power imports/exports) 1.7 1.3<br />
Total 100.0 100.0<br />
Source: AG Energiebilanzen.<br />
The decrease in Germany’s energy consumption led to a more<br />
than 3-percent reduction in its energy-related carbon emissions.<br />
Adjusted for temperature effects, carbon emissions would<br />
have risen by about 1 percent.<br />
Electricity consumption in England, Scotland, and Wales was<br />
about 307 billion kWh in <strong>2011</strong> <strong>com</strong>pared with 320 billion kWh<br />
in 2010. Gas consumption (excluding power stations) fell from<br />
647 billion kWh to 544 billion kWh. Exceptionally cold weather<br />
in the first and third quarters of 2010 along with warm temperatures<br />
in <strong>2011</strong> were the main factors in the decline.<br />
The Nordic region consumed 379 billion kWh of electricity in<br />
<strong>2011</strong>, about 15 billion kWh less than in 2010 due to overall higher<br />
temperatures and lower industrial demand. Net electricity<br />
imports from surrounding countries were around 5.3 billion kWh<br />
in <strong>2011</strong> <strong>com</strong>pared with roughly 18.7 billion kWh in 2010.<br />
Hungary consumed 32.1 billion kWh of electricity, 1.3 percent<br />
more than in the prior year. The different number of work<br />
days and higher industrial demand were the main reasons<br />
for the increase. Driven by weather factors, Hungary’s gas<br />
consumption fell by 7.4 percent to 11.9 billion cubic meters.<br />
Italy consumed 332.3 billion kWh of electricity, an increase of<br />
0.6 percent from the prior-year figure (330.5 billion kWh). Gas<br />
consumption declined by 6 percent to 822 billion kWh (prior<br />
year: 874.8 billion kWh) due to weather factors.<br />
Peninsular electricity consumption in Spain was 255 billion kWh,<br />
2.1 percent below the prior-year figure (consumption declined<br />
by 1.2 percent if adjusted for differences in temperature and the<br />
number of working days). Retail gas consumption decreased<br />
slightly, declining by 0.8 percent to 263 billion kWh.<br />
France’s electricity consumption fell by 5 percent to 350.1 billion<br />
kWh (consumption fell by 0.5 percent if adjusted for<br />
differences in temperature and the number of working days).<br />
By contrast, total generation increased by 0.3 percent to<br />
400.3 billion kWh.<br />
Energy consumption in the Russian Federation increased by<br />
1.2 percent relative to the prior year. Consumption was lower<br />
in Siberia due to higher temperatures and higher in the European<br />
part of Russia due to economic growth.
Energy Prices<br />
Four main factors drove electricity and natural gas markets<br />
in Europe and the electricity market in Russia in <strong>2011</strong>:<br />
• international <strong>com</strong>modity prices (especially oil, gas, coal,<br />
and carbon-allowance prices)<br />
• macroeconomic and political developments<br />
• weather and natural disasters<br />
• the availability of hydroelectricity in Scandinavia.<br />
In the first half of the year, energy markets were driven largely<br />
by the unrest in North Africa and the Middle East and by the<br />
earthquake and tsunami in Japan. In the second half, Europe’s<br />
debt crisis and worse prospects for global economic growth<br />
became increasingly tangible factors, in part because initiatives<br />
by European governments to <strong>com</strong>bat the crisis remained<br />
largely ineffectual and because the United States’ fundamental<br />
budget and trade-balance problems remained unsolved.<br />
Wholesale Electricity Price Movements<br />
in E.ON’s Core Markets<br />
U.K. baseload Nord Pool baseload<br />
€/MWh1 Spain EEX baseload<br />
60<br />
50<br />
40<br />
30<br />
20<br />
10<br />
1/1/10 4/1/10 7/1/10 10/1/10 1/1/11 4/1/11 7/1/11 10/1/11<br />
1For next-year delivery.<br />
After starting the year at well under $100 per barrel, oil prices<br />
at times exceeded $125 in the second quarter due to the<br />
unrest in North Africa. In the third quarter, oil prices began a<br />
steady decline, albeit with intermittent sharp fluctuations,<br />
amid uncertainty on equity and <strong>com</strong>modity markets. Prices<br />
briefly dipped below $100 in the fourth quarter and finished<br />
the year at about $106 per barrel.<br />
CEO Letter<br />
E.ON Stock<br />
Combined Group Management <strong>Report</strong><br />
Consolidated Financial Statements<br />
Corporate Governance <strong>Report</strong><br />
Supervisory Board and Board of Management<br />
Tables and Explanations<br />
Prices on Europe’s coal market (as measured by the API#2<br />
index) began the year with a dramatic rise and in early April<br />
reached a high of $134 per metric ton for next-year delivery.<br />
After this, prices trended continually lower and finished <strong>2011</strong><br />
at $113 per metric ton, which was actually slightly below the<br />
level at the start of the year. The main reasons for the decline<br />
were lower oil prices and lower demand due to the uncertain<br />
economic outlook. By contrast, global demand for coal for<br />
power generation was robust, increasing by an estimated 5 to<br />
6 percent <strong>com</strong>pared with the prior-year figure. Largely responsible<br />
for the increase was India, whose coal consumption<br />
rose by nearly 40 percent year on year. The freight market benefited<br />
somewhat from China’s increased demand for iron ore<br />
but otherwise remained weak because of ongoing oversupply.<br />
After recovering strongly in the first quarter and remaining<br />
largely stable in the second, European forward gas prices<br />
declined sharply in the second half of the year, particularly in<br />
the fourth quarter. The main factors were Europe’s extremely<br />
mild weather and higher-than-anticipated availability of gas,<br />
particularly from Norway but also on the LNG market. The<br />
Asian LNG market, on the other hand, remained tight, chiefly<br />
because of the situation in Japan, where most nuclear power<br />
stations remain out of service. The market’s sensitivity to the<br />
availability of LNG in Asia became apparent in August, when<br />
Qatar’s announcement that it would withdraw several liquefaction<br />
plants from service for scheduled maintenance briefly<br />
sent prices sharply higher. On the U.K. market, gas prices for<br />
next-year delivery finished the year at about €23 per MWh.<br />
After rising significantly in March, the December carbon<br />
contract for next-year delivery of EU allowances under the<br />
European Emissions Trading Scheme came under considerable<br />
pressure throughout the rest of <strong>2011</strong>, finishing the year<br />
at about €7 per metric ton. Europe’s debt crisis and worse<br />
prospects for global economic growth led to lower industrial<br />
production and consequently to lower demand for power,<br />
which resulted in an oversupply of allowances. This trend was<br />
enhanced by the announcement of emission-reduction measures,<br />
including measures to increase energy efficiency.<br />
17
18 Corporate Profile and Operating Environment<br />
Carbon Allowance Price Movements<br />
in Europe<br />
€/metric ton Phase-two allowance<br />
20<br />
15<br />
10<br />
5<br />
1/1/10 4/1/10 7/1/10 10/1/10 1/1/11 4/1/11 7/1/11 10/1/11<br />
After spiking in the first quarter because of the Japan crisis<br />
and Germany’s subsequent nuclear-energy moratorium and<br />
trending downward in the second quarter because of declining<br />
carbon prices, German prices for baseload electricity for<br />
2012 delivery were relatively stable in the third quarter. In the<br />
fourth quarter, prices moved lower due to the good supply<br />
situation on Europe’s energy markets, high renewables output<br />
in Germany, and <strong>com</strong>paratively mild weather. As a result,<br />
German power prices for 2012 delivery finished the year at<br />
about €52 per MWh, roughly where they had started it. U.K.<br />
power prices generally moved in a similar pattern to Germany’s,<br />
although the extremely mild weather at the end of the year<br />
had a significantly greater impact, resulting in prices under €55<br />
per MWh. In the fourth quarter, power prices in the Nordic<br />
market continued to be strongly influenced by the situation in<br />
the region’s water reservoirs. After extremely low reservoir<br />
levels in the first quarter, abundant precipitation and the resulting<br />
increase in inflows led to record-high reservoir levels,<br />
causing temporary sharp declines in spot prices, which also<br />
affected forward prices. Prices for delivery in 2012 finished<br />
Crude Oil and Natural Gas Price Movements in E.ON‘s Core Markets<br />
Average<br />
monthly prices<br />
€/<br />
MWh<br />
40<br />
30<br />
20<br />
10<br />
the year at about €38 per MWh, €12 below the price at the<br />
start of the year. Because Italy’s power market is highly<br />
dependent on oil-indexed natural gas, Italian power prices<br />
for next-year delivery tended to track the fluctuations in oil<br />
prices and generally stayed between €72 and €75 per MWh.<br />
Prices reached a high of over €77 per MWh at the end of<br />
the year due to the fact that Italy is less dependent on coal,<br />
which means that lower carbon prices had less of an impact<br />
on power prices there than in other European countries.<br />
Forward power prices in Spain trended upward, reaching a high<br />
of just under €55 per MWh in September, which also saw<br />
the highest spot prices of 2012. Driven by lower demand and<br />
lower carbon prices, prices declined at the end of the year to<br />
€52, about €2 above the level at the start of the year.<br />
Prices on the Russian market rose significantly in the first<br />
half of the year on higher fuel prices and increased demand<br />
in the European price zone. This trend reversed itself in the<br />
second half on lower demand and a marked increase in generating<br />
capacity. In the European price zone, the weightedaverage<br />
spot price fell by 7 percent in the second half of the<br />
year to RUB 912 (around €22) per MWh, although this was<br />
still 12 percent higher than the price at the end of 2010. In the<br />
Siberian zone, the spot price remained generally stable<br />
(in part because lower demand was offset by a maintenancerelated<br />
reduction in plant availability) and finished the year<br />
at RUB 541 (around €13) per MWh, which was slightly more<br />
than 10 percent above the price at the start of the year.<br />
Brent crude oil front month $/bbl German gas import price €/MWh NCG front month gas (EEX) €/MWh<br />
NBP front month gas €/MWh TTF front month gas €/MWh<br />
1/1/10 4/1/10 7/1/10 10/1/10 1/1/11 4/1/11 7/1/11 10/1/11<br />
$/<br />
bbl<br />
120<br />
100<br />
80<br />
60
Attributable Generating Capacity<br />
The E.ON Group’s attributable generating capacity increased<br />
by 2 percent, from 68,475 MW at year-end 2010 to 69,557 MW<br />
at year-end <strong>2011</strong>.<br />
Attributable generating capacity at the Generation global unit<br />
declined by about 800 MW to 46,846 MW, mainly because of<br />
the shutdown of nuclear capacity (Unterweser, Isar 1, Krümmel,<br />
Brunsbüttel) due to the amendment of Germany’s Nuclear<br />
Energy Act. This effect was partially offset by the <strong>com</strong>missioning<br />
of new gas-fired generating capacity.<br />
Renewables’ attributable generating capacity increased by<br />
about 600 MW, predominantly because of new wind farms in<br />
the United States.<br />
CEO Letter<br />
E.ON Stock<br />
Combined Group Management <strong>Report</strong><br />
Consolidated Financial Statements<br />
Corporate Governance <strong>Report</strong><br />
Supervisory Board and Board of Management<br />
Tables and Explanations<br />
The Germany regional unit’s attributable generating capacity<br />
remained relatively stable at 1,876 MW.<br />
Other EU Countries’ attributable generating capacity of 1,942 MW<br />
was also at the prior-year level.<br />
Russia’s attributable generation capacity increased by about<br />
1,200 MW, owing mainly to the <strong>com</strong>missioning of new gas-fired<br />
units at Surgutskaya and Yaivinskaya power stations.<br />
Attributable Generating Capacity<br />
December 31, <strong>2011</strong>, MW Generation Renewables Germany<br />
Other EU<br />
Countries Russia E.ON Group<br />
Nuclear 5,403 – – – – 5,403<br />
Lignite 852 – – – – 852<br />
Hard coal 6,016 – – – – 6,016<br />
Natural gas 3,863 – 736 – – 4,599<br />
Oil 772 – 106 – – 878<br />
Hydro – 1,759 678 – – 2,437<br />
Wind – 198 – – – 198<br />
Other 24 – 356 – – 380<br />
Germany 16,930 1,957 1,876 – – 20,763<br />
Nuclear 2,774 – – – – 2,774<br />
Lignite – – – 79 1,528 1,607<br />
Hard coal 10,765 – – – – 10,765<br />
Natural gas 13,239 – – 1,541 8,416 23,196<br />
Oil 3,138 – – – – 3,138<br />
Hydro – 3,024 – 55 – 3,079<br />
Wind – 3,836 – 1 – 3,837<br />
Other – 132 – 266 – 398<br />
Outside Germany 29,916 6,992 – 1,942 9,944 48,794<br />
E.ON Group 46,846 8,949 1,876 1,942 9,944 69,557<br />
19
20 Corporate Profile and Operating Environment<br />
Power Procurement<br />
The E.ON Group’s owned generation declined by 2 percent, from<br />
276.1 billion kWh in 2010 to 271.2 billion kWh in <strong>2011</strong>. By contrast,<br />
power procured increased by 15 percent to 894.3 billion kWh.<br />
The reduction in Generation’s owned generation is primarily<br />
attributable to the shutdown of Unterweser and Isar 1 nuclear<br />
power stations in Germany after the expiration of the moratorium<br />
period set by the German federal government. The<br />
decline was also due to narrower margins in the United Kingdom,<br />
which made some plant less economic to operate.<br />
Renewables’ owned generation of 24 billion kWh exceeded<br />
the prior-year figure (22.2 billion kWh). Owned generation in<br />
the Hydro reporting unit declined by 0.5 billion kWh due to<br />
lower water levels in nearly all countries, particularly in Germany,<br />
which saw considerably less precipitation than in the prior<br />
year. By contrast, owned generation in Sweden rose due to high<br />
inflows. Owned generation at the Wind/Solar/Other reporting<br />
unit rose by 29 percent to 10.2 billion kWh. Wind farms<br />
accounted for 96 percent of Renewables’ owned generation,<br />
with biomass and micro-hydro facilities accounting for the rest.<br />
Owned generation at the Germany regional unit’s distributed<br />
generating facilities was 6.6 billion kWh, slightly below the<br />
prior-year level. Lower flowthrough was responsible for the<br />
decline in hydro output, warm weather (and the resulting<br />
reduction in the use of cogeneration units) for the decline in<br />
output from natural-gas and oil assets.<br />
Other EU Countries’ owned generation declined by 0.8 billion<br />
kWh, mainly because narrower margins in the United Kingdom<br />
made some gas-fired units less economic to operate.<br />
Owned generation declined in Sweden and the Netherlands<br />
due to less demand from our Trading unit. The <strong>2011</strong> and 2010<br />
figures for this segment include CHP output in the United<br />
Kingdom.<br />
Power Procurement<br />
Generation Renewables Trading Germany<br />
Other EU<br />
Countries Russia Consolidation E.ON Group<br />
Billion kWh <strong>2011</strong> 2010 <strong>2011</strong> 2010 <strong>2011</strong> 2010 <strong>2011</strong> 2010 <strong>2011</strong> 2010 <strong>2011</strong> 2010 <strong>2011</strong> 2010 <strong>2011</strong> 2010<br />
Owned generation 170.8 182.9 24.0 22.2 – – 6.6 7.1 7.3 8.1 62.5 55.8 – – 271.2 276.1<br />
Purchases<br />
Jointly owned<br />
30.3 50.2 6.2 6.3 982.2 804.9 180.4 190.4 159.8 156.7 4.3 5.3 -468.9 -437.7 894.3 776.1<br />
power plants<br />
Trading/out-<br />
9.9 12.0 1.9 1.8 – – 0.2 0.1 – – – – – -0.9 12.0 13.0<br />
side sources 20.4 38.2 4.3 4.5 982.2 804.9 180.2 190.3 159.8 156.7 4.3 5.3 -468.9 -436.8 882.3 763.1<br />
Total 201.1 233.1 30.2 28.5 982.2 804.9 187.0 197.5 167.1 164.8 66.8 61.1 -468.9 -437.7 1,165.5 1,052.2<br />
Station use,<br />
line loss, etc. -2.3 -2.6 -0.5 -0.7 – – -5.7 -6.2 -10.2 -9.9 -2.0 -1.8 – – -20.7 -21.2<br />
Power sales 198.8 230.5 29.7 27.8 982.2 804.9 181.3 191.3 156.9 154.9 64.8 59.3 -468.9 -437.7 1,144.8 1,031.0
The Russia unit generated about 94 percent of its total needs of<br />
66.8 billion kWh at its own power stations. When it made business<br />
sense, Russia met its delivery obligations by purchasing<br />
electricity instead of producing it.<br />
Gas Procurement<br />
E.ON Ruhrgas procured 660.5 billion kWh of natural gas from<br />
producers in and outside Germany in <strong>2011</strong>, about 4 percent<br />
less than in the prior year. The biggest suppliers were Russia<br />
(which accounted for 27 percent), Norway (23 percent), Germany<br />
(22 percent), and the Netherlands (18 percent). E.ON<br />
Földgáz Trade of Hungary, whose biggest supplier is Russia,<br />
accounted for the Gas global unit’s remaining procurement<br />
(roughly 79 billion kWh).<br />
In addition, the Trading unit procured 1,192 billion kWh of gas,<br />
primarily at gas trading hubs.<br />
The Gas global unit’s gas production in the North Sea declined<br />
to 1,175 million cubic meters. Oil and condensates production<br />
of 3.6 million barrels was also down, declining by 31 percent<br />
from the prior-year figure. The main factors were temporary<br />
production stoppages due to technical issues at Njord and Rita<br />
fields and natural production declines at older fields. Together,<br />
these factors caused total upstream production of gas, liquids,<br />
and condensates to fall by 26 percent to 11 million barrels of<br />
oil equivalent. In addition to our North Sea production, we had<br />
6.4 billion cubic meters of production from Yuzhno Russkoye,<br />
which was acquired at the end of 2009 and is accounted for<br />
using the equity method. This represents a slight increase<br />
from the prior-year figure.<br />
Trading Volume<br />
CEO Letter<br />
E.ON Stock<br />
Combined Group Management <strong>Report</strong><br />
Consolidated Financial Statements<br />
Corporate Governance <strong>Report</strong><br />
Supervisory Board and Board of Management<br />
Tables and Explanations<br />
Owned Generation by Energy Source<br />
Generation Renewables Germany<br />
Other EU<br />
Countries Russia E.ON Group<br />
Billion kWh<br />
<strong>2011</strong> % <strong>2011</strong> % <strong>2011</strong> % <strong>2011</strong> % <strong>2011</strong> % <strong>2011</strong> %<br />
Nuclear 60.9 36 – – – – – – – – 60.9 22<br />
Lignite 4.8 3 – – – – 0.3 4 11.1 18 16.2 6<br />
Hard coal 62.0 36 – – – – – – – – 62.0 23<br />
Natural gas, oil 43.1 25 – – 2.0 30 6.0 82 51.4 82 102.5 38<br />
Hydro – – 13.9 58 2.3 35 0.1 1 – – 16.3 6<br />
Wind – – 9.8 41 – – – – – – 9.8 4<br />
Other – – 0.3 1 2.3 35 0.9 13 – – 3.5 1<br />
Total 170.8 100 24.0 100 6.6 100 7.3 100 62.5 100 271.2 100<br />
Upstream Production<br />
<strong>2011</strong> 2010 +/- %<br />
Oil/condensates (million barrels) 3.6 5.2 -31<br />
Gas (million standard cubic meters) 1,175 1,513 -22<br />
Total (million barrels of oil equivalent) 11.0 14.8 -26<br />
To execute its procurement and sales mission for the E.ON Group<br />
and to optimize the E.ON asset portfolio, the Trading global<br />
unit traded the following financial and physical quantities:<br />
Trading Volume<br />
<strong>2011</strong> 2010<br />
Power (billion kWh) 1,967 1,472<br />
Gas (billion kWh) 2,480 2,005<br />
Carbon allowances (million metric tons) 598 650<br />
Oil (million metric tons) 92 72<br />
Coal (million metric tons) 269 289<br />
The table above shows our entire trading volume, including<br />
volume for delivery in future periods.<br />
21
22 Corporate Profile and Operating Environment<br />
Power Sales<br />
On a consolidated basis, the E.ON Group increased its power<br />
sales by 11 percent year on year to 1,144.8 billion kWh due to<br />
higher trading sales volume, primarily deliveries to France<br />
and Italy.<br />
Generation sold 31.7 billion kWh less power than in the prior<br />
year. Power sales declined by 11.6 billion kWh in Germany,<br />
where the shutdown of Unterweser and Isar 1 nuclear power<br />
stations reduced deliveries to the Trading unit. Generation<br />
sold 8.4 billion kWh less power in Italy and 8.3 billion kWh less<br />
in France due to lower demand from Trading. Power sales<br />
declined by 3.1 billion kWh in the United Kingdom because<br />
narrower margins made some plant less economic to operate.<br />
Renewables sold 1.9 billion kWh more power than last year.<br />
Power sales at the Hydro reporting unit declined by an aggregate<br />
0.3 billion kWh on lower output in all regions except<br />
Sweden, where power sales were higher due to higher water<br />
levels. Wind/Solar/Other, which sells its output exclusively in<br />
markets with incentive mechanisms for renewables, grew<br />
power sales by 2.2 billion kWh, or 24 percent, primarily because<br />
of an increase in generating capacity.<br />
The decline in power sales at the Germany regional unit primarily<br />
reflects the sale of our ultrahigh-voltage transmission<br />
system (transpower) in late February 2010. A decline in customer<br />
numbers was also an adverse factor.<br />
Other EU Countries sold 2 billion kWh more power. Gains of<br />
8.9 billion kWh (primarily in France and the United Kingdom,<br />
including output from CHP plants for <strong>2011</strong> and 2010) more than<br />
offset declines of 6.9 billion kWh (primarily in Italy, Sweden,<br />
and Czechia).<br />
The Russia unit sold 64.8 billion kWh of electricity on the<br />
wholesale market. This 9-percent increase is attributable in<br />
particular to the <strong>com</strong>missioning of new generating capacity.<br />
Power Sales<br />
Generation Renewables Trading Germany<br />
Other EU<br />
Countries Russia Consolidation E.ON Group<br />
Billion kWh<br />
Residential and<br />
<strong>2011</strong> 2010 <strong>2011</strong> 2010 <strong>2011</strong> 2010 <strong>2011</strong> 2010 <strong>2011</strong> 2010 <strong>2011</strong> 2010 <strong>2011</strong> 2010 <strong>2011</strong> 2010<br />
SME – – – – – – 25.0 27.2 64.3 63.5 – – – – 89.3 90.7<br />
I&C 3.9 4.0 – 2.1 – – 37.2 28.6 73.4 73.7 – – -0.2 -0.2 114.3 108.2<br />
Sales partners<br />
Customer<br />
26.7 36.4 4.7 2.9 – – 82.9 85.9 1.7 3.3 – – -4.9 -9.0 111.1 119.5<br />
segments 30.6 40.4 4.7 5.0 – – 145.1 141.7 139.4 140.5 – – -5.1 -9.2 314.7 318.4<br />
Wholesale market/<br />
Trading 168.2 190.1 25.0 22.8 982.2 804.9 36.2 49.6 17.5 14.4 64.8 59.3 -463.8 -428.5 830.1 712.6<br />
Total 198.8 230.5 29.7 27.8 982.2 804.9 181.3 191.3 156.9 154.9 64.8 59.3 -468.9 -437.7 1,144.8 1,031.0
Gas Sales<br />
On a consolidated basis, the E.ON Group increased its gas<br />
sales by 375.7 billion kWh, or 28 percent, to 1,718.1 billion kWh.<br />
Higher trading sales volume, resulting in particular from<br />
increased hedging activities on European energy exchanges,<br />
was the main factor.<br />
Our Gas global unit is responsible for procuring gas for our<br />
regional sales entities and the Trading unit and for marketing<br />
gas in regions in which our sales and trading entities do<br />
not operate. This is reflected in Gas’s sales volume, which is<br />
adjusted for intrasegment effects and consists of the gas<br />
sales of E.ON Ruhrgas, Ferngas Nordbayern, and E.ON Földgáz<br />
Trade. Gas sold a total of 731 billion kWh of gas, a reduction<br />
of about 48 billion kWh, or roughly 6 percent, relative to 2010.<br />
Broken down by customer segment, Gas made 2 percent of<br />
its gas sales to I&C, 12 percent to sales partners, 54 percent to<br />
the Germany regional unit, 16 percent outside Germany, and<br />
16 percent to Trading. The sales partner segment consists<br />
mainly of E.ON sales entities and regional gas <strong>com</strong>panies and<br />
municipal utilities supplied directly by Gas. The 54 billion kWh<br />
decline in sales to this segment primarily reflects customer<br />
CEO Letter<br />
E.ON Stock<br />
Combined Group Management <strong>Report</strong><br />
Consolidated Financial Statements<br />
Corporate Governance <strong>Report</strong><br />
Supervisory Board and Board of Management<br />
Tables and Explanations<br />
losses by E.ON sales entities and warmer weather <strong>com</strong>pared<br />
with the prior year. Gas sales to the Germany regional unit were<br />
about 16 billion kWh lower, also mainly because of customer<br />
losses and warmer weather. Gas sales outside Germany, which<br />
declined by about 8 billion kWh, consist mainly of the sales<br />
volume of E.ON Földgáz Trade, which sold about 85 billion kWh<br />
of gas. Gas sales to Trading rose by about 21 billion kWh year<br />
on year because of an increase in spot trading, which resulted<br />
mainly from increased trading in LNG cargos and an increase<br />
in short-term trading.<br />
The Germany regional unit sold about 36 billion kWh less gas,<br />
mainly because of customer losses and weather effects.<br />
Gas sales volume at Other EU Countries was down by 10.5 billion<br />
kWh. The main drivers were very cold weather in the prior<br />
year in the United Kingdom and Italy, ongoing energy-efficiency<br />
measures in the United Kingdom, increased customer churning<br />
in Italy, and a reduction in deliveries to gas-fired power plants<br />
in Sweden. Gas sales volume was higher in other markets,<br />
particularly in the Netherlands and Czechia, on higher sales<br />
to Trading and the acquisition of new wholesale customers.<br />
Gas Sales<br />
Gas Generation Trading Germany<br />
Other EU<br />
Countries Consolidation E.ON Group<br />
Billion kWh<br />
Residential and<br />
<strong>2011</strong> 2010 <strong>2011</strong> 2010 <strong>2011</strong> 2010 <strong>2011</strong> 2010 <strong>2011</strong> 2010 <strong>2011</strong> 2010 <strong>2011</strong> 2010<br />
SME – – – – – – 25.4 32.0 97.7 103.7 – – 123.1 135.7<br />
I&C 16.5 7.2 – – – – 132.9 133.0 44.9 53.3 -11.4 -9.9 182.9 183.6<br />
Sales partners<br />
Customer<br />
89.1 143.0 – – – – 263.4 292.4 0.8 1.2 -94.8 -106.4 258.5 330.2<br />
segments 105.6 150.2 – – – – 421.7 457.4 143.4 158.2 -106.2 -116.3 564.5 649.5<br />
Germany 394.4 410.7 – – – – – – – – -394.4 -410.7 – –<br />
Other countries<br />
Wholesale market/<br />
116.0 124.2 – – – – – – – – -43.3 -51.1 72.7 73.1<br />
Trading 114.5 93.2 0.2 2.8 1,433.2 836.6 43.6 43.8 14.4 10.1 -525.0 -366.7 1,080.9 619.8<br />
Total 730.5 778.3 0.2 2.8 1,433.2 836.6 465.3 501.2 157.8 168.3 -1,068.9 -944.8 1,718.1 1,342.4<br />
23
24 Earnings Situation<br />
Business Performance<br />
At the end of the <strong>2011</strong> financial year, the E.ON Group’s business<br />
performance was in line with our expectations. Sales rose by<br />
22 percent year on year to roughly €113 billion. But our EBITDA<br />
declined by 30 percent to roughly €9.3 billion. The adverse<br />
factors include the early shutdown of a number of nuclear<br />
power stations in Germany, Germany’s nuclear-fuel tax, and<br />
continued margin pressure in our gas wholesale business. By<br />
contrast, a number of our growth businesses—renewables,<br />
upstream gas, and power generation in Russia—increased their<br />
earnings. These results are in line with our adjusted forecast<br />
for <strong>2011</strong>. Our EBITDA was between €9.1 and €9.3 billion and our<br />
underlying net in<strong>com</strong>e was between €2.3 and €2.5 billion.<br />
We adjusted our forecast at the time of our half-year earnings<br />
release because—in addition to the adverse impact of the<br />
shutdown of several of our nuclear power stations and the<br />
nuclear-fuel tax—the economic environment remained difficult<br />
in most of the European markets where we operate.<br />
Furthermore, it was nearly impossible to quantify the risks<br />
of international economic and financial developments.<br />
We executed the following significant transactions in <strong>2011</strong>.<br />
Acquisitions, Disposals, and Discontinued Operations<br />
in <strong>2011</strong><br />
Note 4 to the Consolidated Financial Statements contains<br />
detailed information about these transactions.<br />
Disposal Groups and Assets Held for Sale<br />
In line with our strategy, which includes divesting €15 billion<br />
of assets by the end of 2013, we sold our U.K. power distribution<br />
system to PPL Corporation of the United States effective<br />
April 1, <strong>2011</strong>.<br />
In mid-December 2010, contractual agreements were concluded<br />
to sell 100 percent of the shares of E.ON Rete, which<br />
operates a gas distribution network in Italy, to a consortium.<br />
We reclassified these operations as a disposal group effective<br />
December 31, 2010. The transaction closed in early April <strong>2011</strong>.<br />
After the disposal of the Thüga Group, our stakes in Stadtwerke<br />
Karlsruhe and Stadtwerke Duisburg were reclassified as<br />
assets held for sale effective December 31, 2010. The transactions<br />
closed in early <strong>2011</strong> and in July <strong>2011</strong>, respectively.<br />
Furthermore, in the third quarter of 2010 a concrete stage<br />
was reached in the negotiations to sell our 40-percent stake<br />
in HEAG Südhessische Energie AG. The sales agreement<br />
for the disposal of this stake was signed in February 2012. The<br />
closing of the transaction, which is subject to approval by<br />
various municipal entities of the city of Darmstadt and by the<br />
Supervisory Board of E.ON Ruhrgas AG, is expected to take<br />
place in the first half of 2012.<br />
In a portfolio-streamlining measure, E.ON sold most of its<br />
stake in Gazprom. The remaining stake was reclassified as an<br />
asset held for sale. It was sold in the first quarter of <strong>2011</strong>.<br />
In December <strong>2011</strong>, E.ON signed a contract to sell its wholly<br />
owned subsidiary E.ON Bulgaria to Energo-Pro of the Czech<br />
Republic.<br />
These disposals resulted in cash-effective items totaling<br />
€5,987 million in <strong>2011</strong> (prior year: €9,601 million).
Sales<br />
Our sales rose by 22 percent year on year to €113 billion. All<br />
our reporting segments recorded higher sales and generally<br />
had a higher share of external sales, particularly Trading.<br />
Sales<br />
€ in millions <strong>2011</strong> 2010 +/- %<br />
Generation 14,979 14,741 +2<br />
Renewables 2,439 1,943 +26<br />
Gas 23,012 21,348 +8<br />
Trading 70,463 47,948 +47<br />
Germany 37,244 36,403 +2<br />
Other EU Countries 23,032 22,654 +2<br />
Russia<br />
Group Management/<br />
1,615 1,252 +29<br />
Consolidation -59,830 -53,426 –<br />
Total 112,954 92,863 +22<br />
Generation<br />
The Generation global unit increased its sales by €238 million<br />
relative to the prior-year figure.<br />
Sales<br />
€ in millions <strong>2011</strong> 2010 +/- %<br />
Nuclear 4,944 5,066 -2<br />
Fossil 9,811 9,639 +2<br />
Other/Consolidation 224 36 +522<br />
Generation 14,979 14,741 +2<br />
The Nuclear reporting unit’s sales declined by €122 million<br />
due to the German federal government’s nuclear-energy moratorium<br />
and the shutdown of Unterweser and Isar 1 nuclear<br />
power stations. By contrast, higher market-based transfer prices<br />
for deliveries to our Trading unit in Germany had a positive<br />
impact on sales. Generally, our internal transfer prices are<br />
derived from the forward prices that are current in the<br />
marketplace three years prior to delivery. The resulting transfer<br />
CEO Letter<br />
E.ON Stock<br />
Combined Group Management <strong>Report</strong><br />
Consolidated Financial Statements<br />
Corporate Governance <strong>Report</strong><br />
Supervisory Board and Board of Management<br />
Tables and Explanations<br />
prices, which our Trading unit pays our generating units for<br />
their output, were higher in <strong>2011</strong> than the prices for the 2010<br />
delivery period. In Sweden, Nuclear’s sales were positively<br />
impacted by higher sales volume, higher average transfer prices,<br />
and positive currency-translation effects.<br />
The Fossil reporting unit grew sales by €172 million, mainly<br />
due to higher market-based transfer prices for deliveries to<br />
our Trading unit in Germany, the United Kingdom, and the<br />
Netherlands. The <strong>com</strong>missioning of new gas-fired generating<br />
units in Germany and the United Kingdom was another positive<br />
factor. Sales declined significantly in Italy, mainly due to<br />
lower sales volume.<br />
Renewables<br />
Sales at Renewables rose by €496 million.<br />
Sales<br />
€ in millions <strong>2011</strong> 2010 +/- %<br />
Hydro 1,453 1,277 +14<br />
Wind/Solar/Other 986 666 +48<br />
Renewables 2,439 1,943 +26<br />
The €176 million increase in sales recorded at the Hydro<br />
reporting unit is mainly attributable to higher market-based<br />
transfer prices for deliveries to our Trading unit in Germany<br />
and Sweden. Lower output had a negative impact on sales.<br />
The primary reason for the €320 million increase in Wind/<br />
Solar/Other’s sales was a considerable increase in generating<br />
capacity, particularly in the United Kingdom, Denmark, and<br />
the United States.<br />
25
26 Earnings Situation<br />
Gas<br />
Gas’s sales were up by 8 percent to around €23 billion (prior<br />
year: €21.3 billion).<br />
Sales<br />
€ in millions <strong>2011</strong> 2010 +/- %<br />
Upstream 1,517 1,391 +9<br />
Midstream 21,177 20,001 +6<br />
Transmission/Shareholdings 1,199 1,555 -23<br />
Other/Consolidation -881 -1,599 –<br />
Gas 23,012 21,348 +8<br />
The Upstream reporting unit’s sales were up by €126 million.<br />
Positive energy price developments, particularly for output<br />
from Yuzhno Russkoye gas field in Siberia, more than offset<br />
lower production at North Sea gas fields.<br />
The Midstream reporting unit grew sales by €1.2 billion. Lower<br />
sales volume was more than offset by higher sales prices.<br />
The <strong>com</strong>missioning of new storage capacity led to higher sales<br />
at the storage business.<br />
Lower transport revenues in the regulated business and lower<br />
sales of control and balancing energy resulted in a decrease<br />
in sales at Transmission/Shareholdings.<br />
Trading<br />
Trading recorded sales of about €70.5 billion in <strong>2011</strong>. The<br />
increase relative to the prior year resulted mainly from an<br />
increase in trading activity in power and gas. On the gas<br />
side, optimization of long-term supply contracts and of E.ONowned<br />
gas-fired power plants led to a significant increase<br />
in sales, as did an adjustment of our hedging strategy. On the<br />
power side, sales rose in particular because of the marketing<br />
of additional output from E.ON-owned power plants and from<br />
an increase in trading activities to optimize the value of E.ON’s<br />
generation portfolio. The increase in sales is reflected almost<br />
identically in the increase in cost of materials, since optimization<br />
involves buying quantities and then reselling them. The<br />
Consolidated Statements of In<strong>com</strong>e include Proprietary Trading’s<br />
sales net of the associated cost of materials.<br />
Sales<br />
€ in millions <strong>2011</strong> 2010 +/- %<br />
Proprietary Trading 111 -36 –<br />
Optimization 70,352 47,984 +47<br />
Trading 70,463 47,948 +47<br />
Germany<br />
Sales at the Germany regional unit increased by €0.8 billion.<br />
Sales<br />
€ in millions <strong>2011</strong> 2010 +/- %<br />
Distribution Networks 11,276 10,504 +7<br />
Non-regulated/Other 25,968 25,899 –<br />
Germany 37,244 36,403 +2<br />
The increase is entirely attributable to the Distribution Networks<br />
reporting unit, mainly because it recorded significantly<br />
higher sales in conjunction with Germany’s Renewable Energy<br />
Law. A regulation-driven decline in network charges was the<br />
main negative factor.<br />
Sales at the Non-regulated/Other reporting unit were on par<br />
with the prior-year figure.<br />
Other EU Countries<br />
Other EU Countries grew sales by €378 million.<br />
Sales<br />
€ in millions <strong>2011</strong> 2010 +/- %<br />
UK<br />
8,554 8,732 -2<br />
(£ in millions)<br />
(7,422) (7,579) (-2)<br />
Sweden<br />
2,922 3,235 -10<br />
(SEK in millions)<br />
(26,381) (30,858) (-14)<br />
Czechia<br />
2,765 2,338 +18<br />
(CZK in millions)<br />
(67,991) (59,114) (+15)<br />
Hungary<br />
1,948 2,032 -4<br />
(HUF in millions)<br />
(544,196) (559,800) (-3)<br />
Remaining regional units 6,843 6,317 +8<br />
Other EU Countries 23,032 22,654 +2
Sales at the UK regional unit declined by €178 million. The<br />
decline in sales resulting from the disposal of the regulated<br />
business (Central Networks) was partially offset by higher<br />
sales in the retail business.<br />
The Sweden regional unit’s sales decreased by €313 million,<br />
despite positive currency-translation effects of €155 million.<br />
The decline was mainly due to lower retail sales which reflect<br />
a decline in spot prices from the high level seen in the first<br />
half of 2010.<br />
Sales in Czechia rose by €427 million, primarily because of<br />
higher <strong>com</strong>pensation payments for the preferential dispatch<br />
of renewable-source electricity in the distribution network.<br />
Sales at the Hungary regional unit were slightly below the<br />
prior-year level because of lower sales in the regulated business<br />
and lower sales prices.<br />
Sales at the remaining reporting units rose by €526 million, in<br />
particular because of positive margin and price effects in<br />
France, the Netherlands, Spain, and Romania. The acquisition<br />
of new customers in the Netherlands was another positive<br />
factor. Sales in Italy declined on lower sales volume.<br />
Russia<br />
An increase in generating capacity along with higher power<br />
prices enabled Russia to grow its sales by 29 percent, from<br />
€1,252 million in 2010 to €1,615 million in <strong>2011</strong>. In local currency,<br />
sales were up by 31 percent, from RUB 50,344 million to<br />
RUB 66,039 million.<br />
Other Significant Line Items from the Consolidated<br />
Statements of In<strong>com</strong>e<br />
Own work capitalized of €519 million was 12 percent below<br />
the prior-year level (€588 million) and consisted chiefly of<br />
engineering services performed in our network business in<br />
conjunction with new-build projects.<br />
CEO Letter<br />
E.ON Stock<br />
Combined Group Management <strong>Report</strong><br />
Consolidated Financial Statements<br />
Corporate Governance <strong>Report</strong><br />
Supervisory Board and Board of Management<br />
Tables and Explanations<br />
Other operating in<strong>com</strong>e declined by 14 percent to €13,785 million<br />
(prior year: €15,961 million). Higher in<strong>com</strong>e from exchangerate<br />
differences of €6,027 million (€5,177 million) was more<br />
than offset by significantly lower in<strong>com</strong>e from derivative financial<br />
instruments of €4,559 million (€6,046 million). In derivative<br />
financial instruments, there were significant effects from<br />
<strong>com</strong>modity derivatives in <strong>2011</strong>. These principally affected our<br />
positions in natural gas, oil, and emission allowances. Gains<br />
on the disposal of securities, fixed assets, and shareholdings<br />
amounted to €1,548 million (€3,478 million). In <strong>2011</strong>, these gains<br />
are primarily attributable to the sale of additional Gazprom<br />
stock and our U.K. power distribution network. In the prior year,<br />
they were attributable to the disposal of power capacity and<br />
our ultrahigh-voltage transmission system (transpower) in line<br />
with our <strong>com</strong>mitment to the European Commission and to<br />
the sale of Gazprom stock. Miscellaneous other operating<br />
in<strong>com</strong>e consisted primarily of reductions to valuation allowances<br />
and provisions as well as <strong>com</strong>pensation payments<br />
received for damages.<br />
Costs of materials rose by €24,252 million to €97,827 million<br />
(€73,575 million), primarily due to an increase in trading<br />
volume <strong>com</strong>pared with the prior year, higher costs stemming<br />
from the amendment of Germany’s Nuclear Energy Act which<br />
calls for the early, unplanned shutdown of nuclear power plants<br />
(“NPPs”) in Germany (around €1.5 billion), and higher procurement<br />
costs.<br />
Personnel costs rose by €666 million to €5,947 million<br />
(€5,281 million), chiefly because of restructuring expenditures<br />
in conjunction with the E.ON 2.0 project.<br />
27
28 Earnings Situation<br />
Depreciation charges increased by €624 million to €7,081 million<br />
(€6,457 million). In the fourth quarter of <strong>2011</strong>, we recorded<br />
a total of €3 billion in impairment charges on assets and<br />
goodwill, mainly at generation businesses. Impairment charges<br />
totaling approximately €1.9 billion were necessary in Spain<br />
and Italy due to pessimistic forecasts for the long-term development<br />
of power prices, regulatory intervention, and reduced<br />
utilization of gas-fired and coal-fired power stations. Of these<br />
charges, €1.6 billion related to conventional power generation,<br />
€0.1 billion to renewable-source power generation, and<br />
€0.2 billion to our regional business in Italy. Power output and<br />
generation margins are also lower than anticipated in Hungary<br />
and Slovakia, necessitating impairment charges of €0.3 billion<br />
on power stations and €0.2 billion on our regional business in<br />
Hungary. The remaining impairment charges total €0.6 billion,<br />
of which €0.2 billion related to power stations and €0.2 billion<br />
to our regional business in the Benelux countries. The main<br />
reasons are that some older power stations were closed earlier<br />
than had been planned and that unfavorable market developments<br />
have led to lower earnings from heating plants and<br />
district heating. In addition, the amendment of Germany’s<br />
Nuclear Energy Act, which calls for the early, unplanned shutdown<br />
of NPPs in Germany, made it necessary to record<br />
impairment charges on assets (€219 million). The prior-year<br />
figure primarily reflects impairment charges of €2.6 billion<br />
on goodwill and other assets at operations in Italy, Spain, and<br />
France acquired from Enel/Acciona and Endesa.<br />
Other operating expenses rose by 30 percent, or €4,059 million,<br />
to €17,656 million (€13,597 million). This is mainly attributable<br />
to higher expenditures relating to currency differences of<br />
€6,761 million (€4,936 million), higher expenditures relating to<br />
derivative financial instruments of €5,685 million (€3,559 million),<br />
which primarily affect <strong>com</strong>modity derivates, and losses<br />
on the disposal of shareholdings and securities of €742 million<br />
(€75 million). The latter item mainly reflects negative effects<br />
from the reclassification of currency-translation effects in equity<br />
in the wake of the simplification of E.ON’s organizational setup.<br />
In<strong>com</strong>e from <strong>com</strong>panies accounted for under the equity<br />
method declined to €512 million (€663 million), primarily<br />
due to impairment charges resulting from the amendment<br />
of Germany’s Nuclear Energy Act, which calls for the early,<br />
unplanned shutdown of NPPs in Germany (€105 million).<br />
EBITDA<br />
Effective January 1, <strong>2011</strong>, our key figure for purposes of internal<br />
management control and as an indicator of our units’ long-term<br />
earnings power is earnings before interest, taxes, depreciation,<br />
and amortization (“EBITDA”), which we adjust to exclude certain<br />
extraordinary items, mainly other in<strong>com</strong>e and expenses<br />
of a non-recurring or rare nature. EBITDA is unaffected by<br />
investment and depreciation cycles and also provides an indication<br />
of our cash-effective earnings (see the <strong>com</strong>mentary in<br />
Note 33 to the Consolidated Financial Statements).<br />
Our <strong>2011</strong> EBITDA was about €4.1 billion below the prior-year<br />
figure. The main reasons were:<br />
• the nuclear-energy moratorium in Germany, the amendment<br />
of Germany’s Nuclear Energy Act which calls for<br />
the early, unplanned shutdown of certain nuclear power<br />
stations in Germany, and the nuclear-fuel tax (roughly<br />
-€2.5 billion),<br />
• among other factors, substantial pressure on margins in<br />
our gas business (roughly -€0.7 billion)<br />
• the disposal of our regulated network business in the<br />
United Kingdom (roughly -€0.4 billion).<br />
EBITDA1 € in millions <strong>2011</strong> 2010 +/- %<br />
Generation 2,114 3,757 -44<br />
Renewables 1,459 1,207 +21<br />
Gas 1,533 1,975 -22<br />
Trading -631 1,205 –<br />
Germany 2,421 2,463 -2<br />
Other EU Countries 2,259 2,583 -13<br />
Russia<br />
Group Management/<br />
553 377 +47<br />
Consolidation -415 -221 –<br />
Total 9,293 13,346 -30<br />
1 Adjusted for extraordinary effects.
E.ON generates a significant portion of its EBITDA in very stable<br />
business areas. The overall share of regulated as well as quasiregulated<br />
and long-term contracted business accounted for<br />
50 percent of EBITDA in <strong>2011</strong>.<br />
EBITDA1 € in millions <strong>2011</strong> %<br />
Regulated business<br />
Quasi-regulated and long-term contracted<br />
3,721 40<br />
business 900 10<br />
Merchant business 4,672 50<br />
Total 9,293 100<br />
1 Adjusted for extraordinary effects.<br />
Our regulated business consists of operations in which revenues<br />
are set by law and based on costs plus a reasonable return<br />
on capital employed. These revenues are therefore extremely<br />
stable and predictable.<br />
Our quasi-regulated and long-term contracted business consists<br />
of operations in which the revenues have a high degree of<br />
predictability because key determinants (price and/or volume)<br />
are largely set by law or by individual contractual arrangements<br />
for the medium to long term. Examples of such legal<br />
or contractual arrangements include incentive mechanisms<br />
for renewables and long-term power-purchase agreements<br />
for generating capacity.<br />
Our merchant business consists of all those operations that<br />
cannot be subsumed under either of the other two categories.<br />
Generation<br />
Generation’s EBITDA declined by €1,643 million.<br />
Generation<br />
EBITDA<br />
€ in millions<br />
1 EBIT1 <strong>2011</strong> 2010 <strong>2011</strong> 2010<br />
Nuclear 272 1,996 25 1,735<br />
Fossil 1,792 1,725 1,061 984<br />
Other/Consolidation 50 36 42 48<br />
Total 2,114 3,757 1,128 2,767<br />
1 Adjusted for extraordinary effects.<br />
CEO Letter<br />
E.ON Stock<br />
Combined Group Management <strong>Report</strong><br />
Consolidated Financial Statements<br />
Corporate Governance <strong>Report</strong><br />
Supervisory Board and Board of Management<br />
Tables and Explanations<br />
The Nuclear reporting unit’s EBITDA fell by €1.7 billion. Its<br />
operations in Germany were adversely affected in particular by<br />
the nuclear-energy moratorium, the amendment of Germany’s<br />
Nuclear Energy Act (which called for the early, unplanned<br />
shutdown of Unterweser, Isar 1, Krümmel, and Brunsbüttel<br />
nuclear power stations), and the nuclear-fuel tax. Higher<br />
market-based transfer prices for deliveries to Trading in Germany<br />
constituted a positive factor. Nuclear’s EDITDA in<br />
Germany was €2.1 billion below the prior-year figure. Nuclear’s<br />
EBITDA in Sweden rose by €437 million, primarily because<br />
sales volumes and average transfer prices were higher and<br />
provisions were lower than in the prior year.<br />
EBITDA at the Fossil reporting unit rose by €67 million. Higher<br />
earnings in Germany and the United Kingdom resulted mainly<br />
from higher market-based transfer prices relative to the prior<br />
year and from the <strong>com</strong>missioning of new gas-fired generating<br />
units. Earnings in Italy were lower due to narrower margins.<br />
Earnings in France were adversely affected by negative<br />
market-valuation effects and <strong>com</strong>pensation payments in conjunction<br />
with the transfer of certain operations to Trading.<br />
Renewables<br />
Renewables’ EBITDA increased by €252 million, or 21 percent.<br />
Renewables<br />
EBITDA<br />
€ in millions<br />
1 EBIT1 <strong>2011</strong> 2010 <strong>2011</strong> 2010<br />
Hydro 909 755 793 640<br />
Wind/Solar/Other 550 452 295 240<br />
Total 1,459 1,207 1,088 880<br />
1 Adjusted for extraordinary effects.<br />
The Hydro reporting unit’s EBITDA rose by 20 percent to<br />
€909 million, chiefly because of higher market-based transfer<br />
prices for deliveries to Trading. Earnings were adversely<br />
affected by lower output and by lower optimization effects<br />
due to volatile market prices in Spain.<br />
EBITDA at Wind/Solar/Other was significantly higher, mainly<br />
because of a considerable increase in generating capacity.<br />
29
30 Earnings Situation<br />
Gas<br />
Gas’s EBITDA of €1,533 million was €442 million, or 22 percent,<br />
below the prior-year figure of €1,975 million.<br />
Gas<br />
EBITDA<br />
€ in millions<br />
1 EBIT1 <strong>2011</strong> 2010 <strong>2011</strong> 2010<br />
Upstream 753 710 507 406<br />
Midstream<br />
Transmission/<br />
-79 487 -224 375<br />
Shareholdings 615 696 472 556<br />
Other/Consolidation 244 82 242 78<br />
Total 1,533 1,975 997 1,415<br />
1 Adjusted for extraordinary effects.<br />
Upstream’s EBITDA rose by €43 million, primarily because of<br />
positive price developments.<br />
Midstream’s earnings development reflects the sharp decline<br />
in earnings at the gas wholesale business. The decoupling of<br />
oil and gas prices and the resulting negative gas-oil spread led<br />
to considerable margin pressure. The prices of our purchase<br />
contracts, which are largely based on oil prices, are above the<br />
level of the prices that can be achieved in our gas sales business,<br />
which are based on market prices for gas. Negotiations<br />
with some producers to adjust procurement prices have been<br />
partially successful, but do not yet en<strong>com</strong>pass the entire portfolio<br />
and in <strong>2011</strong> only partly offset the gas wholesale business’s<br />
overall negative results. Equity earnings were lower due to<br />
the sale of our Gazprom stake, on which we had recorded a<br />
dividend in the prior year. Our gas-storage business, which<br />
is also part of the Midstream reporting unit, recorded slightly<br />
higher earnings, primarily because of an increase in capacity.<br />
EBITDA at Transmission/Shareholdings declined on lower<br />
earnings at the transmission business and the absence of<br />
positive non-recurring effects recorded in 2010.<br />
Trading<br />
Trading’s EBITDA was -€631 million. Optimization, whose<br />
main purpose is to limit risks and to optimize the deployment<br />
of the E.ON Group’s generation and production assets, had<br />
earnings of -€675 million, mainly because of higher transfer<br />
prices paid to our generation units’ non-fossil portfolio and<br />
lower achieved prices. Although Proprietary Trading’s performance<br />
was adversely affected by market developments following<br />
the German government’s announcement of a nuclearenergy<br />
moratorium, it recovered steadily during the year.<br />
Trading<br />
EBITDA<br />
€ in millions<br />
1 EBIT1 <strong>2011</strong> 2010 <strong>2011</strong> 2010<br />
Proprietary Trading 44 -105 42 -107<br />
Optimization -675 1,310 -684 1,303<br />
Total -631 1,205 -642 1,196<br />
1 Adjusted for extraordinary effects.<br />
Germany<br />
The Germany regional unit’s EDITDA declined by €42 million.<br />
Germany<br />
EBITDA<br />
€ in millions<br />
1 EBIT1 <strong>2011</strong> 2010 <strong>2011</strong> 2010<br />
Distribution Networks 1,535 1,876 885 1,247<br />
Non-regulated/Other 886 587 585 294<br />
Total 2,421 2,463 1,470 1,541<br />
1 Adjusted for extraordinary effects.
Distribution Networks’ EBITDA declined by €341 million, chiefly<br />
because of a regulation-driven reduction in power and gas<br />
network charges.<br />
EBITDA at Non-regulated/Other improved by €299 million, due<br />
in part to higher earnings in the retail business and in distributed<br />
generation. Earnings also benefited from improvements<br />
stemming from cost-cutting measures.<br />
Other EU Countries<br />
Other EU Countries’ EBITDA declined by 13 percent, or<br />
€324 million.<br />
Other EU Countries<br />
EBITDA<br />
€ in millions<br />
1 EBIT1 <strong>2011</strong> 2010 <strong>2011</strong> 2010<br />
UK<br />
523 966 390 735<br />
(£ in millions)<br />
(454) (829) (338) (631)<br />
Sweden<br />
672 629 411 405<br />
(SEK in millions) (6,068) (5,997) (3,710) (3,859)<br />
Czechia<br />
470 323 359 220<br />
(CZK in millions) (11,557) (8,167) (8,828) (5,562)<br />
Hungary<br />
223 250 104 105<br />
(HUF in millions) (62,378) (68,973) (29,037) (28,675)<br />
Remaining regional units 371 415 227 248<br />
Total 2,259 2,583 1,491 1,713<br />
1 Adjusted for extraordinary effects.<br />
The UK regional unit’s EBITDA decreased by €443 million, primarily<br />
because of the disposal of the regulated business<br />
(Central Networks), which contributed EBITDA of €430 million<br />
in the second through fourth quarters of 2010.<br />
The Sweden regional unit’s EBITDA increased by €43 million due<br />
to positive currency-translation effects of €36 million and to<br />
wider margins in the retail and distribution businesses, which<br />
were partially mitigated by negative effects from disposals.<br />
CEO Letter<br />
E.ON Stock<br />
Combined Group Management <strong>Report</strong><br />
Consolidated Financial Statements<br />
Corporate Governance <strong>Report</strong><br />
Supervisory Board and Board of Management<br />
Tables and Explanations<br />
Czechia’s EBITDA rose by €147 million, primarily because of<br />
higher <strong>com</strong>pensation payments for the preferential dispatch<br />
of renewable-source electricity in the distribution network.<br />
The main contributions to the Hungary regional unit’s EBITDA<br />
came from its distribution network business (€183 million)<br />
and its retail business (€24 million). The decline from the prioryear<br />
figure is attributable to narrower margins and currencytranslation<br />
effects.<br />
EBITDA at the remaining reporting units decreased by €44 million,<br />
mainly because of higher allowances for overdue receivables<br />
and the disposal of the distribution network in Italy.<br />
Another negative factor was that higher procurement costs led<br />
to narrower margins in the gas business in Romania. Cost<br />
reductions in the retail and heating businesses in the Netherlands<br />
had a positive impact on earnings.<br />
Russia<br />
The Russia unit’s EBITDA rose by €176 million, from €377 million<br />
in the prior year to €553 million, mainly because of an<br />
increase in generating capacity and an improved power margin.<br />
EBIT was €398 million (prior year: €250 million). EBITDA<br />
in local currency increased by 49 percent, from RUB 15,180 million<br />
to RUB 22,620 million. EBIT was RUB 16,256 million<br />
(RUB 10,062 million).<br />
31
32 Earnings Situation<br />
Net Earnings<br />
In <strong>2011</strong>, we recorded a net loss attributable to shareholders<br />
of E.ON AG of -€2.2 billion and corresponding earnings per<br />
share of -€1.16. In the prior year, we recorded net in<strong>com</strong>e of<br />
€5.9 billion and earnings per share of €3.07.<br />
Net Earnings<br />
€ in millions <strong>2011</strong> 2010<br />
EBITDA1 9,293 13,346<br />
Depreciation and amortization -3,689 -3,752<br />
Impairments (-)/Reversals (+) 2 -166 -140<br />
EBIT1 5,438 9,454<br />
Economic interest expense -1,776 -2,257<br />
Net book gains/losses<br />
Restructuring/cost-management<br />
1,221 2,873<br />
expenses -586 -621<br />
E.ON 2.0 restructuring expenses -801 –<br />
Impairment charges2 -3,004 -2,598<br />
Other non-operating earnings<br />
In<strong>com</strong>e/Loss (-) from continuing<br />
-3,403 2,212<br />
operations before taxes -2,911 9,063<br />
In<strong>com</strong>e taxes 1,036 -1,946<br />
In<strong>com</strong>e/Loss (-) from continuing operations -1,875 7,117<br />
In<strong>com</strong>e/Loss (-) from discontinued<br />
operations, net 14 -836<br />
Net loss/Net in<strong>com</strong>e (-) -1,861 6,281<br />
Attributable to shareholders of E.ON AG -2,219 5,853<br />
Attributable to non-controlling interests 358 428<br />
1 Adjusted for extraordinary effects (see Glossary).<br />
2 Impairments differ from the amounts reported in accordance with IFRS due to<br />
impairments on <strong>com</strong>panies accounted for under the equity method and impairments<br />
on other financial assets, and also due to impairments recognized in nonoperating<br />
earnings.<br />
Our economic interest expense improved by €481 million year<br />
on year, mainly because of the reduction in the E.ON Group’s<br />
net debt. The reversal of the adverse interest effect on prepayments<br />
to a fund to support renewables recorded at year-end<br />
2010 was also a positive factor.<br />
Economic Interest Expense<br />
€ in millions<br />
Interest expense shown in Consolidated<br />
<strong>2011</strong> 2010<br />
Statements of In<strong>com</strong>e<br />
Interest in<strong>com</strong>e (-)/expense (+) not<br />
-2,094 -2,303<br />
affecting net in<strong>com</strong>e 318 46<br />
Total -1,776 -2,257<br />
Net book gains in <strong>2011</strong> were €1,652 million, or 58 percent,<br />
below the prior-year level. In <strong>2011</strong>, book gains were recorded<br />
mainly on the sale of our remaining Gazprom stock, our network<br />
business in the United Kingdom, our gas distribution<br />
network in Sweden, and securities. The figure for 2010 reflects,<br />
in particular, book gains on the sale of Gazprom stock and<br />
on the disposal of power capacity and our ultrahigh-voltage<br />
transmission system (transpower) in line with our <strong>com</strong>mitment<br />
to the European Commission.<br />
Restructuring and cost-management expenditures declined<br />
by €35 million. As in the prior year, some expenditures resulted<br />
from restructuring measures at our regional utilities in Germany<br />
and at the UK and France regional units. The <strong>2011</strong> figure<br />
also includes expenditures relating to the restructuring of<br />
our IT organization.<br />
Expenditures under the E.ON 2.0 program result in particular<br />
from obligations relating to early retirement agreements and<br />
settlements.<br />
In the fourth quarter of <strong>2011</strong>, we recorded a total of €3 billion in<br />
impairment charges on assets and goodwill, mainly at generation<br />
businesses. Impairment charges totaling approximately<br />
€1.9 billion were necessary in Spain and Italy due to pessimistic<br />
forecasts for the long-term development of power prices,<br />
regulatory intervention, and reduced utilization of gas-fired
and coal-fired power stations. Of these charges, €1.6 billion<br />
related to conventional power generation, €0.1 billion to<br />
renewable-source power generation, and €0.2 billion to our<br />
regional business in Italy. Power output and generation margins<br />
are also lower than anticipated in Hungary and Slovakia,<br />
necessitating impairment charges of €0.3 billion on power<br />
stations and €0.2 billion on our regional business in Hungary.<br />
The remaining impairment charges total €0.6 billion, of<br />
which €0.2 billion related to power stations and €0.2 billion<br />
to our regional business in the Benelux countries. The main<br />
reasons are that some older power stations were closed earlier<br />
than had been planned and that unfavorable market developments<br />
have led to lower earnings from heating plants and<br />
district heating. The prior-year figure was adversely impacted<br />
primarily by impairment charges of €2.6 billion on goodwill and<br />
other assets at operations in Italy, Spain, and France acquired<br />
from Enel/Acciona and Endesa.<br />
Other non-operating earnings include the marking to market<br />
of derivatives. We use derivatives to shield our operating<br />
business from price fluctuations. Marking to market resulted<br />
in a negative effect of €1,805 million at year-end <strong>2011</strong>, <strong>com</strong>pared<br />
with a positive effect of €2,711 million at year-end 2010.<br />
In addition to the impairment charges recorded in the fourth<br />
quarter, other impairment charges were recorded earlier in the<br />
year. These were recorded mainly on fixed assets following<br />
the amendment of Germany’s Nuclear Energy Act and on production<br />
licenses in our gas business. In <strong>2011</strong>, there were also<br />
negative effects from the reclassification of currency-translation<br />
effects in equity in the wake of the simplification of E.ON’s<br />
organizational setup and from prepayment penalties in connection<br />
with our announced debt reduction to the extent that<br />
such penalties have a tangible relationship to disposal proceeds.<br />
Our tax expense fell by €3 billion <strong>com</strong>pared with the prior year,<br />
principally because of the decline in our earnings.<br />
Prior-year in<strong>com</strong>e/loss from discontinued operations, net, consists<br />
mainly of the earnings of the U.S. Midwest market unit,<br />
which was sold in 2010. Pursuant to IFRS, its results are reported<br />
separately in the Consolidated Statements of In<strong>com</strong>e (see<br />
Note 4 to the Consolidated Financial Statements). The high<br />
negative figure reflects an impairment charge of €0.9 billion<br />
on goodwill at U.S. Midwest in conjunction with the disposal<br />
of our U.S. power and gas business.<br />
Underlying Net In<strong>com</strong>e<br />
CEO Letter<br />
E.ON Stock<br />
Combined Group Management <strong>Report</strong><br />
Consolidated Financial Statements<br />
Corporate Governance <strong>Report</strong><br />
Supervisory Board and Board of Management<br />
Tables and Explanations<br />
Net in<strong>com</strong>e reflects not only our operating performance but<br />
also special effects, such as the marking to market of derivatives.<br />
Underlying net in<strong>com</strong>e is an earnings figure after interest<br />
in<strong>com</strong>e, in<strong>com</strong>e taxes, and minority interests that has<br />
been adjusted to exclude certain special effects. In addition<br />
to the marking to market of derivatives, the adjustments<br />
include book gains and book losses on disposals, restructuring<br />
expenses, other non-operating in<strong>com</strong>e and expenses (after<br />
taxes and non-controlling interests) of a special or rare nature.<br />
Underlying net in<strong>com</strong>e also excludes in<strong>com</strong>e/loss from discontinued<br />
operations and from the cumulative effect of changes<br />
in IFRS principles (after taxes and interests without a controlling<br />
influence), as well as special tax effects.<br />
Underlying Net In<strong>com</strong>e<br />
€ in millions<br />
Net loss/Net in<strong>com</strong>e attributable<br />
<strong>2011</strong> 2010 +/- %<br />
to shareholders of E.ON AG -2,219 5,853 –<br />
Net book gains<br />
Restructuring and cost-manage-<br />
-1,221 -2,873 –<br />
ment expenses 1,387 621 –<br />
Other non-operating earnings<br />
Taxes and non-controlling inter-<br />
6,407 386 –<br />
ests on non-operating earnings -1,708 171 –<br />
Special tax effects<br />
In<strong>com</strong>e/Loss from discontinued<br />
-131 -112 –<br />
operations, net -14 836 –<br />
Total 2,501 4,882 -49<br />
33
34<br />
Earnings Situation<br />
ROACE and Value Added<br />
Group-wide Value-Oriented Management Approach<br />
Our corporate strategy is aimed at delivering sustainable<br />
growth in shareholder value. We have put in place a Group-wide<br />
planning and controlling system to assist us in planning<br />
and managing E.ON as a whole and our individual businesses<br />
with an eye to increasing their value. This system ensures that<br />
our financial resources are allocated efficiently.<br />
Alongside EBITDA, our most important key figure for purposes<br />
of internal management control, we also use return on average<br />
capital employed (“ROACE”) and value added to monitor the<br />
value performance of our operating business. The <strong>2011</strong> financial<br />
year is the first for which we are reporting ROACE. Unlike<br />
ROCE, which records depreciable assets at their book value,<br />
ROACE records them at half of their original acquisition or<br />
production cost. ROACE is therefore not affected by an asset’s<br />
depreciation period. To monitor the periodic performance of<br />
our business, we <strong>com</strong>pare ROACE with cost of capital. In addition<br />
to ROACE, which is a relative performance metric, we<br />
also measure performance using valued added, which is an<br />
absolute performance metric.<br />
Cost of Capital<br />
The cost of capital is determined by calculating the weightedaverage<br />
cost of equity and debt. This average represents the<br />
market-rate returns expected by stockholders and creditors.<br />
The cost of equity is the return expected by an investor in<br />
E.ON stock. The cost of debt equals the long-term financing<br />
terms (after taxes) that apply in the E.ON Group. The parameters<br />
of the cost-of-capital determination are reviewed on an<br />
annual basis. The cost of capital is adjusted if there are significant<br />
changes.<br />
A number of these parameters changed significantly in <strong>2011</strong>.<br />
The table at right illustrates the derivation of cost of capital<br />
before and after taxes. Although market interest-rate levels<br />
were unchanged, the market premium rose from 4 to 4.5 percent<br />
due to persistent stock-market volatility. The E.ON Group’s<br />
debt-to-equity ratio is 50:50. The adjustment of the E.ON Group’s<br />
capital structure reflects its altered market capitalization.<br />
On balance, the changes to the parameters yielded offsetting<br />
effects and therefore did not alter the E.ON Group’s cost of<br />
capital for <strong>2011</strong>. After-tax cost of capital remained at 6.1 percent,<br />
pretax cost of capital at 8.3 percent. There were, however,<br />
some changes to our reporting segments’ minimum ROACE<br />
requirements, which for <strong>2011</strong> ranged from 7.5 percent to 10.9 percent<br />
(before taxes, calculated in euros).<br />
Cost of Capital<br />
<strong>2011</strong> 2010<br />
Risk-free interest rate 4.0% 4.0%<br />
Market premium1 4.5% 4.0%<br />
Beta factor2 1.00 0.84<br />
Cost of equity after taxes 8.5% 7.4%<br />
Tax rate 27% 27%<br />
Cost of equity before taxes 11.6% 10.1%<br />
Cost of debt before taxes 5.0% 5.0%<br />
Tax shield (tax rate: 27%) 3 1.3% 1.3%<br />
Cost of debt after taxes 3.7% 3.7%<br />
Share of equity 50.0% 65.0%<br />
Share of debt 50.0% 35.0%<br />
Cost of capital after taxes 6.1% 6.1%<br />
Cost of capital before taxes 8.3% 8.3%<br />
1 The market premium reflects the higher long-term returns of the stock market<br />
<strong>com</strong>pared with German treasury notes.<br />
2 The beta factor is used as an indicator of a stock’s relative risk. A beta of more<br />
than one signals a higher risk than the risk level of the overall market; a beta<br />
factor of less than one signals a lower risk.<br />
3 The tax shield takes into consideration that the interest on corporate debt<br />
reduces a <strong>com</strong>pany’s tax burden.
Analyzing Value Creation by Means of ROACE and<br />
Value Added<br />
ROACE is a pretax total return on capital. It measures the<br />
sustainable return on invested capital generated by operating<br />
a business. ROACE is defined as the ratio of EBIT to average<br />
capital employed.<br />
Average capital employed represents the interest-bearing<br />
capital tied up in the Group. Capital employed is equal to a<br />
segment’s operating assets less the amount of non-interestbearing<br />
available capital. Depreciable assets are recorded at<br />
half of their original acquisition or production cost. ROACE<br />
is therefore not affected by an asset’s depreciation period.<br />
Goodwill from acquisitions is included at acquisition cost,<br />
as long as this reflects its fair value. Changes to E.ON’s portfolio<br />
during the course of the year are factored into average<br />
capital employed.<br />
Average capital employed does not include the marking to<br />
market of other share investments. The purpose of excluding<br />
this item is to provide us with a more consistent picture of<br />
our ROACE performance.<br />
Value added measures the return that exceeds the cost of<br />
capital employed. It is calculated as follows:<br />
Value added = (ROACE – cost of capital) x average capital<br />
employed.<br />
ROACE and Value Added Performance in <strong>2011</strong><br />
The significant decline in our ROACE, from 14.4 to 8.4 percent,<br />
is primarily attributable to the decline in our EBIT. This effect<br />
was partially counteracted by a slight reduction in our average<br />
capital employed. This resulted from disposals and shutdowns,<br />
which were not entirely offset by ongoing investments. At<br />
8.4 percent, our ROACE again exceeded our pretax cost of capital.<br />
As a result, value added amounted to €90 million.<br />
CEO Letter<br />
E.ON Stock<br />
Combined Group Management <strong>Report</strong><br />
Consolidated Financial Statements<br />
Corporate Governance <strong>Report</strong><br />
Supervisory Board and Board of Management<br />
Tables and Explanations<br />
The table below shows the E.ON Group’s ROACE, value added,<br />
and their derivation.<br />
E.ON Group ROACE and Value Added<br />
€ in millions <strong>2011</strong> 2010<br />
EBIT1 5,438 9,454<br />
Goodwill, intangible assets, and property,<br />
plant, and equipment2 + Shares in affiliated and associated<br />
<strong>com</strong>panies and other share<br />
67,987 72,194<br />
investments 8,233 8,543<br />
+ Inventories 4,828 4,064<br />
+ Accounts receivable<br />
+ Other non-interest-bearing assets,<br />
including deferred in<strong>com</strong>e and<br />
4,055 5,184<br />
deferred tax assets 29,331 23,709<br />
- Non-interest-bearing provisions3 - Non-interest-bearing liabilities,<br />
including deferred expenses and<br />
8,231 8,006<br />
deferred tax liabilities 41,132 37,362<br />
- Adjustments4 Capital employed in continuing<br />
1,908 2,614<br />
operations (at year-end) 63,163 65,712<br />
Capital employed in continuing<br />
operations (annual average) 5 64,438 –<br />
ROACE 8.4% 14.4%<br />
Cost of capital before taxes 8.3% 8.3%<br />
Value added 6 90 4,000<br />
1 Adjusted for extraordinary effects.<br />
2 Depreciable assets are included at half their acquisition or production costs.<br />
Goodwill represents final figures following the <strong>com</strong>pletion of the purchase-price<br />
allocation (see Note 4 to the Consolidated Financial Statements).<br />
3 Non-interest-bearing provisions mainly include current provisions, such as those<br />
relating to sales and procurement market obligations. They do not include provisions<br />
for pensions or for nuclear-waste management.<br />
4 Capital employed is adjusted to exclude the mark-to-market valuation of other share<br />
investments, receivables and liabilities from derivatives, and operating liabilities<br />
for certain purchase obligations to minority shareholdings pursuant to IAS 32.<br />
5 In order to better depict intraperiod fluctuations in average capital employed,<br />
annual average capital employed is calculated as the arithmetic average of the<br />
amounts at the beginning of the year and the end of the year.<br />
6 Due to the switch from capital employed to average capital employed, the prioryear<br />
figure reflects cost of capital as of the balance sheet date.<br />
35
36 Financial Condition<br />
Investments<br />
In <strong>2011</strong>, our investments declined by about €1.8 billion year<br />
on year to €6.5 billion. We invested about €6.2 billion in property,<br />
plant, and equipment and in intangible assets (prior<br />
year: €7.9 billion). Share investments totaled €0.3 billion versus<br />
€0.4 billion in the prior year.<br />
Our investments outside Germany declined by 21 percent to<br />
€4,709 million (prior year: €5,924 million).<br />
Investments<br />
€ in millions <strong>2011</strong> 2010 +/- %<br />
Generation 1,711 2,592 -34<br />
Renewables 1,114 1,260 -12<br />
Gas 1,204 1,244 -3<br />
Trading 24 16 +50<br />
Germany 910 1,083 -16<br />
Other EU Countries 1,210 1,565 -23<br />
Russia<br />
Group Management/<br />
322 433 -26<br />
Consolidation 29 93 -69<br />
Total 6,524 8,286 -21<br />
Maintenance investments<br />
Growth and replacement<br />
1,257 1,110 +13<br />
investments 5,267 7,176 -27<br />
Generation invested €881 million less than in the prior year.<br />
Investments in property, plant, and equipment and intangible<br />
assets declined by €1,020 million, from €2,540 million to<br />
€1,520 million. The high prior-year figure mainly reflects expenditures<br />
on generation projects in Gönyü (Hungary), Malzenice<br />
(Slovakia), Irsching (Germany), Algeciras (Spain), and Émile<br />
Huchet (France), which are now <strong>com</strong>pleted. Another factor<br />
was the shutdown of several nuclear power stations in Germany,<br />
which resulted in lower investments in nuclear generation.<br />
In addition, investments in the generation project in Maasvlakte<br />
(Netherlands) were higher in the prior year.<br />
Investments at Renewables were down by €146 million. Hydro’s<br />
investments of €83 million were 14 percent below the prioryear<br />
figure of €97 million. Wind/Solar/Other’s investments<br />
declined by 11 percent, from €1,163 million to €1,031 million.<br />
These expenditures mainly reflect the development and construction<br />
of wind farms in Europe and the United States.<br />
Gas invested €1,204 million. Of this figure, €1,123 million (prior<br />
year: €1,102 million) went towards property, plant, and equipment<br />
and towards intangible assets. It consisted mainly of<br />
investments in the exploration business and in gas infrastructure.<br />
Share investments of €81 million (prior year: €142 million)<br />
were chiefly attributable to the repurchase of E.ON<br />
Bioerdgas from E.ON Climate & Renewables and to a capital<br />
increase at the Nord Stream pipeline <strong>com</strong>pany.<br />
The Germany regional unit invested €173 million less than in<br />
2010. Investments in property, plant, and equipment and<br />
intangible assets declined by €165 million to €892 million, owing<br />
principally to lower investment in power distribution and<br />
higher expenditures in the prior year for Plattling power station<br />
and waste-incineration projects. Share investments<br />
totaled €18 million.<br />
Investments at Other EU Countries were €355 million below<br />
the prior-year figure. The UK regional unit invested about<br />
€212 million (prior year: €523 million). The sale of Central Networks<br />
was the main cause for the decline. The Sweden unit’s<br />
investments of €422 million were €5 million less than the prioryear<br />
figure (€427 million). Sweden invested €420 million<br />
(prior year: €425 million) in intangible assets and property,<br />
plant, and equipment to maintain and expand existing distributed<br />
generating units and to upgrade and modernize its<br />
distribution network. Investments of €200 million in Czechia<br />
were at the prior-year level. Investments in Hungary declined<br />
by 7 percent, from €158 million to €147 million.<br />
The Russia unit invested €322 million (prior year: €433 million),<br />
mainly in its new-build program.
Cash Flow and Financial Position<br />
E.ON presents its financial condition using, among other<br />
financial measures, cash provided by operating activities of<br />
continuing operations and economic net debt.<br />
At €6.6 billion, our cash provided by operating activities of<br />
continuing operations was considerably below the prior-year<br />
figure of €10.6 billion. The main reasons for the decline were<br />
cash-effective items in conjunction with the decrease in EBITDA,<br />
a non-recurring adverse effect relating to the refunding of<br />
pension assets in the United Kingdom, and negative workingcapital<br />
effects. The main negative factors for the latter item<br />
were lower subsidy payments for new wind farms in the United<br />
States, portfolio effects, higher interest payments, and changes<br />
in working capital at Trading and Gas and at certain regional<br />
units. Lower tax payments had a positive effect.<br />
Cash provided by investing activities of continuing operations<br />
amounted to about -€3.1 billion in <strong>2011</strong> (prior year: €1.1 billion).<br />
Investment expenditures on property, plant, and equipment<br />
were lower, as were the proceeds from the sale of equity interests.<br />
In addition, significantly more cash was invested in securities<br />
and fixed-term deposits than in the prior year.<br />
Cash provided by financing activities of continuing operations<br />
of -€5.8 billion (prior year: -€9.9 billion) primarily reflects<br />
the net repayment of financial liabilities and E.ON’s again high<br />
dividend payment.<br />
Compared with the figure recorded at December 31, 2010<br />
(-€37,701 million), our economic net debt improved by €1,316 million<br />
to -€36,385 million. The main reasons for the improvement<br />
were the sale of Central Networks and the sale of the<br />
second tranche of Gazprom stock. Along with these disposal<br />
proceeds, our cash provided by operating activities exceeded<br />
our investments in property, plant, and equipment. E.ON AG’s<br />
dividend payout had an adverse effect on our economic net<br />
debt. The increase in provisions for nuclear waste management<br />
was due in part to the amendment of Germany’s Nuclear<br />
Energy Act.<br />
CEO Letter<br />
E.ON Stock<br />
Combined Group Management <strong>Report</strong><br />
Consolidated Financial Statements<br />
Corporate Governance <strong>Report</strong><br />
Supervisory Board and Board of Management<br />
Tables and Explanations<br />
The calculation of economic net debt includes the fair value<br />
(net) of currency derivatives used for financing transactions<br />
(but excluding transactions relating to our operating business<br />
and asset management) in order to also reflect the foreigncurrency<br />
effects of financial transactions which, for accounting<br />
reasons, would not be included in the <strong>com</strong>ponents of net<br />
financial position.<br />
Economic Net Debt<br />
€ in millions<br />
December 31<br />
<strong>2011</strong> 2010<br />
Liquid funds 7,020 8,273<br />
Non-current securities<br />
Total liquid funds and non-current<br />
4,904 3,903<br />
securities 11,924 12,176<br />
Financial liabilities to banks and third<br />
parties<br />
Financial liabilities resulting from<br />
interests in associated <strong>com</strong>panies and<br />
-28,490 -31,799<br />
other shareholdings -1,424 -692<br />
Total financial liabilities -29,914 -32,491<br />
Net financial position -17,990 -20,315<br />
Fair value (net) of currency derivatives<br />
used for financing transactions1 524 334<br />
Provisions for pensions -3,245 -3,250<br />
Asset-retirement obligations<br />
Less prepayments to Swedish nuclear<br />
-17,269 -15,968<br />
fund 1,595 1,498<br />
Economic net debt -36,385 -37,701<br />
EBITDA2 9,293 13,346<br />
Debt factor 3.9 2.8<br />
1 Does not include transactions relating to our operating business or asset<br />
management.<br />
2 Adjusted for extraordinary effects.<br />
Our debt factor was 3.9 at year-end <strong>2011</strong> (prior year: 2.8).<br />
However, this was predominantly attributable to largely noncash-effective,<br />
non-recurring items resulting from Germany’s<br />
accelerated phaseout of nuclear energy. Adjusted for these<br />
effects, our debt factor was 3.4.<br />
37
38 Financial Condition<br />
Finance Strategy<br />
E.ON’s finance strategy has three key <strong>com</strong>ponents: rating, debt<br />
factor, and dividend policy. E.ON targets a solid single A rating.<br />
This rating enables us to <strong>com</strong>bine our objective of an efficient<br />
capital structure with access to a variety of financing sources.<br />
Our rating target has a direct impact on E.ON’s capital structure,<br />
which we monitor using our debt factor. Debt factor is<br />
our economic net debt divided by EBITDA. Economic net debt<br />
includes not only our financial liabilities but also our provisions<br />
for pensions and asset retirement obligations as well as the<br />
fair value (net) of currency derivatives used for financing transactions<br />
(but excluding transactions relating to our operating<br />
business and asset management). Our medium-term target<br />
debt factor is less than 3 (prior year: up to 3). To ensure that we<br />
achieve our target debt factor of less than 3, in November<br />
2010 we announced an additional program to manage our portfolio<br />
and capital structure. These measures included €15 billion<br />
of disposals, about €9.2 billion of which have already been<br />
made. This was one of the reasons E.ON achieved its target<br />
rating of solid single A.<br />
The third key <strong>com</strong>ponent of our finance strategy is our dividend<br />
policy, under which in recent years we have consistently<br />
aimed to pay out 50 to 60 percent of underlying net in<strong>com</strong>e.<br />
In balancing this objective against that of maintaining a stable<br />
dividend, we are proposing a dividend of €1 per share for<br />
the <strong>2011</strong> financial year, which would be a reduction from the<br />
prior-year dividend of €1.50 per share. However, we plan to<br />
raise the dividend to €1.10 per share for the 2012 financial year<br />
and to at least that amount for the 2013 financial year. As a<br />
general rule, we are standing by our target payout ratio of 50 to<br />
60 percent of underlying net in<strong>com</strong>e. This dividend policy<br />
ensures a long-term, value-enhancing investment with a stable<br />
return for our shareholders, even in difficult times.<br />
Funding Policy and Initiatives<br />
Our funding policy is designed to give E.ON access to a variety<br />
of financing sources at any time. We achieve this objective<br />
by basing our funding policy on the following principles: First,<br />
we use a variety of markets and debt instruments to maximize<br />
the diversity of our investor base. Second, we issue bonds<br />
with terms that give our debt portfolio a balanced maturity<br />
profile. Third, we <strong>com</strong>bine large-volume benchmark issues with<br />
smaller issues that take advantage of market opportunities<br />
as they arise. As a rule, external funding is carried out by our<br />
Dutch finance subsidiary E.ON International Finance B.V.<br />
under guarantee of E.ON AG or by E.ON AG itself, and the funds<br />
are subsequently on-lent in the Group.<br />
Due to its liquidity situation, E.ON did not issue bonds in <strong>2011</strong>.<br />
In line with the announcement that we would use at least<br />
half of our disposal proceeds to reduce our debt, on January 24,<br />
<strong>2011</strong>, we made a two-stage offer to repurchase, prior to maturity,<br />
several bonds with a total face value of about €7 billion<br />
and maturities through 2014. We repurchased about €1.8 billion<br />
in bonds under this offer. In addition, we repaid, prior to<br />
maturity, about €0.6 billion in promissory notes in <strong>2011</strong>. Onschedule<br />
bond repayments of €2.1 billion and the deconsolidation<br />
of €0.6 billion of debt due to the disposal of our U.K.<br />
distribution business also reduced E.ON’s gross debt. These<br />
effects were partially mitigated primarily by the issuance of<br />
<strong>com</strong>mercial paper in the fourth quarter of <strong>2011</strong> to meet a<br />
short-term financing need. On balance, in <strong>2011</strong> E.ON reduced<br />
its gross debt to financial institutions and third parties by<br />
more than €3 billion to €28.5 billion.<br />
Currently outstanding bonds issued by E.ON AG and E.ON<br />
International Finance B.V. <strong>com</strong>prise most of the E.ON Group’s<br />
gross debt. With the exception of a U.S.-dollar-denominated<br />
bond issued in 2008, these bonds were issued under our Debt<br />
Issuance Program (“DIP”). The DIP enables us to issue debt<br />
to investors in public and private placements. In April <strong>2011</strong>, it<br />
was extended, as planned, for one year. The DIP has a total<br />
volume of €35 billion. About €21.1 billion worth of bonds were<br />
outstanding under the program at year-end <strong>2011</strong>.
In addition to our DIP, we have a €10 billion European Commercial<br />
Paper (“CP”) program and a $10 billion U.S. CP program<br />
under which we can issue short-term liabilities. We use CP<br />
to finance short-term funding peaks and to further diversify<br />
our investor base. We had €869 million in CP outstanding at<br />
year-end <strong>2011</strong> (prior year: €0).<br />
Financial Liabilities<br />
€ in billions Dec. 31, <strong>2011</strong> Dec. 31, 2010<br />
Bonds1 23.4 27.5<br />
EUR 13.3 16.6<br />
GBP 5.0 5.5<br />
USD 2.6 2.5<br />
CHF 1.3 1.6<br />
SEK 0.3 0.4<br />
JPY 0.8 0.7<br />
Other currencies 0.1 0.2<br />
Promissory notes 0.8 1.4<br />
CP 0.9 –<br />
Other liabilities 4.8 3.6<br />
Total 29.9 32.5<br />
1 Includes private placements.<br />
Notes 26 and 27 to the Consolidated Financial Statements<br />
contain more information about E.ON’s bonds as well as liabilities,<br />
contingencies, and other <strong>com</strong>mitments.<br />
We also have access to a five-year, €6 billion syndicated<br />
revolving credit facility, which was concluded with 30 banks<br />
on November 25, 2010. This facility has not been drawn on<br />
CEO Letter<br />
E.ON Stock<br />
Combined Group Management <strong>Report</strong><br />
Consolidated Financial Statements<br />
Corporate Governance <strong>Report</strong><br />
Supervisory Board and Board of Management<br />
Tables and Explanations<br />
and instead serves as a reliable, ongoing general liquidity<br />
reserve for the E.ON Group. Participation in the credit facility<br />
indicates that a bank belongs to E.ON’s core group of banks.<br />
Standard & Poor’s (“S&P”) long-term rating for E.ON is A;<br />
Moody’s long-term rating for E.ON is A3. The short-term ratings<br />
are A-1 (S&P) and P-2 (Moody’s). In July <strong>2011</strong>, S&P confirmed<br />
its A rating and changed the outlook from stable to negative.<br />
In October <strong>2011</strong>, Moody’s downgraded E.ON’s short-term rating<br />
from P-1 to P-2 and its long-term rating from A2 to A3 with a<br />
stable outlook. The ratings assigned by both agencies therefore<br />
remain in line with E.ON’s rating target (solid single A).<br />
E.ON AG Ratings<br />
Long<br />
term<br />
Short<br />
term Outlook<br />
Moody’s A3 P-2 Stable<br />
S&P A A-1 Negative<br />
Providing rating agencies with timely, <strong>com</strong>prehensive information<br />
is an important <strong>com</strong>ponent of our creditor relations. The<br />
purpose of our creditor relations is to maintain our investors’<br />
trust by <strong>com</strong>municating a clear strategy with the highest<br />
degree of transparency. The mechanisms we use to achieve this<br />
include debt investor updates in major European financial<br />
centers, periodic conference calls for debt analysts and investors,<br />
and informational meetings for our core group of banks.<br />
Maturity Profile of Bonds and Promissory Notes Issued by E.ON AG<br />
and E.ON International Finance B.V.<br />
€ in billions December 31, <strong>2011</strong><br />
4.0<br />
3.0<br />
2.0<br />
1.0<br />
2012 2013 2014 2015 2016 2017 2018 2019 2020 2021+<br />
39
40<br />
Asset Situation<br />
Non-current assets at year-end <strong>2011</strong> declined by 4 percent<br />
<strong>com</strong>pared with the figure at year-end 2010, mainly due to the<br />
sale of the assets of our U.K. network business and to impairment<br />
charges on assets and goodwill. In the fourth quarter of<br />
<strong>2011</strong>, we determined the need to record impairment charges<br />
of €3 billion on assets and goodwill in Spain and Italy, among<br />
other places. These effects were partially offset by investments<br />
in property, plant, and equipment and by higher deferred tax<br />
assets, primarily from net operating loss carryforwards.<br />
Current assets rose by 10 percent from year-end 2010, mainly<br />
because of higher operating receivables and higher in<strong>com</strong>e<br />
tax assets. These effects were partially offset by the sale of<br />
Gazprom stock in the first quarter of <strong>2011</strong>.<br />
Our equity ratio of 26 percent was 4 percentage points lower<br />
than the figure at year-end 2010. In the fourth quarter of <strong>2011</strong>,<br />
we recorded substantial impairment charges as well as losses<br />
on the marking to market of derivatives used to shield our<br />
operating business from price fluctuations.<br />
Non-current liabilities declined by 4 percent relative to yearend<br />
2010, primarily because of the early repayment of noncurrent<br />
debt. This effect was mitigated primarily by an increase<br />
in provisions on non-current asset-retirement and restructuring<br />
obligations.<br />
Current liabilities rose by 22 percent relative to year-end 2010,<br />
mainly because of the accumulation of operating liabilities,<br />
higher in<strong>com</strong>e tax liabilities, and higher financial liabilities.<br />
The following key figures underscore that the E.ON Group<br />
has a solid asset and capital structure:<br />
• Non-current assets are covered by equity at 39 percent<br />
(December 31, 2010: 43 percent).<br />
• Non-current assets are covered by long-term capital at<br />
104 percent (December 31, 2010: 108 percent).<br />
Additional information about our asset situation is contained<br />
in Notes 4 to 26 to the Consolidated Financial Statements.<br />
Summary Statement on E.ON’s Earnings, Financial,<br />
and Asset Situation<br />
Although <strong>2011</strong> presented us with a difficult business environment—weak<br />
energy demand (and the resulting adverse<br />
impact on capacity utilization, prices, and margins), substantial<br />
<strong>com</strong>petitive pressure in our gas wholesale business, and the<br />
early shutdown of a number of our nuclear power stations in<br />
Germany—we were able to deliver results in line with the<br />
adjustment to our earnings guidance made at the half-year mark.<br />
We improved E.ON’s financial strength and flexibility. As of<br />
year-end <strong>2011</strong>, we had reduced E.ON’s net debt to about €36.4 billion<br />
and our net financial position to about -€18 billion. In<br />
addition, the E.ON Group continues to have a solid asset and<br />
capital structure.<br />
Consolidated Assets, Liabilities, and Equity<br />
€ in millions Dec. 31, <strong>2011</strong> % Dec. 31, 2010 %<br />
Non-current assets 102,221 67 106,657 70<br />
Current assets 50,651 33 46,224 30<br />
Total assets 152,872 100 152,881 100<br />
Equity 39,613 26 45,585 30<br />
Non-current liabilities 67,129 44 69,580 45<br />
Current liabilities 46,130 30 37,716 25<br />
Total equity and liabilities 152,872 100 152,881 100
E.ON AG’s Earnings, Financial, and Asset Situation<br />
E.ON AG prepares its Financial Statements in accordance with<br />
the German Commercial Code (as codified in the Accounting<br />
Law Reform Act, which took effect on May 29, 2009) and the<br />
German Stock Corporation Act.<br />
Balance Sheet of E.ON AG (Summary)<br />
December 31<br />
€ in millions<br />
Intangible assets and property, plant,<br />
<strong>2011</strong> 2010<br />
and equipment 125 134<br />
Financial assets 36,385 38,983<br />
Non-current assets 36,510 39,117<br />
Receivables from affiliated <strong>com</strong>panies 18,457 19,310<br />
Other receivables and assets 6,094 5,835<br />
Liquid funds 1,523 2,271<br />
Current assets 26,074 27,416<br />
Total assets 62,584 66,533<br />
Equity 12,787 13,648<br />
Provisions 6,434 6,043<br />
Liabilities to affiliated <strong>com</strong>panies 39,466 44,237<br />
Other liabilities 3,897 2,605<br />
Total equity and liabilities 62,584 66,533<br />
E.ON AG is the parent <strong>com</strong>pany of the E.ON Group. As such, its<br />
earnings, financial, and asset situation is affected by in<strong>com</strong>e<br />
from equity interests. In <strong>2011</strong>, this in<strong>com</strong>e declined by €1,661 million<br />
to €5,081 million because some profit transfers were<br />
lower and because loss-offset obligations were higher. Positive<br />
in<strong>com</strong>e from equity interests benefited in particular from<br />
E.ON Energie AG’s profit transfer of €2,517 million. In addition,<br />
the distribution of capital reserves of E.ON Finanzanlagen<br />
GmbH increased earnings by €3,660 million. In<strong>com</strong>e from equity<br />
interests was adversely affected by loss-offset obligations<br />
relating to provisions recorded at E.ON Iberia Holding GmbH<br />
in the wake of impairment charges on financial assets.<br />
CEO Letter<br />
E.ON Stock<br />
Combined Group Management <strong>Report</strong><br />
Consolidated Financial Statements<br />
Corporate Governance <strong>Report</strong><br />
Supervisory Board and Board of Management<br />
Tables and Explanations<br />
The negative figure recorded under other expenditures and<br />
in<strong>com</strong>e (net) deteriorated by €738 million year on year to<br />
-€1,621 million, in particular because of an expense of €1,400 million<br />
relating to an addition to capital reserves at E.ON Italia<br />
S.p.A. Earnings were positively affected by accretions on interests<br />
in affiliated <strong>com</strong>panies of €144 million.<br />
In<strong>com</strong>e Statement of E.ON AG (Summary)<br />
€ in millions <strong>2011</strong> 2010<br />
In<strong>com</strong>e from equity interests 5,081 6,742<br />
Interest in<strong>com</strong>e -1,270 -1,324<br />
Other expenditures and in<strong>com</strong>e -1,621 -883<br />
In<strong>com</strong>e from continuing operations 2,190 4,535<br />
Extraordinary expenses -37 -86<br />
Taxes -157 -638<br />
Net in<strong>com</strong>e 1,996 3,811<br />
Net in<strong>com</strong>e transferred to retained<br />
earnings -91 -953<br />
Net in<strong>com</strong>e available for distribution 1,905 2,858<br />
All of the in<strong>com</strong>e taxes reported represent taxes for prior years.<br />
At the <strong>Annual</strong> Shareholders Meeting on May 3, 2012, management<br />
will propose that net in<strong>com</strong>e available for distribution<br />
be used to pay a cash dividend of €1 per ordinary share. The<br />
dividend is thus being maintained at a high level. We believe<br />
that in this way E.ON stock remains attractive to investors.<br />
The <strong>com</strong>plete Financial Statements of E.ON AG, with the unqualified<br />
opinion issued by the auditors, PricewaterhouseCoopers<br />
Aktiengesellschaft, Wirtschaftsprüfungsgesellschaft, Düsseldorf,<br />
will be announced in the electronic Bundesanzeiger. Copies<br />
are available on request from E.ON AG and at www.eon.<strong>com</strong>.<br />
Disclosure of Takeover Barriers<br />
The disclosures pursuant to Section 289, Paragraph 4, and<br />
Section 315, Paragraph 4 of the German Commercial Code,<br />
which are part of this Combined Group Management <strong>Report</strong>,<br />
are in the chapter Disclosure of Takeover Barriers on pages<br />
196 to 199 of this report.<br />
41
42 Corporate Sustainability<br />
In recent years, society’s expectations towards the energy<br />
industry have increased. Our stakeholders expect us to operate<br />
our businesses responsibly and sustainably. At the same time,<br />
we face greater challenges, like finding answers to climate<br />
change and sustainable solutions for the energy supply system<br />
of the future. E.ON’s new strategy, cleaner & better energy,<br />
addresses these <strong>com</strong>plex demands. In line with this strategy,<br />
in <strong>2011</strong> we designed a new sustainability program that focuses<br />
on further embedding sustainability criteria (such as environmental<br />
protection, occupational safety, and corporate governance)<br />
into key business areas. In dialog with various stakeholders,<br />
we have set long-term targets, which we describe in<br />
our Sustainability <strong>Report</strong>. This annual publication also explains<br />
our key focus areas and reports on the latest developments.<br />
It is only by reporting on our performance transparently and<br />
by continually engaging our stakeholders that we will engender<br />
the trust and acceptance that we need to ensure the longterm<br />
success of our business.<br />
Our successes in <strong>2011</strong> included reducing our accident rate and<br />
promoting responsible fuel procurement by cofounding the<br />
Better Coal initiative. We were again included in the Dow Jones<br />
Sustainability Index, which underscores our performance as<br />
a sustainability-oriented <strong>com</strong>pany. More information about our<br />
sustainability efforts is available at www.eon.<strong>com</strong>, where<br />
you will also find our new Sustainability <strong>Report</strong>, which will be<br />
released in May 2012.<br />
Emissions data for our power and heat generation are segmented<br />
by country in accordance with the EU Emissions<br />
Trading Scheme. This differs from the segmentation for the<br />
rest of our reporting.<br />
E.ON emitted about 125 million metric tons of CO 2 from power<br />
and heat generation in <strong>2011</strong>, of which 88 million metric tons<br />
were in Europe. We were allocated EU carbon allowances for<br />
81 million metric tons. Overall, our carbon intensity increased<br />
by about 4 percent to 0.43 metric tons per MWh. Our carbon<br />
intensity in Europe rose from 0.39 metric tons per MWh to<br />
0.41 metric tons per MWh. This increase is attributable to Germany’s<br />
decision in <strong>2011</strong> to shut down several nuclear power<br />
stations, which eliminated a portion of our carbon-free generating<br />
capacity in our largest market. Nevertheless, reducing<br />
our carbon intensity remains our long-term objective.<br />
Carbon Emissions from Power and Heat<br />
Generation, Allocated EU Carbon Allowances<br />
Million metric tons CO2 emissions<br />
Allocated<br />
carbon<br />
allowances<br />
Germany 38.16 28.12<br />
United Kingdom 18.73 17.22<br />
Spain 4.98 4.82<br />
France 4.59 7.68<br />
Italy 7.59 7.67<br />
Other EU Countries1 14.40 15.16<br />
E.ON Group (Europe only) 88.45 80.67<br />
Russia2 36.14 –<br />
E.ON Group 124.59 –<br />
1 Includes carbon emissions from gas transport.<br />
2 Russia is not covered by the EU Emissions Trading Scheme.<br />
E.ON Group Carbon Intensity1 Metric tons of CO2 per MWh <strong>2011</strong> 2010<br />
Germany 0.38 0.32<br />
United Kingdom 0.62 0.66<br />
Spain 0.55 0.51<br />
France 0.71 0.81<br />
Italy 0.45 0.41<br />
Other EU Countries 0.26 0.27<br />
E.ON Group (Europe only) 2 0.41 0.39<br />
Russia 0.56 0.56<br />
E.ON Group3 0.43 0.42<br />
1 Specific carbon emissions are defined as the amount of CO2 emitted for each<br />
MWh of electricity generated.<br />
2 Includes renewables generation in Europe.<br />
3 Includes renewables generation outside Europe (wind power in the United States).
Employees<br />
HR Strategy<br />
The knowledge of our employees is of decisive importance<br />
for the implementation of E.ON’s cleaner & better energy<br />
strategy. To promote the implementation of this strategy and<br />
at the same time to enhance efficiency of our HR effort, we<br />
continue to focus on four strategic HR task areas:<br />
• Managing the Business<br />
• Managing Resources<br />
• Developing Talent<br />
• Operational HR.<br />
Systematically addressing these four areas will make an<br />
important contribution towards achieving E.ON 2.0’s ambitious<br />
targets.<br />
Managing the Business<br />
Following changes to the categories to which we assign our<br />
executives, we revamped the main management and steering<br />
mechanisms for executives. The incentive systems for all<br />
executives, including Board of Management members, were<br />
redesigned and standardized and now apply across the<br />
entire E.ON Group.<br />
Individual performance—especially the performance of<br />
those functions that are central to an individual executive’s<br />
role—receives increased weighting in the short-term incentive.<br />
The <strong>com</strong>pany <strong>com</strong>ponent of the incentive consists of our<br />
key earnings metrics, EBITDA, ROACE, and WACC, thus setting<br />
uniform objectives for all of our <strong>com</strong>pany’s executives. In the<br />
future, we plan to use these metrics in the incentive systems<br />
for our employees, as well.<br />
Managing Resources<br />
Employer Brand<br />
An international study by Universum, a consulting firm,<br />
ranked E.ON among Europe’s most popular employers. Our<br />
performance is similar in other studies. For example, E.ON<br />
was included in The Times Top 100 Graduate Employers in the<br />
United Kingdom.<br />
CEO Letter<br />
E.ON Stock<br />
Combined Group Management <strong>Report</strong><br />
Consolidated Financial Statements<br />
Corporate Governance <strong>Report</strong><br />
Supervisory Board and Board of Management<br />
Tables and Explanations<br />
In a study conducted by Career magazine that assessed, from<br />
the applicant’s perspective, the quality of the recruiting activities<br />
of Germany’s 500 biggest <strong>com</strong>panies, E.ON took first place.<br />
Strategic HR Planning<br />
Strategic HR planning is our primary tool for identifying, as<br />
early as possible, external factors (such as the shortage of<br />
professional staff on the labor market) and internal gaps in<br />
mission-critical functions and for taking appropriate countermeasures.<br />
It <strong>com</strong>pares our future workforce with a forecast<br />
of our long-term staffing needs derived from our corporate<br />
strategy and the business development of individual units.<br />
The gradual rollout of strategic HR planning at E.ON is supported<br />
by IT tools that were developed for the entire E.ON<br />
Group in accordance with a consistent method. The pilot rollout<br />
at our network <strong>com</strong>panies in Germany is already under<br />
way, as are preparations for rolling out strategic HR planning<br />
at other units.<br />
Developing Talent<br />
A key task for all managers is to continually foster the targeted<br />
development and professional training of their employees.<br />
The conscientious fulfillment of this task establishes the foundation<br />
for successful performance management and ensures<br />
that our organization proactively and foresightfully prepares<br />
itself to meet the challenges of the future. The strategic<br />
significance of talent management is increasing, particularly in<br />
view of E.ON’s new strategy. As part of this effort, in <strong>2011</strong> we<br />
revised our existing Group-wide development mechanisms and<br />
aligned them more closely with the <strong>com</strong>pany’s needs.<br />
In addition, we established talent boards (whose purpose is<br />
to identify the top talents in our <strong>com</strong>pany) and agreed on<br />
measures tailored to the needs of each job family. An example<br />
of the latter is a high-potential program for the engineering<br />
job family.<br />
In <strong>2011</strong>, we also redesigned our Group-wide Talent Pool program.<br />
The program enables us to identify highly qualified and<br />
ambitious managers and next-generation managers, to support<br />
their development through multi-year programs, and to prepare<br />
them for more senior roles.<br />
43
44 Employees<br />
Group-wide HR development costs amounted to around €68 million<br />
in <strong>2011</strong>. The majority of this training is conducted by<br />
E.ON Academy, our corporate university.<br />
Diversity<br />
Our diversity management focuses particularly on gender,<br />
internationality, and employability. Our ambitious objective<br />
for our organization as a whole is to more than double the<br />
percentage of women in management positions and to raise<br />
it to 14 percent in Germany by the end of 2016.<br />
We support the achievement of this objective with a variety<br />
of measures. Each unit has specific targets, and progress<br />
towards these targets is monitored at regular intervals. We<br />
also revised our Group-wide guidelines for filling management<br />
positions. For example, at least one male and one female<br />
must be considered as potential successors for each vacant<br />
management position. Many units also have support mechanisms<br />
in place, including mentoring programs for female<br />
managers and next-generation managers, the provision of<br />
daycare, flexible work schedules, and home-office arrangements.<br />
Significantly increasing the percentage of women in<br />
our internal talent pool is a further prerequisite for raising,<br />
over the long term, their percentage in management and top<br />
executive positions. In order to further raise our managers’<br />
awareness of diversity, it is increasingly part of the curriculum<br />
in our management training programs.<br />
A year-on-year <strong>com</strong>parison shows that we are already making<br />
progress. The percentage of female executives at E.ON <strong>com</strong>panies<br />
increased from 11.5 to 12.5 percent overall and from<br />
8.6 to 9.5 percent in Germany.<br />
In the context of E.ON’s increasing internationalization, the<br />
new International Transfer Policy put in place in <strong>2011</strong> helps<br />
employees (and their partner and children) be<strong>com</strong>e integrated<br />
in their host country. The new policy also provides more support<br />
for employees’ reintegration into their home country and<br />
<strong>com</strong>pany at the conclusion of their international transfer.<br />
We want to offer our employees a work environment that<br />
maintains their health and employability. We do this by fostering<br />
life-long learning through a wide variety of training<br />
and qualification programs and by promoting health through<br />
a range of preventive initiatives.<br />
HealthCheck at E.ON<br />
Occupational health management requires a foundation of<br />
trust, and it is important to encourage employees to take<br />
advantage of the health-management programs offered by<br />
the <strong>com</strong>pany. A pilot project called HealthCheck, which was<br />
conducted at a number of E.ON offices in Düsseldorf (Group<br />
Management, E.ON Climate & Renewables, and E.ON IT) in<br />
<strong>2011</strong>, achieved a participation rate of over 50 percent and an<br />
evaluation of “very good” from employees.<br />
HealthCheck consisted of medical exams, an online questionnaire,<br />
and a results report that provided a detailed description<br />
of the employee’s health status and re<strong>com</strong>mendations for<br />
possible follow-up measures.<br />
In <strong>2011</strong>, we also held a health campaign at all our <strong>com</strong>panies<br />
in Germany to raise awareness of musculoskeletal disorders.<br />
Reflecting the greater coordination of our health-management<br />
effort, several units outside Germany participated in the<br />
campaign, which consisted of screenings and other activities.<br />
Operational HR<br />
The HR team is working on efficiency improvements as part<br />
of E.ON 2.0 (see page 11).
Workforce Figures<br />
At year-end <strong>2011</strong>, the E.ON Group’s consolidated <strong>com</strong>panies<br />
had 78,889 employees worldwide, a decline of 7.3 percent from<br />
year-end 2010. E.ON also had 2,466 apprentices and 298 board<br />
members and managing directors.<br />
Employees1 December 31<br />
<strong>2011</strong> 2010 +/- %<br />
Generation 10,578 10,997 -4<br />
Renewables 1,808 1,737 +4<br />
Gas 3,202 3,189 –<br />
Trading 1,002 1,062 -6<br />
Germany 21,542 21,084 +2<br />
Other EU Countries 31,909 37,403 -15<br />
Russia 4,896 4,812 +2<br />
Group Management/Other2 3,952 4,821 -18<br />
Total 78,889 85,105 -7<br />
1 Does not include board members, managing directors, or apprentices.<br />
2 Includes E.ON IT Group.<br />
The headcount at Generation was lower mainly because of<br />
the sale of a power station in Poland and the transfer of<br />
employees in Italy from Generation to the Italy regional unit.<br />
The decline in the number of employees at Trading is attributable<br />
to the expiration of temporary secondments and<br />
employment contracts as part of this unit’s centralization<br />
and to fluctuations.<br />
The headcount at the Germany unit was higher mainly<br />
because of the expansion of service <strong>com</strong>panies and additional<br />
employees at our regional distribution <strong>com</strong>panies in conjunction<br />
with Germany’s Renewable Energy Law. This effect was<br />
partially offset by the transfer of employees to the Group<br />
Management/Other segment as part of the greater centralization<br />
of functions.<br />
The decline in the number of employees at Other EU Countries<br />
is mainly attributable to disposals at the UK and Sweden<br />
regional units and to efficiency-enhancement measures at UK.<br />
The headcount at Russia increased because of the expansion<br />
of a newly created central repair shop.<br />
CEO Letter<br />
E.ON Stock<br />
Combined Group Management <strong>Report</strong><br />
Consolidated Financial Statements<br />
Corporate Governance <strong>Report</strong><br />
Supervisory Board and Board of Management<br />
Tables and Explanations<br />
The increase in Group Management/Other segment’s headcount<br />
due to the implementation of E.ON’s new organizational<br />
setup was offset by the outsourcing of IT infrastructure and<br />
by a deconsolidation at E.ON IT Group.<br />
Geographic Profile<br />
At year-end <strong>2011</strong>, 43,756 employees, or 55 percent of all staff,<br />
were working outside Germany, slightly below the percentage<br />
from year-end 2010.<br />
Employees by Region1 Germany<br />
Dec. 31, <strong>2011</strong><br />
35,133<br />
United Kingdom 12,264<br />
Romania 6,457<br />
Hungary 5,337<br />
Russia 4,912<br />
Sweden 3,530<br />
Czechia 3,477<br />
Bulgaria 1,999<br />
Spain 1,287<br />
Other2 4,493<br />
1 Figures do not include board members, managing directors, or apprentices.<br />
2 Includes Italy, France, the Netherlands, Poland, and other countries.<br />
Gender and Age Profile, Part-Time Staff<br />
At the end of <strong>2011</strong>, 28 percent of our employees were women,<br />
slightly more than at the end of 2010. The average E.ON<br />
Group employee was 42 years old and had worked for us for<br />
about 14 years. A total of 7,654 E.ON Group employees were<br />
on a part-time schedule, of whom 4,386, or 57 percent, were<br />
women. Employee turnover resulting from voluntary terminations<br />
averaged around 4 percent across the organization.<br />
45
46 Employees<br />
Health and Safety<br />
Occupational safety and health have the highest priority at<br />
E.ON. One of our key performance indicators (“KPIs”) for safety<br />
is the frequency of lost-time injuries per million hours of work<br />
(“LTIF”). In <strong>2011</strong>, we further improved the LTIF of E.ON employees<br />
to 2.1 (prior year: 2.3), continuing the positive trend of<br />
recent years. The LTIF of contractor employees was 3.1 in <strong>2011</strong>.<br />
We intend to further improve our performance here, as well.<br />
Our units’ safety performance is a <strong>com</strong>ponent of the annual<br />
personal performance agreements of the Board of Management<br />
members and executives responsible for these units.<br />
We use KPIs to monitor and continually improve our safety<br />
performance. To ensure continuous improvement, our units<br />
design safety improvement plans based on a management<br />
review of their performance in the prior year. The results of<br />
the implementation of these plans are also used as preventive<br />
performance indicators. Despite all our successes in occupational<br />
safety, it remains our objective to prevent accidents or<br />
other harmful effects on the health of our employees and<br />
contractors.<br />
Compensation, Pension Plans, Employee<br />
Participation<br />
Attractive <strong>com</strong>pensation and appealing fringe benefits are<br />
essential to a <strong>com</strong>petitive work environment. Company contributions<br />
to employee pension plans represent an important<br />
<strong>com</strong>ponent of an employee’s <strong>com</strong>pensation package and have<br />
long had a prominent place in the E.ON Group. They are an<br />
important foundation of employees’ future financial security<br />
and also foster employee retention. E.ON <strong>com</strong>panies supplement<br />
their <strong>com</strong>pany pension plans with attractive programs<br />
to help their employees save for the future. Another factor<br />
in employee retention is enabling them to participate in their<br />
<strong>com</strong>pany’s success. This includes the performance rights<br />
(with a multi-year term) granted to executives under the E.ON<br />
Share Performance Plan. Our employee stock purchase program<br />
remains attractive thanks to a partially tax-free <strong>com</strong>pany<br />
contribution. In <strong>2011</strong>, 18,924 employees purchased a total of<br />
1,210,014 shares of E.ON stock; 55 percent of employees participated<br />
in the program, the same level as in 2010.<br />
Overview of the Compensation Systems for the<br />
Board of Management and Supervisory Board<br />
We have <strong>com</strong>piled a Compensation <strong>Report</strong> for the <strong>2011</strong> financial<br />
year which provides an overview of the <strong>com</strong>pensation<br />
plans for the Board of Management and Supervisory Board<br />
and each board member’s E.ON Group <strong>com</strong>pensation. The<br />
report applies the regulations of the German Commercial Code<br />
amended to reflect the Management Board Compensation<br />
Disclosure Law as well as the principles of the German Corporate<br />
Governance Code. The Compensation <strong>Report</strong>, which is<br />
part of this Combined Group Management <strong>Report</strong>, can be found<br />
on pages 180 to 189.<br />
Apprentice Programs<br />
E.ON has always placed great emphasis on apprentice programs.<br />
In <strong>2011</strong>, apprentices again accounted for about 7 percent<br />
of the E.ON Group’s workforce in Germany. With a new<br />
class of 729 regular apprentices, the E.ON Group had a total<br />
of 2,466 apprentices and work-study students in <strong>2011</strong>. Established<br />
in 2003, the E.ON training initiative to <strong>com</strong>bat youth<br />
unemployment was continued in <strong>2011</strong>. Through the initiative,<br />
we offered more than 900 young people in Germany prospects<br />
for the future through vocational training, an internship to<br />
prepare them for training, and school projects.<br />
Apprentices in Germany<br />
Germany<br />
Dec. 31, <strong>2011</strong><br />
1,551<br />
Generation 522<br />
Gas 197<br />
Group Management/Other11 128<br />
Renewables 68<br />
E.ON Group 2,466<br />
1 Includes E.ON IT Group.
Technology and Innovation<br />
In <strong>2011</strong>, we reconfigured the organizational setup for our<br />
Technology and Innovation (“T&I”) activities. A new department<br />
at Group Management steers our portfolio of activities, monitors<br />
potentially disruptive technologies, and evaluates ideas<br />
for new business models. One of its key tasks is to develop<br />
and manage new businesses until they are handed over to<br />
existing business units or newly created business units. Thirteen<br />
E.ON Innovation Centers, which are embedded in our businesses<br />
and steered by the T&I department at Group Management,<br />
coordinate activities in their respective technology area<br />
across our entire <strong>com</strong>pany:<br />
• Renewables, Hydro<br />
• Combined-Cycle Gas Turbines (“CCGT”), Carbon Capture<br />
and Storage (“CCS”), Nuclear, Steam<br />
• Energy Storage, Distribution, Gas<br />
• Retail, E-Mobility, Smart Homes<br />
• Energy Systems<br />
Two of these technology areas, Energy Storage and Smart<br />
Homes, were added in <strong>2011</strong>. Both were identified as having<br />
significant potential for changes to the <strong>com</strong>petitive landscape,<br />
business-model innovation, and disruptive technologies.<br />
Project Examples from <strong>2011</strong><br />
Energy Storage<br />
We pooled our international expertise for all energy storage<br />
technologies. In Falkenhagen, Germany, we set up our first<br />
power-to-gas pilot project. This procedure uses electrolysis to<br />
transform water into hydrogen, which can be stored in the<br />
natural gas pipeline system.<br />
Smart Homes<br />
In collaboration with technology partners, E.ON established<br />
seven customer test beds in Sweden, the United Kingdom,<br />
and Germany with the aim of entering the smart-home market<br />
in early 2013. In 2012, several hundred E.ON customers across<br />
Europe will test the mass-market potential of smart-home<br />
products and services developed jointly by E.ON <strong>com</strong>panies<br />
and partners such as Deutsche Telekom, Telefunken, GreenwaveReality,<br />
and VS Safety.<br />
CEO Letter<br />
E.ON Stock<br />
Combined Group Management <strong>Report</strong><br />
Consolidated Financial Statements<br />
Corporate Governance <strong>Report</strong><br />
Supervisory Board and Board of Management<br />
Tables and Explanations<br />
Retail<br />
A field test of residential fuel-cell micro CHP achieved 90 percent<br />
availability under realistic daily operating conditions<br />
and achieved the reduction in carbon emissions predicted by<br />
the equipment manufacturer. The EU helps fund the development<br />
of this technology. The project involves the installation<br />
of 100 units in the United Kingdom and Germany using equipment<br />
manufactured by CFCL and Ideal Boilers.<br />
Renewables<br />
Together with partners, we tested methods to reduce underwater<br />
noise during the construction of offshore wind farms.<br />
In Sicily, we set up arrays of high-concentration photovoltaic<br />
(“HCPV”) modules to gain firsthand experience with the installation<br />
and performance of different HCPV concepts. Pelamis,<br />
our wave-power demonstration project in the Orkney Islands,<br />
reached 1,000 hours of operation in <strong>2011</strong> and is expected to<br />
reach 5,000 hours in 2012.<br />
E-Mobility<br />
We launched a range of <strong>com</strong>prehensive, custom-tailored<br />
e-mobility solutions for business, municipal, and residential<br />
costumers. To give inter-city e-mobility users easy access to<br />
charging stations, we set up Germany’s first public direct-current<br />
fast-charge station. We are convinced that this state-ofthe-art<br />
station is a real alternative to at-home charging using<br />
alternating current.<br />
Our long-term goal is to use electric vehicles (“EVs”) as a distributed<br />
energy storage system. Just as we have developed<br />
smart grids that can accept more renewable-source electricity,<br />
we see exciting and sustainable possibilities for EVs. On<br />
breezy nights, EV batteries could store surplus wind power;<br />
during peakload periods of the day, they could feed some<br />
of this power back into the grid. We are working to put this into<br />
action in field trials, such as the one we conducted with VW<br />
with support from Germany’s Ministry of the Environment.<br />
Our experience from numerous EV field trials across Europe has<br />
given us a solid understanding of the technology, products, and<br />
customer services we need to make this a reality in the future.<br />
47
48 Technology and Innovation<br />
Distribution, Smart Grids<br />
The sustainable city project in the Hyllie district of Malmö<br />
received funding from the Swedish Energy Agency, which<br />
called it a flagship project for Northern Europe. Our project<br />
partners are the City of Malmö and real-estate developers.<br />
At our power distributors in Germany, we are conducting five<br />
smart-grid projects focusing on the integration of renewables<br />
into intermediate- and low-voltage grids. Our Group-wide smartmetering<br />
program in the United Kingdom is paving the way<br />
for full-scale rollouts in that country and in Germany. The rollout<br />
is <strong>com</strong>pleted in Sweden and under way in Spain.<br />
Hydro<br />
A small-scale hydro project on the Isar River in southeast<br />
Germany that will use a very-low-head turbine is at an<br />
advanced stage and can be <strong>com</strong>pleted in the next few years.<br />
At our existing run-of-river plants on the Main River, we<br />
developed new procedures for increasing operational flexibility<br />
so that these plants can respond to the increasing<br />
load fluctuations in the power system. We also studied innovative<br />
potential sites (a former chalk mine in northern Germany<br />
and caverns in the Harz Mountains in central Germany) for new<br />
pumped-storage hydro capacity.<br />
CCGT<br />
We conducted research projects whose primary aim is to<br />
increase plant flexibility and reduce emissions at partial loads.<br />
CCS<br />
We successfully tested small-scale pilot carbon-capture plants<br />
at power stations in Staudinger (Germany) and Karlshamn<br />
(Sweden) and started building a large-scale carbon-capture<br />
plant in Wilhelmshaven, Germany. As part of the COORETEC<br />
program in Germany, of which E.ON is a partner, successful test<br />
firing and capture were achieved at a second-generation<br />
carbonate looping plant.<br />
Nuclear<br />
Our research projects focused on optimizing E.ON’s existing<br />
nuclear fleet in several areas (operational support, materials,<br />
fuel, safety, and de<strong>com</strong>missioning). We also ensured that we<br />
observe new developments to identify and evaluate new<br />
nuclear trends (cogeneration, small modular reactors) so that<br />
we can evaluate them.<br />
Steam<br />
To ensure the stable operation of our existing and new-build<br />
plants, we conducted several projects to enhance their operational<br />
flexibility to respond to the increased, fluctuating<br />
feed-in from renewables. We evaluated new <strong>com</strong>ponents to<br />
help minimize the carbon emissions of our existing plants<br />
and will retrofit these <strong>com</strong>ponents in 2012. We also identified<br />
pretreatment technologies that could give us more opportunities<br />
to cofire biomass.<br />
Gas<br />
We launched a project to increase the efficiency of biogas production<br />
by testing innovative membrane technologies for<br />
carbon separation at our biogas plant in Kirchlengern, Germany,<br />
through 2013. We also continued to press for greater harmonization<br />
of gas-quality standards in Europe, with the aim of<br />
maximizing the injection of hydrogen and other renewable<br />
fuels into the gas pipeline system and of helping to remove<br />
barriers to the creation of a single European gas market.<br />
University Support<br />
As one of the world’s largest investor-owned power and gas<br />
<strong>com</strong>panies, we feel it is our responsibility to actively promote<br />
energy research. Our contacts with universities offer students an<br />
opportunity to get to know our <strong>com</strong>pany and the focal points<br />
of our research. E.ON supports a total of more than 20 universities<br />
in Germany, the United Kingdom, Sweden, Denmark,<br />
the Netherlands, France, Spain, Greece, the Czech Republic, the<br />
United States, and Australia. Two main activities are the:<br />
• E.ON Energy Research Center (“ERC”)<br />
• E.ON International Research Initiative<br />
Our flagship project is the ERC, a public-private partnership<br />
with renowned RWTH Aachen University. A key research area is<br />
how to efficiently integrate a large percentage of fluctuating<br />
renewable energy in the electricity system. We are funding the<br />
ERC with €40 million over a period of ten years.
The ERC was founded in 2006. Its mission is to foster major<br />
technological and conceptual breakthroughs that promote an<br />
efficient, sustainable, and climate-friendly energy supply. Its<br />
approach is holistic: instead of looking for solutions to isolated<br />
technical problems, it designs <strong>com</strong>prehensive, interdisciplinary<br />
solutions that address all aspects of <strong>com</strong>plex energy issues.<br />
It has five institutes: Automation of Complex Power Systems,<br />
Energy-Efficient Buildings and Indoor Climate, Future Energy<br />
Consumer Needs and Behavior, Applied Geophysics and Geothermal<br />
Energy, and Power Generation and Storage Systems.<br />
The ERC <strong>com</strong>pleted its ramp-up phase in <strong>2011</strong>, and now more<br />
than 130 employees are carrying out research in renewable<br />
energy and energy efficiency.<br />
In September <strong>2011</strong>, the E.ON International Research Initiative<br />
published its fourth call for outstanding projects from universities<br />
and research institutes from around the world. The topic,<br />
for which awards will be given in 2012, is “Smart Home: A New<br />
Customer Relationship with Energy.” The aim is to better understand<br />
customers’ needs and behavior and the role customers<br />
will play in a future energy system.<br />
The E.ON-funded award has been conferred since 2007. E.ON<br />
has so far invested €18 million in international research projects<br />
in order to find solutions to the challenges of tomorrow’s<br />
energy system. The awards for the previous three research<br />
topics—energy storage, nanotechnology applications in the<br />
CEO Letter<br />
E.ON Stock<br />
Combined Group Management <strong>Report</strong><br />
Consolidated Financial Statements<br />
Corporate Governance <strong>Report</strong><br />
Supervisory Board and Board of Management<br />
Tables and Explanations<br />
energy business, and heat storage for concentrated solar<br />
power—have already delivered results that will help make the<br />
world of energy cleaner and better.<br />
Facts about T&I, Including Research and<br />
Development (“R&D”)<br />
In <strong>2011</strong>, we created a new T&I department at Group Management.<br />
This underscores the importance we place on innovative<br />
energy technology. We increased our R&D activities in <strong>2011</strong>,<br />
despite our difficult business environment.<br />
Our R&D expenditures on technology totaled about €81 million<br />
in <strong>2011</strong> (2010: €61 million). Intangible R&D assets relating to<br />
software development totaled €42 million (2010: €27 million).<br />
In <strong>2011</strong>, 202 employees were directly involved in R&D projects<br />
at E.ON.<br />
In addition to our investments to optimize and refine technologies,<br />
we also actively promote basic research. In <strong>2011</strong>, we<br />
provided €8 million of support to fund and sponsor energy<br />
research at universities and institutes (2010: €6 million).<br />
Our total T&I expenditures (which include support for university<br />
research, technology R&D, demonstration projects)<br />
and software development amounted to €149 million (2010:<br />
€120 million).<br />
Technology and Innovation, Software<br />
Technology<br />
and Innovation Software Total<br />
€ in millions<br />
R&D<br />
<strong>2011</strong> 2010 <strong>2011</strong> 2010 <strong>2011</strong> 2010<br />
Technology 811 61 – – 811 Intangible R&D assets<br />
61<br />
Software<br />
Other<br />
– – 42 27 42 27<br />
Demonstration projects 18 26 – – 18 26<br />
University support 8 6 – – 8 6<br />
Total 107 93 42 27 149 120<br />
1 R&D expenses pursuant to IAS 38 (€59 million; see Note 14 to the Consolidated Financial Statements on page 111) plus other projects that are part of our R&D effort.<br />
49
50<br />
Risk <strong>Report</strong><br />
Risk Management System<br />
Risk Committee<br />
Additional <strong>Report</strong>s on<br />
E.ON Group Financial<br />
Management (including<br />
Liquidity)<br />
Additional Separate<br />
<strong>Report</strong>s on E.ON Group<br />
Commodity and Credit<br />
Risks<br />
Risk Management, Monitoring, and <strong>Report</strong>ing<br />
E.ON AG<br />
Board of Management<br />
Quarterly KonTraG Risk<br />
<strong>Report</strong>ing<br />
Financial Risks<br />
Market Risks<br />
External/Regulatory Risks<br />
Operational Risks<br />
Strategic Risks<br />
Other Risks<br />
Generation Renewables Gas Trading Germany Other<br />
EU Countries<br />
Our risk management system consists of a number of <strong>com</strong>ponents<br />
that are embedded into E.ON’s entire organizational<br />
structure and processes. As a result, our risk management<br />
system is an integral part of our business and decision-making<br />
processes. The key <strong>com</strong>ponents of our risk management system<br />
include our Group-wide guidelines and reporting systems;<br />
our standardized Group-wide strategy, planning, and controlling<br />
processes; Internal Audit activities; the separate Group-wide<br />
risk reporting conducted pursuant to the Corporate Sector Control<br />
and Transparency Act (“KonTraG”); and the establishment<br />
of risk <strong>com</strong>mittees. Our risk management system is designed<br />
Audit <strong>Report</strong><br />
Audits<br />
E.ON AG Supervisory Board<br />
Audit and Risk Committee<br />
Internal Audit<br />
Planning and Controlling<br />
Process<br />
Earnings <strong>Report</strong>/<br />
Medium-Term Planning<br />
Russia Group Management/Other<br />
to enable management to recognize risks early and to take<br />
the necessary countermeasures in a timely manner. We continually<br />
review our Group-wide planning, controlling, and<br />
reporting processes to ensure that they remain effective and<br />
efficient. As required by law, the effectiveness of our risk<br />
management system is reviewed regularly by Internal Audit.
Risk Management and Insurance<br />
E.ON Risk Consulting GmbH, a wholly owned subsidiary of<br />
E.ON AG, is responsible for insurance-risk management in the<br />
E.ON Group. It develops and optimizes solutions for E.ON’s<br />
operating risks by using insurance and insurance-related instruments<br />
and secures the necessary coverage in international<br />
insurance markets. To this end, E.ON Risk Consulting GmbH is,<br />
among other things, responsible for management of client<br />
data and insurance contracts, claims management, the accounting<br />
of risk covering and claims, and all associated reporting.<br />
Risk Committee<br />
In <strong>com</strong>pliance with the provisions of Section 91, Paragraph 2,<br />
of the German Stock Corporation Act relating to the establishment<br />
of a risk-monitoring and early warning system, the<br />
E.ON Group has a Risk Committee. The Risk Committee, which<br />
consists of representatives of key E.ON AG divisions and departments,<br />
is responsible for ensuring that the risk strategy for<br />
<strong>com</strong>modity and credit risks defined by the Board of Management<br />
is implemented, <strong>com</strong>plied with, and further developed.<br />
Risk Situation<br />
In the normal course of business, we are subject to a number<br />
of risks that are inseparably linked to the operation of our<br />
businesses. The E.ON Group, and thus E.ON AG, is exposed to<br />
the following main categories of risk:<br />
Market Risks<br />
Our units operate in an international market environment<br />
that is characterized by general risks relating to the business<br />
cycle. In addition, the entry of new suppliers into the marketplace<br />
along with more aggressive tactics by existing market<br />
participants has created a keener <strong>com</strong>petitive environment<br />
for our electricity business in and outside Germany which could<br />
reduce our margins. Our Gas global unit continues to face<br />
considerable <strong>com</strong>petitive pressure in the gas marketplace. Competition<br />
in the gas market and increasing trading volumes<br />
at virtual trading points and gas exchanges could result in considerable<br />
risks for natural gas purchased under long-term<br />
take-or-pay contracts. In addition, substantial price risks result<br />
CEO Letter<br />
E.ON Stock<br />
Combined Group Management <strong>Report</strong><br />
Consolidated Financial Statements<br />
Corporate Governance <strong>Report</strong><br />
Supervisory Board and Board of Management<br />
Tables and Explanations<br />
from the fact that gas procurement prices are predominantly<br />
indexed to oil prices, whereas sales prices are increasingly<br />
guided by wholesale prices. Generally, contracts between producers<br />
and importers are subject to periodic adjustments to<br />
the current market situation. E.ON Ruhrgas is conducting<br />
intensive negotiations with producers. After unsuccessful negotiations<br />
with Gazprom, E.ON Ruhrgas exercised its contractual<br />
option of opening an arbitration process against Gazprom.<br />
The demand for electric power and natural gas is seasonal,<br />
with our operations generally experiencing higher demand<br />
during the cold-weather months of October through March<br />
and lower demand during the warm-weather months of April<br />
through September. As a result of these seasonal patterns,<br />
our sales and results of operations are higher in the first and<br />
fourth quarters and lower in the second and third quarters.<br />
Sales and results of operations for all of our energy operations<br />
can be negatively affected by periods of unseasonably warm<br />
weather during the autumn and winter months. Our units in<br />
Scandinavia could be negatively affected by a lack of precipitation,<br />
which could lead to a decline in hydroelectric generation.<br />
We expect seasonal and weather-related fluctuations in<br />
sales and results of operations to continue.<br />
We use a <strong>com</strong>prehensive sales management system and<br />
intensive customer management to minimize these risks.<br />
51
52 Risk <strong>Report</strong><br />
Commodity Price Risks<br />
The E.ON Group’s business operations are exposed to <strong>com</strong>modity<br />
price risks. In order to limit our exposure to these risks,<br />
we conduct systematic risk management. The key elements<br />
of our risk management are, in addition to binding Group-wide<br />
guidelines and a Group-wide reporting system, the use of<br />
quantitative key figures, the limitation of risks, and the strict<br />
separation of functions between departments. To limit <strong>com</strong>modity<br />
price risks, we utilize derivative financial instruments<br />
that are <strong>com</strong>monly used in the marketplace. These instruments<br />
are transacted with financial institutions, brokers, power<br />
exchanges, and third parties whose creditworthiness we<br />
monitor on an ongoing basis. The Trading unit aggregates and<br />
consistently manages the price risks we face on Europe’s liquid<br />
<strong>com</strong>modity markets.<br />
We mainly use electricity, gas, coal, carbon allowance, and oil<br />
price hedging transactions to limit our exposure to risks<br />
resulting from price fluctuations, to optimize systems and load<br />
balancing, and to lock in margins. We also engage in proprietary<br />
<strong>com</strong>modity trading in accordance with detailed guidelines<br />
and within narrowly defined limits.<br />
Financial Risks<br />
The international nature of E.ON’s business operations exposes<br />
E.ON to risks from currency fluctuation. One form of this risk<br />
is transaction risk, which occurs when payments are made in<br />
a currency other than E.ON’s functional currency. Another form<br />
of risk is translation risk, which occurs when currency fluctuations<br />
lead to accounting effects when assets/liabilities and<br />
in<strong>com</strong>e/expenses of E.ON <strong>com</strong>panies outside the euro zone are<br />
translated into euros and entered into our Consolidated Financial<br />
Statements. We limit currency risk by conducting systematic<br />
currency management involving derivative and underlying<br />
financial instruments. Currency-translation risk results mainly<br />
from transactions denominated in U.S. dollars, pounds sterling,<br />
Swedish kroner, Norwegian kroner, and Hungarian forints.<br />
E.ON faces earnings risks from financial liabilities, accounts<br />
payable, short-term financing with variable interest rates, and<br />
interest derivatives that are based on variable interest rates.<br />
We also use systematic risk management to manage our<br />
interest-rate and currency risks. Here, E.ON AG plays a central<br />
role by aggregating risk positions through intragroup transactions<br />
and hedging these risks on the market. Due to its intermediary<br />
role, E.ON AG’s risk position is largely closed.<br />
E.ON’s operating activities and use of derivative financial instruments<br />
expose E.ON to credit-default risks. We use a Groupwide<br />
credit risk management system to systematically monitor<br />
the creditworthiness of our business partners on the<br />
basis of Group-wide minimum standards. We manage our creditdefault<br />
risk by taking appropriate measures, which include<br />
obtaining collateral and setting limits. The E.ON Group’s Risk<br />
Committee is regularly informed about all material creditdefault<br />
risks.<br />
E.ON could face liquidity risks due to margin calls resulting<br />
from adverse price developments of derivative financial<br />
instruments.<br />
In addition, E.ON also faces risks from price changes and<br />
losses on the current and non-current investments it makes<br />
to cover its non-current obligations, particularly pension and<br />
asset-retirement obligations. The foundation of our risk management<br />
in this area is a conservative investment strategy<br />
and a broadly diversified portfolio.
Strategic Risks<br />
Our business strategy involves acquisitions and investments<br />
in our core business as well as disposals. This strategy depends<br />
in part on our ability to successfully identify, acquire, and<br />
integrate <strong>com</strong>panies that enhance, on acceptable terms, our<br />
energy business. In order to obtain the necessary approvals<br />
for acquisitions, we may be required to divest other parts of<br />
our business or to make concessions or undertakings that<br />
materially affect our business. In addition, there can be no<br />
assurance that we will be able to achieve the returns we<br />
expect from any acquisition or investment. For example, we<br />
may fail to retain key employees; may be unable to successfully<br />
integrate new businesses with our existing businesses;<br />
may incorrectly judge expected cost savings, operating profits,<br />
or future market trends and regulatory changes; or may spend<br />
more on the acquisition, integration, and operation of new<br />
businesses than anticipated. Furthermore, investments and<br />
acquisitions in new geographic areas or lines of business require<br />
us to be<strong>com</strong>e familiar with new sales markets and <strong>com</strong>petitors<br />
and expose us to <strong>com</strong>mercial and other risks.<br />
We have <strong>com</strong>prehensive processes in place to manage potential<br />
risks relating to acquisitions and investments. These<br />
processes include, in addition to the relevant <strong>com</strong>pany guidelines<br />
and manuals, <strong>com</strong>prehensive due diligence, legally<br />
binding contracts, a multi-stage approvals process, and shareholding<br />
and project controlling. Comprehensive post-acquisition<br />
integration projects also contribute to successful integration.<br />
In the case of planned disposals, E.ON faces the risk, which is<br />
not assessable, of disposals not taking place or being delayed<br />
and the risk that E.ON receives lower-than-anticipated disposal<br />
proceeds. In such projects, it is not possible to determine<br />
the likelihood of these risks. If planned disposals do not take<br />
place or are significantly delayed, this would have a negative<br />
impact on the planned development of our debt factor.<br />
CEO Letter<br />
E.ON Stock<br />
Combined Group Management <strong>Report</strong><br />
Consolidated Financial Statements<br />
Corporate Governance <strong>Report</strong><br />
Supervisory Board and Board of Management<br />
Tables and Explanations<br />
Operational and Environmental Risks<br />
Technologically <strong>com</strong>plex production facilities are used in the<br />
production and distribution of energy. Germany’s Renewable<br />
Energy Law and the transformation of the country’s energy<br />
system are resulting in an increase in decentralized feed-in,<br />
which creates the need for additional expansion of the distribution<br />
network. On a regional level, the increase in decentralized<br />
feed-in (primarily from renewables) has led to a shift<br />
in load flows. In Germany, where power plants are located in<br />
closer proximity to population centers than in many other<br />
countries, the risk of blackouts is lower due to shorter transmission<br />
paths and a strongly meshed network. Nevertheless,<br />
our operations in and outside Germany could experience unanticipated<br />
operational or other problems leading to a power<br />
failure or shutdown. Operational failures or extended production<br />
stoppages of facilities or <strong>com</strong>ponents of facilities, including<br />
new-build projects, could negatively impact our earnings.<br />
We could also be subject to environmental liabilities associated<br />
with our power generation operations that could materially<br />
and adversely affect our business. In addition, new or amended<br />
environmental laws and regulations may result in material<br />
increases in our costs.<br />
Climate change has be<strong>com</strong>e a central risk factor. For example,<br />
E.ON’s operations could be adversely affected by the absence<br />
of precipitation or above-average temperatures that reduce the<br />
cooling efficiency of our generation assets and may make it<br />
necessary to shut them down. Extreme weather or long-term<br />
climatic change could also affect wind power generation.<br />
Alongside risks to our energy production, there are also risks<br />
53
54<br />
Risk <strong>Report</strong><br />
that could lead to the disruption of offsite activities, such as<br />
transportation, <strong>com</strong>munications, water supply, waste removal,<br />
and so forth. Increasingly, our investors and customers expect<br />
us to play an active leadership role in environmental issues<br />
like climate change and water conservation. Our failure to meet<br />
these expectations could increase the risk to our business<br />
by reducing the capital market’s willingness to invest in our<br />
<strong>com</strong>pany and the public’s trust in our brand.<br />
To limit these risks, we will continue to improve our network<br />
management and the optimal dispatch of our generation<br />
assets. At the same time, we are implementing operational<br />
and infrastructure improvements that will enhance the reliability<br />
of our generation assets and our transmission and distribution<br />
networks, even under extraordinarily adverse conditions.<br />
In addition, we have factored the operational and<br />
financial effects of environmental risks into our emergency<br />
plan. They are part of a catalog of crisis and system-failure<br />
scenarios prepared for the Group by our incident and crisis<br />
management team.<br />
The following are among the <strong>com</strong>prehensive measures we<br />
take to address these risks:<br />
• systematic employee training, advanced training, and<br />
qualification programs<br />
• further refinement of our production procedures, processes,<br />
and technologies<br />
• regular facility and network maintenance and inspection<br />
• <strong>com</strong>pany guidelines as well as work and process instructions<br />
• quality management, control, and assurance<br />
• project, environmental, and deterioration management<br />
• crisis-prevention measures and emergency planning.<br />
Should an accident occur despite the measures we take, we<br />
have a reasonable level of insurance coverage.<br />
In addition, there are currently certain risks relating to legal<br />
proceedings resulting from the E.ON Group’s operations. These<br />
in particular include legal actions and proceedings concerning<br />
price increases, alleged market-sharing agreements, and<br />
anti<strong>com</strong>petitive practices. The above-mentioned legal proceedings<br />
include legal actions to demand repayment of the<br />
increase differential in conjunction with court rulings that<br />
certain contractual price-adjustment clauses of years past<br />
are invalid. In July 2010, the Federal Court of Justice issued a<br />
ruling against EWE AG pertaining to the validity of gas-price<br />
adjustments and the legal qualification of uncontested payments.<br />
At this time, we cannot conclusively evaluate this<br />
ruling’s possible consequences for E.ON Group <strong>com</strong>panies, in<br />
part because of inconsistencies in the rulings of different<br />
state superior courts and possible revisions to the Federal<br />
Court of Justice’s ruling.<br />
On July 8, 2009, the European Commission fined E.ON Ruhrgas<br />
and E.ON (as joint debtor) €553 million for an alleged<br />
market-sharing agreement with GdF Suez. In September 2009,<br />
E.ON Ruhrgas and E.ON filed an appeal with the European<br />
Court of First Instance to have the ruling overturned. Filing<br />
an appeal did not suspend the fine, which was paid, by the<br />
deadline, in October 2009. We cannot rule out the possibility<br />
of subsequent lawsuits.<br />
In September <strong>2011</strong>, the European Commission undertook<br />
inspections at the premises of several gas supply <strong>com</strong>panies<br />
in Central and Eastern Europe, including at E.ON Group<br />
<strong>com</strong>panies. The Commission is investigating potential anti<strong>com</strong>petitive<br />
practices by Gazprom, possibly in collusion<br />
with other <strong>com</strong>panies. The Commission points out that the<br />
fact that it carries out such inspections does not mean that<br />
a <strong>com</strong>pany is guilty of anti<strong>com</strong>petitive practices.
E.ON is building a hard-coal-fired power plant in Datteln,<br />
Germany. The plant is designed to have a net electric capacity<br />
of about 1,055 MW. E.ON has invested about €1 billion in the<br />
project so far. The Münster Superior Administrative Court (“SAC”)<br />
issued a decision on September 3, 2009, that declares void<br />
the City of Datteln’s legally binding land-use plan (No. 105 E.ON<br />
Kraftwerk). The SAC criticized errors in judgment and in particular<br />
that the land-use plan did not sufficiently take into consideration<br />
binding state-level planning rules. On March 16,<br />
2010, the Federal Administrative Court in Leipzig upheld the<br />
SAC’s ruling, rendering the ruling legally binding. However,<br />
the SAC’s ruling does not forbid the realization of a hard-coalfired<br />
power plant at the planned site. On March 17, 2010, the<br />
Datteln City Council passed a resolution to begin the process<br />
of designing a project-related legally binding land-use plan.<br />
On December 13, 2010, the Regionalverband Ruhr (“RVR”) passed<br />
a resolution to institute a regional plan-alteration process,<br />
which in May <strong>2011</strong> was confirmed by an expert legal opinion<br />
solicited by the RVR. On June 20, <strong>2011</strong>, the RVR passed a resolution<br />
to continue the regional plan-alteration process. The RVR<br />
conducted the public consultation process through October 31,<br />
<strong>2011</strong>, and is currently evaluating the statements submitted to<br />
it. The new planning process has to address and resolve the<br />
SAC’s objections in order to reestablish a reliable planning<br />
basis for the Datteln power plant. It also has to consider new<br />
court rulings (particularly the Trianel ruling issued by the<br />
SAC on December 1, <strong>2011</strong>) that establish stricter environmental<br />
requirements for the permitting of coal-fired power plants.<br />
In view of the planning processes under way, we currently anticipate<br />
that the Datteln plant will be<strong>com</strong>e operational later<br />
than originally planned. The suits filed by a farmer and the<br />
BUND NRW against the preliminary decision and certain<br />
partial permissions for construction are still pending before<br />
the SAC. Among the questions at issue is the extent of environmental<br />
groups’ title to sue in light of the most recent rulings<br />
in this regard by the Court of Justice of the European Union.<br />
To ensure the supply of district heating and of traction power,<br />
E.ON therefore took the precautionary measure of withdrawing<br />
its notification of the shutdown of Datteln 1 to 3 and Shamrock<br />
CEO Letter<br />
E.ON Stock<br />
Combined Group Management <strong>Report</strong><br />
Consolidated Financial Statements<br />
Corporate Governance <strong>Report</strong><br />
Supervisory Board and Board of Management<br />
Tables and Explanations<br />
power plants effective December 31, 2012. The district governments<br />
in Münster and Arnsberg, which have jurisdiction over<br />
the matter, rejected the withdrawal. As a matter of sound business<br />
practice and to secure the supply of district heating and<br />
of traction power, E.ON filed lawsuits against the Münster and<br />
Arnsberg rulings; the SAC announced that it will issue its<br />
rulings in March 2012. We remain convinced that the new plant<br />
will be successfully <strong>com</strong>pleted. In principle, these types of<br />
risks as well as technology-related risks attend our other power<br />
and gas new-build projects. We strive to identify such risks<br />
early and to minimize them by conducting appropriate project<br />
management.<br />
There are also lawsuits pending against E.ON AG and U.S. subsidiaries<br />
in connection with the disposal of VEBA Electronics<br />
in 2000. In addition, court actions, governmental investigations,<br />
and proceedings, and other claims could be instituted or<br />
asserted in the future against <strong>com</strong>panies of the E.ON Group.<br />
We attempt to minimize the risks of current and future legal<br />
proceedings by managing these proceedings appropriately<br />
and by designing appropriate contracts prior to agreements<br />
being concluded.<br />
E.ON Ruhrgas currently obtains about one fourth of its total<br />
natural gas supply from Russia pursuant to long-term supply<br />
contracts with Gazprom. In addition, E.ON Ruhrgas currently<br />
obtains natural gas from five other supply countries, giving it<br />
one of the most diversified gas procurement portfolios in<br />
Europe. Certain past events in some Eastern European countries<br />
have heightened concerns in parts of Western Europe about<br />
the reliability of Russian gas supplies, even though Russia has<br />
55
56 Risk <strong>Report</strong><br />
always been a very reliable supplier. Economic or political<br />
instability or other disruptive events in any transit country<br />
through which Russian gas must pass before it reaches its<br />
final destination in Western Europe can have a material adverse<br />
effect on the supply of such gas, and all such events are<br />
<strong>com</strong>pletely outside E.ON Ruhrgas’s control. The Nord Stream<br />
pipeline entered service in November <strong>2011</strong>, establishing the<br />
first direct link between Russia’s large gas reserves and Western<br />
European gas markets. Nord Stream will play an important<br />
role in diversifying gas procurement and enhancing Europe’s<br />
supply security.<br />
External Risks<br />
The political, legal, and regulatory environment in which the<br />
E.ON Group does business is also a source of external risks.<br />
Changes to this environment can lead to considerable uncertainty<br />
with regard to planning.<br />
The reactor accident in Fukushima led the political parties in<br />
Germany’s coalition government to reverse their policy<br />
regarding nuclear energy. After extending the operating lives<br />
of nuclear power plants (“NPPs”) in the fall of 2010 in line<br />
with the stipulations of the coalition agreement, the federal<br />
government rescinded the extensions in the thirteenth<br />
amended version of Germany’s Nuclear Energy Act (“the Act”)<br />
and established a number of stricter rules. In addition to<br />
rescinding the eleventh amendment, the newly amended Act<br />
calls for a gradual phaseout of nuclear power by 2022 and for<br />
the seven NPPs that entered service before year-end 1980<br />
(which had been shut down temporarily by the moratorium)<br />
and for Krümmel NPP to be permanently shut down as of<br />
the date the Act took effect. This affected two NPPs for which<br />
E.ON has operational responsibility: Unterweser and Isar 1.<br />
There is a risk that the remaining NPPs may not be able to<br />
make full use of their assigned production volumes before<br />
their respective operating lives expire. E.ON is implementing<br />
the political majority’s decision on an earlier phaseout of<br />
nuclear energy. At the same time, however, E.ON believes that<br />
the nuclear phaseout, under the current legislation, is<br />
irreconcilable with our constitutional right to property and<br />
our constitutional freedom to operate a business. In any case,<br />
such an intervention is unconstitutional unless <strong>com</strong>pensation<br />
is granted for the rights so deprived. Consequently, we<br />
expect appropriate <strong>com</strong>pensation for the billions of euros in<br />
stranded assets created by this decision. In mid-November<br />
<strong>2011</strong>, E.ON filed a constitutional <strong>com</strong>plaint against the thirteenth<br />
amendment of the Act to Germany’s Constitutional<br />
Court in Karls ruhe. The nuclear-fuel tax remains at its original<br />
level after the rescission of operating-life extensions. Even at<br />
the time of the agreement on operating-life extensions, E.ON<br />
believed that the nuclear-fuel tax contravened Germany’s<br />
constitution and European law. Retaining the tax despite the<br />
significant reduction in operating lives raises additional legal<br />
questions. E.ON is therefore instituting administrative proceedings<br />
and taking legal action against the tax. The proceedings<br />
regarding Gundremmingen B and C, Grohnde, Grafenrheinfeld,<br />
Emsland, Brokdorf, and Isar 2 NPPs have already begun.<br />
All court rulings in proceedings instituted by E.ON have suspended<br />
the levying of the tax. However, conclusive court rulings<br />
will not be handed down until some time in the future.<br />
As established in its coalition agreement, the German federal<br />
government lifted the Gorleben moratorium. The study of<br />
the Gorleben site will now continue, albeit with a number of<br />
subsequently stipulated restrictions. In order to be able to<br />
make an initial determination, during the current legislative<br />
period, of whether the Gorleben salt dome is a suitable site,<br />
the Federal Ministry of the Environment intends to conduct a<br />
preliminary safety analysis of Gorleben. At the same time,<br />
the ministry has formed a working group, which includes representatives<br />
of the federal states, that will draft legislation<br />
by mid-2012 that stipulates the search process for a final storage<br />
site. The initial draft legislation is intended to “stipulate<br />
the individual procedural steps for searching for and selecting<br />
a site for the safe storage of heat-generating, radioactive
waste.” The draft legislation mentions Gorleben as a possible<br />
site but does not seem to conclusively clarify what Gorleben’s<br />
status will be in the planned search process for a final storage<br />
site. It is also unclear whether the federal-state working group<br />
will be able to reach a consensus. An updated version of the<br />
initial draft legislation dated February 2, 2012, contains a passage<br />
for amending Section 21b of Germany’s Atomic Energy Act<br />
such that the costs for “conducting a site-selection process<br />
pursuant to the Site Selection Act” are considered a necessary<br />
expense subject to passthrough and thus are to be born by<br />
entities with a disposal obligation. According to a correct (albeit<br />
not undisputed) interpretation of the law, such a passthrough<br />
of costs is unconstitutional as long Gorleben has not been<br />
deemed unsuitable.<br />
On June 22, <strong>2011</strong>, the European Commission issued re<strong>com</strong>mendations<br />
for a directive on energy efficiency. The re<strong>com</strong>mendations<br />
include requiring all energy distributors and all energy<br />
retailers to achieve annual savings of 1.5 percent on the<br />
amount of energy they sell to their customers. The European<br />
legislative process for this directive has just begun. Consequently,<br />
it cannot yet be determined whether such an energysaving<br />
obligation would create risks for E.ON or, if so, what<br />
those risks would be.<br />
In the context of discussions about Europe’s ability to meet<br />
its long-term climate-protection targets in 2050, adjustments<br />
to the emissions-trading directive are under consideration.<br />
They include reducing the number of carbon allowances available<br />
during the next phase (2013–2020) of the EU Emissions<br />
Trading Scheme. Policymakers hope that reducing the number<br />
of allowances will lead to higher carbon prices, which would<br />
create additional incentives for investments in low-carbon generating<br />
capacity. The risks of potentially higher carbon prices<br />
for E.ON’s current fossil-fueled generation portfolio in the EU<br />
can only be assessed when greater clarity exists about the<br />
measures under consideration.<br />
The EU Agency for the Cooperation of Energy Regulators (“ACER”)<br />
issued re<strong>com</strong>mendations for framework guidelines on a<br />
capacity-allocation mechanism and congestion-management<br />
procedures for gas transmission system operators (“TSOs”).<br />
The European Network of Transmission System Operators for<br />
Gas (“ENTSOG”) is tasked with designing network codes that,<br />
CEO Letter<br />
E.ON Stock<br />
Combined Group Management <strong>Report</strong><br />
Consolidated Financial Statements<br />
Corporate Governance <strong>Report</strong><br />
Supervisory Board and Board of Management<br />
Tables and Explanations<br />
through the <strong>com</strong>itology process, will be<strong>com</strong>e legally binding<br />
for Europe’s TSOs. The codes currently being considered refer<br />
to interconnection points between member states and to<br />
interconnection points between different gas TSOs in a single<br />
member state. Market participants had an opportunity to<br />
take part in an official consultation concerning the re<strong>com</strong>mendations,<br />
which may create risks for existing supply contracts<br />
and for intraday flexibility.<br />
E.ON restructured its six regional distribution <strong>com</strong>panies (“RDCs”)<br />
in Germany in 2008. As part of this process, system operations<br />
were reintegrated into the RDCs so that they function as the<br />
distribution system operator. At the same time, generation<br />
and retail operations were transferred to subsidiaries and the<br />
retail subsidiaries placed under central management. The<br />
regulatory agency views RDCs having ownership interests in<br />
the retail subsidiaries as a violation of unbundling requirements.<br />
In early February 2012, the regulatory agency issued<br />
a ruling in the test case against one RDC and E.ON Energie.<br />
The ruling requires the RDC to relinquish its ownership interest<br />
in the management <strong>com</strong>pany and the regional sales subsidiary<br />
within six months of the date the ruling takes effect.<br />
E.ON Energie and the RDC will file an appeal against the ruling.<br />
If, at the end of the multi-year legal process, the agency’s<br />
ruling is deemed legal, the RDCs affected by the ruling would<br />
have to be restructured.<br />
57
58 Risk <strong>Report</strong><br />
Capacity markets will play an important role for E.ON in a number<br />
of the electricity markets where it operates. Russia and<br />
Spain already have capacity markets, and Sweden has a peakload<br />
reserve capacity market. France and Italy have decided to<br />
create capacity markets, and the U.K. government has re<strong>com</strong>mended<br />
taking the same step. Germany is also weighing the<br />
issue. This could result in market-design risks for E.ON, which<br />
could face a <strong>com</strong>petitive disadvantage, particularly if there is<br />
a focus on specific generating technologies or if some existing<br />
assets are not included.<br />
The U.K. government is implementing a number of reforms to<br />
the country’s wholesale power market with the aim of providing<br />
incentives for investments in low-carbon generation and<br />
to maintain a reliable supply of electricity. The introduction<br />
of feed-in tariffs is intended to provide greater certainty of<br />
revenues for new nuclear capacity, new renewables capacity,<br />
and power plants equipped with carbon capture and storage.<br />
The introduction of a capacity market is intended to support<br />
investment in more flexible generating capacity that operates<br />
at lower load factors to help maintain security of supply. It is<br />
anticipated that the drafting of legislation to implement these<br />
reforms will continue in the first half of 2012 and that the<br />
measures will be fully implemented by the end of 2014. These<br />
reforms could affect E.ON’s generation activities in the<br />
United Kingdom.<br />
In view of the current economic and financial crisis in many<br />
EU member states, political and regulatory intervention<br />
(such as additional taxes, price moratoriums, and changes to<br />
support schemes for renewables) is be<strong>com</strong>ing increasingly<br />
apparent. Such intervention could pose a risk to E.ON’s operations<br />
in these countries. In particular, the refinancing situation<br />
of many European countries could have a direct impact on the<br />
E.ON Group’s cost of capital, which could create the risk of<br />
impairment charges.<br />
Further risks could result from the European Commission’s<br />
plans to change the regulation of derivatives traded over the<br />
counter (“OTC”) and possibly to rescind energy-trading <strong>com</strong>panies’<br />
exemption from the Markets in Financial Instruments<br />
Directive (“MiFID”). The Commission is considering introducing<br />
mandatory clearing of energy OTC trades that exceed an<br />
amount that has yet to be determined. This would increase<br />
the margin requirements for such transactions, which could<br />
lead to an increased liquidity risk. It could also have a negative<br />
impact on E.ON’s economic net debt. Rescinding the MiFID<br />
exemption for energy-trading <strong>com</strong>panies would have effects<br />
similar to the regulation of OTC transactions. These changes<br />
could also result in increased capital requirements and disclosure<br />
obligations for E.ON’s energy-trading <strong>com</strong>panies.<br />
Open Grid Europe (“OGE,” formerly E.ON Gastransport) is<br />
supposed to have been subject to incentive-based regulation<br />
since the start of 2010. In mid-<strong>2011</strong>, OGE made available to<br />
the German Federal Network Agency (known by its German<br />
acronym, “BNetzA”) documents the agency will use to set<br />
OGE’s initial revenue cap for the second regulatory period<br />
(2013–2017). We anticipate that the BNetzA’s cost analysis,<br />
including the process of seeking clarifications from OGE, will<br />
last until the summer of 2012. It will be followed by a new<br />
efficiency benchmarking, and a new assigning to groups, of<br />
Germany’s highly heterogeneous gas TSOs. The BNetzA will<br />
derive the revenue caps for 2013–2017 from the individual efficiency<br />
factor it calculates for each TSO. On November 2, <strong>2011</strong>,<br />
the BNetzA announced its decision regarding return on equity,<br />
which will be reduced from the current 9.29 percent to 9.05 percent<br />
for new assets and from 7.56 percent to 7.14 percent for<br />
old assets.
In 2012, Sweden will introduce a new regulatory scheme for<br />
its distribution networks that is intended to provide adequate<br />
returns on network investments. However, there will be an<br />
18-year transition phase during which revenues will initially<br />
be lowered and then gradually raised to the higher target<br />
level. E.ON’s distribution network in Sweden is among those<br />
that will be affected by the transitional phase. E.ON has filed<br />
a lawsuit against the decision to institute a transitional phase.<br />
At the same time, E.ON’s distribution network <strong>com</strong>pany is<br />
studying ways to adjust its cost and revenue basis to respond<br />
to the changes to its regulatory environment.<br />
We try to manage these risks by engaging in an intensive<br />
and constructive dialog with government agencies and<br />
policymakers.<br />
IT Risks<br />
The operational and strategic management of the E.ON Group<br />
relies heavily on <strong>com</strong>plex information technology. We outsourced<br />
our IT infrastructure to an external service provider<br />
in <strong>2011</strong>. Our IT systems are maintained and optimized by<br />
qualified E.ON Group experts, outside experts, and a wide range<br />
of technological security measures. In addition, the E.ON<br />
Group has in place a range of technological and organizational<br />
measures to counter the risk of unauthorized access to data,<br />
the misuse of data, and data loss.<br />
Reputation Risks<br />
Events and discussions regarding nuclear power and energy<br />
prices affect the reputation of all large energy suppliers. This<br />
is particularly the case in Germany, where our brand image<br />
is less positive than in other countries. As a large corporation<br />
whose stock is part of the DAX 30 blue-chip index, E.ON is especially<br />
prominent in Germany and is almost always mentioned<br />
during public discussions of controversial energy-policy issues.<br />
CEO Letter<br />
E.ON Stock<br />
Combined Group Management <strong>Report</strong><br />
Consolidated Financial Statements<br />
Corporate Governance <strong>Report</strong><br />
Supervisory Board and Board of Management<br />
Tables and Explanations<br />
The foundation for earning credibility and an open ear for<br />
our viewpoints is built by <strong>com</strong>municating clearly, seeking out<br />
opportunities for dialog, and engaging with our key stakeholders.<br />
New stakeholder-management processes we initiated<br />
in <strong>2011</strong> will help us achieve these aims. Consistent <strong>com</strong>munications,<br />
enhanced dialog, and good relationships with our<br />
stakeholders are important to us. Today, we pay even more<br />
attention than in the past to environmental, social, and corporate-governance<br />
issues. These efforts support our interactions<br />
with our stakeholders (including investors), our business decisions,<br />
and our public relations. Our objective is to minimize<br />
our reputation risks and garner public support so that we can<br />
continue to operate our business successfully.<br />
Management’s Evaluation of the Risk Situation<br />
In <strong>2011</strong>, the risk situation of the E.ON Group’s operating business<br />
deteriorated slightly <strong>com</strong>pared with year-end 2010. Increasing<br />
gas-market <strong>com</strong>petition and its effect on sales volumes and<br />
prices along with delays in power and gas new-build projects<br />
could also adversely affect our earnings situation. From today’s<br />
perspective, however, we do not perceive any risks in the<br />
future that would threaten the existence of the E.ON Group<br />
or individual segments.<br />
Disclosures on the Internal Control System for the<br />
Accounting Process<br />
Disclosures pursuant to Section 289, Paragraph 5, of the<br />
German Commercial Code, which are part of the Combined<br />
Group Management <strong>Report</strong>, are on pages 199 to 201.<br />
59
60 Forecast<br />
E.ON Group’s Strategic Course in Up<strong>com</strong>ing<br />
Financial Years<br />
Implementing Our Strategy<br />
In the years ahead, we will adjust E.ON’s business portfolio<br />
in line with our strategy of cleaner & better energy. Our main<br />
focus will be on expanding our operations in renewables,<br />
generation outside Europe, and decentralized energy solutions.<br />
These are the areas in which we see significant market opportunities<br />
and can capitalize on our capabilities. We will therefore<br />
direct our new growth investments at these businesses.<br />
In Europe, we will sharpen the focus of our current position.<br />
To achieve this, we will concentrate on activities in which we<br />
can leverage our expertise as well as cross-border and crossbu<br />
siness synergies of scale and scope into attractive returns.<br />
Generation Renewables Optimization<br />
& Trading<br />
Planned Transformation of E.ON AG into a European<br />
Company<br />
The Board of Management intends to propose to the 2012<br />
<strong>Annual</strong> Shareholders Meeting that E.ON AG be transformed<br />
into a European Company (Societas Europaea, or “SE”). The<br />
purpose of the transformation is for E.ON’s internationalization<br />
(more than half of E.ON’s employees work outside Germany)<br />
to be reflected in its governance and in the form of its incorporation.<br />
If the <strong>Annual</strong> Shareholders Meeting approves the<br />
change, E.ON would then work out, between it and its employee<br />
representatives in Europe, an agreement regarding the involvement<br />
of employees. When this step is <strong>com</strong>pleted, the transformation<br />
would take effect, probably at the end of 2012.<br />
Business Environment<br />
External <strong>Report</strong>ing Segmentation 2012<br />
Macroeconomic Situation<br />
The OECD expects the global economy to contract somewhat<br />
in 2012, resulting in a slight recession, but to expand again in<br />
2013. Monetary policy will tend to spur economic activity, fiscal<br />
policy (namely, tighter budgets) to dampen it. Uncertainty<br />
on labor and credit markets will also serve as a brake on the<br />
economy, according to the OECD.<br />
Exploration &<br />
Production<br />
Change in Organizational Structure<br />
As part of our Group-wide E.ON 2.0 program, in the second half<br />
of <strong>2011</strong> we began the process of making far-reaching changes.<br />
This process will continue, and in some cases be <strong>com</strong>pleted,<br />
in 2012. It includes <strong>com</strong>bining, effective January 1, 2012, the<br />
businesses of E.ON Energy Trading and E.ON Ruhrgas to form<br />
a new segment called Optimization & Trading. In addition,<br />
the Exploration & Production unit, part of E.ON Ruhrgas until<br />
the end of <strong>2011</strong>, is now its own segment (see the graphic of<br />
our external reporting segmentation for 2012).<br />
Germany Other EU<br />
Countries<br />
Russia<br />
Economic growth in the United States is expected to accelerate,<br />
due primarily to rising demand for investment goods<br />
and the anticipated end of restrictive fiscal policy.<br />
The euro zone is expected to experience a slight recession in<br />
2012 followed by a moderate recovery. The main brakes on<br />
Europe’s economy are stagnant private consumption (although<br />
this is expected to recover in 2013) and a decline in state<br />
consumption expenditures due to budget tightening. Investment<br />
activity is likely to be weak in the near term.<br />
The economic outlook in the BRICs (Brazil, Russia, India,<br />
China) varies by country. China is expected to benefit from<br />
robust domestic demand but to have weaker net exports.<br />
Brazil’s economy will receive impetus from infrastructure projects,<br />
whereas Russia’s is still highly dependent on oil prices.
Due to lower <strong>com</strong>modity prices and underutilized capacity,<br />
the OECD expects the inflation rate to decline during the<br />
forecast period.<br />
The OECD emphasizes the upside and the downside risks of<br />
its projections. The euro-zone debt crisis and U.S. fiscal policy<br />
are the main sources of uncertainty.<br />
Energy Markets<br />
We expect power and fuel markets to be generally more<br />
volatile in 2012 and 2013 due to their increasing sensitivity to<br />
macroeconomic developments and policy decisions.<br />
The oil market is currently displaying a classic backwardation<br />
pattern, with prices for nearby months higher than prices for<br />
forward months. This trend could continue, since at the moment<br />
the market is increasingly driven by geopolitical events (Iran’s<br />
nuclear program, EU sanctions, the Strait of Hormuz, unrest in<br />
the Middle East and North Africa). The Brent contract for nextmonth<br />
delivery started 2012 at about $112 per barrel, which is<br />
significantly above the price at the start of <strong>2011</strong> ($95).<br />
In <strong>2011</strong>, abundant coal stocks and lower demand due to mild<br />
winter weather were the fundamental factors on Europe’s<br />
coal market as measured by the API#2 index. The price for hard<br />
coal for next-year delivery began 2012 at $116 per metric ton,<br />
the same level as at the start of <strong>2011</strong>. Good availability and<br />
favorable freight rates could send prices lower. The main source<br />
of demand is the Asia-Pacific region, particularly China. Unlike<br />
oil, however, coal displays a contango pattern, with outlying<br />
periods priced higher than nearby periods. Consequently, the<br />
price for delivery in 2014 is currently $121 per metric ton.<br />
In <strong>2011</strong>, wholesale gas prices at Europe’s hubs, both for spot<br />
products and for forward products for delivery in 2012 and<br />
2013, were significantly higher than in the prior year. This is<br />
especially attributable to higher LNG demand in Asian markets,<br />
which was driven by economic growth in non-OECD countries<br />
and the replacement of nuclear capacity by gas-fired<br />
capacity in Japan following Fukushima. Higher oil prices, resulting<br />
in part from political developments in the Middle East<br />
and North Africa, are pushing up the prices of oil-indexed gas<br />
imports to Europe. The forward market shows rising gas prices<br />
in Europe for the next two years. To a significant degree, these<br />
CEO Letter<br />
E.ON Stock<br />
Combined Group Management <strong>Report</strong><br />
Consolidated Financial Statements<br />
Corporate Governance <strong>Report</strong><br />
Supervisory Board and Board of Management<br />
Tables and Explanations<br />
expectations continue to be driven by LNG demand in Asia<br />
and have so far not been shaken by concerns about a collapse<br />
of demand in Europe due to a renewed danger of recession.<br />
U.S. gas prices are expected to remain at low levels due to<br />
the cost-effective extraction of shale gas, despite the apparent<br />
environmental risks of this practice.<br />
Prices for carbon allowances under the EU Emissions Trading<br />
Scheme (known as “EUAs”) fell to record lows in <strong>2011</strong>, primarily<br />
because the weak economy led to lower industrial production<br />
and consequently to lower demand for power, resulting in an<br />
ongoing oversupply of EUAs. In the years ahead, this trend<br />
could be augmented by emission-reduction measures (such as<br />
measures to increase energy efficiency), which would put<br />
further downward pressure on EUA prices. Low EUA prices have<br />
led EU policymakers to consider taking steps (such as a setaside<br />
strategy) to reduce the number of EUAs on the market.<br />
In view of Europe’s lackluster economic situation, however,<br />
such a proposal would probably meet stiff resistance from a<br />
number of member states. More negative news about the<br />
euro zone and the absence of progress in policies to reduce<br />
the number of EUAs could mean that carbon prices reach<br />
new lows in the years ahead.<br />
Near-term and medium-term power prices in Germany will<br />
be determined largely by the price of hard coal, natural gas, and<br />
EUAs and by forecasts on the ratio of supply to demand in<br />
Germany and neighboring countries. However, new capacity,<br />
particularly new renewables capacity, could put further downward<br />
pressure on prices (at the start of 2012, Germany had<br />
24.7 GW of installed solar capacity and 30 GW of installed<br />
wind capacity). This pressure could be increased in the years<br />
ahead by concerns about Europe’s economic outlook and<br />
the con<strong>com</strong>itant lowering of growth expectations for power<br />
consumption. Still, the market’s general expectation is for<br />
forward power prices to remain at roughly the same level over<br />
the next two years due to continued low carbon prices and<br />
moderate coal and gas prices. At the start of 2012, the EEX baseload<br />
contract was trading at about €52 per MWh for 2013<br />
delivery and at €53 for 2014 delivery, similar to the level at the<br />
start of last year.<br />
61
62 Forecast<br />
Our power production for 2012 is already almost <strong>com</strong>pletely<br />
hedged. Our hedging practices will, over time, serve to increase<br />
the hedge rate of subsequent years. As an example, the graph<br />
below shows the hedge rate for our European outright portfolio,<br />
which essentially consists of our non-fossil power production<br />
from nuclear and hydro assets.<br />
European Outright Portfolio<br />
Percentages Range of hedged generation<br />
2012<br />
2013<br />
2014<br />
Employees<br />
0 10 20 30 40 50 60 70 80 90 100<br />
The number of employees in the E.ON Group (excluding apprentices<br />
and board members/managing directors) is expected to<br />
decline by year-end 2012 due to the implementation of E.ON 2.0.<br />
Anticipated Earnings Situation<br />
Forecast Earnings Performance<br />
Our forecast for full-year 2012 earnings is influenced significantly<br />
by the difficult business environment in the energy<br />
industry. It is also based on the following assumptions:<br />
• the absence of an adverse, one-off effect recorded in<br />
<strong>2011</strong> due to the German federal government’s decision<br />
regarding the early shutdown of nuclear power stations<br />
• positive volume and price developments in the Exploration<br />
& Production segment and in Russia<br />
• disposals (among others, Central Networks)<br />
• lower earnings at our generation business.<br />
From today’s perspective, we anticipate that our 2012 EBITDA<br />
will be between €9.6 billion and €10.2 billion.<br />
We expect our 2012 underlying net in<strong>com</strong>e to be in a range<br />
from €2.3 billion to €2.7 billion.<br />
For 2013, we continue to expect EBITDA of €11.6 to €12.3 billion<br />
and underlying net in<strong>com</strong>e of €3.2 to €3.7 billion.<br />
Our forecast by segment:<br />
EBITDA1 € in billions 2012 (forecast) <strong>2011</strong><br />
Generation above prior year 2.114<br />
Renewables below prior year 1.459<br />
Optimization & Trading below prior year 0.160<br />
Exploration & Production above prior year 0.727<br />
Germany at prior year 2.457<br />
Other EU Countries below prior year 2.259<br />
Russia above prior year 0.553<br />
Group Management/Consolidation above prior year -0.436<br />
Total 9.6 to 10.2 9.293<br />
1 Adjusted for extraordinary effects.<br />
We expect Generation’s 2012 EBITDA to surpass the prior-year<br />
figure. Earnings will be positively impacted by the absence of<br />
the adverse, one-off effect recorded in <strong>2011</strong> due to the German<br />
federal government’s decision regarding the early shutdown<br />
of nuclear power stations. The negative factors <strong>com</strong>pared with<br />
<strong>2011</strong> include narrower wholesale margins, higher nuclear-fuel<br />
taxes due to overhaul scheduling, and the absence of earnings<br />
from shut-down nuclear power stations which were operational<br />
in the first quarter of <strong>2011</strong>.
We anticipate Renewables’ earnings will be lower in 2012, in<br />
particular because declining prices for hydroelectricity will<br />
not be offset by increases in installed wind and solar capacity.<br />
Our new Optimization & Trading segment, which <strong>com</strong>bines the<br />
optimization activities of our former Trading and Gas global<br />
units, faces significant margin pressure in both the power and<br />
gas wholesale businesses. On the power side, this is principally<br />
because the internal transfer prices that Optimization &<br />
Trading pays our generation units are declining relative to<br />
<strong>2011</strong> but still high. This factor, along with the low market prices<br />
achievable for external sales, means that we can anticipate<br />
only a limited recovery of power margins, which remain negative.<br />
On the gas side, margins are suffering from the disconnect<br />
between oil-indexed procurement prices and achievable<br />
sale prices on the wholesale market. Consequently, the main<br />
focus is on succeeding in negotiations with producers to achieve<br />
lasting reductions in procurement costs and risks. We expect<br />
earnings at the storage business to be higher due to the <strong>com</strong>missioning<br />
of new capacity. The transport business, however,<br />
will remain under regulatory pressure in 2012. We expect that<br />
earnings at the gas wholesale business will be at the prioryear<br />
level. With these factors in mind, we expect 2012 EBITDA<br />
for Optimization & Trading as a whole to be below the prioryear<br />
figure. It is important to note that the progress of negotiations<br />
with producers could yield additional material opportunities<br />
and risks.<br />
We expect the Exploration & Production segment’s 2012 EBITDA<br />
to surpass the prior-year figure. Its main earnings driver is its<br />
North Sea production, including Skarv field, which is expected<br />
to be<strong>com</strong>e operational around mid-year. Earnings from our<br />
stake in Yuzhno Russkoye gas field in Russia and higher energy<br />
prices will also be positive factors.<br />
CEO Letter<br />
E.ON Stock<br />
Combined Group Management <strong>Report</strong><br />
Consolidated Financial Statements<br />
Corporate Governance <strong>Report</strong><br />
Supervisory Board and Board of Management<br />
Tables and Explanations<br />
We expect the Germany regional unit’s earnings to be at the<br />
prior-year level.<br />
Adjusted for portfolio effects, EBITDA at Other EU Countries<br />
is expected to be below the prior-year figure. The decline is<br />
mainly attributable to higher costs for legally mandated energyefficiency<br />
measures in the United Kingdom.<br />
We expect Russia’s 2012 EBITDA to be above the prior-year<br />
level. The full-year operation of new generating capacity at<br />
Surgut and Yaiva and higher margins at existing capacity will<br />
be positive factors.<br />
We expect 2012 EBITDA in the Group Management/Consolidation<br />
segment to be above the prior-year figure.<br />
Anticipated Dividend Development<br />
Our dividend policy, which calls for a payout ratio of 50 to<br />
60 percent of underlying net in<strong>com</strong>e, will, as a general rule,<br />
remain unchanged. In deviation from this policy, management<br />
is proposing a dividend of €1 per share for the <strong>2011</strong> financial<br />
year. We plan to pay a dividend of €1.10 per share for the 2012<br />
financial year and of at least €1.10 per share for the 2013 financial<br />
year. The payout ratio for these two years would likely<br />
also exceed the above-mentioned range of 50 to 60 percent.<br />
Anticipated Financial Condition<br />
Planned Funding Measures<br />
We expect to have no funding needs in 2012 at the Group level.<br />
We expect to be able to fund our investment expenditures<br />
planned for 2012 and the dividend payout by means of cash<br />
provided by operating activities and proceeds from disposals.<br />
Any peaks in the Group’s funding needs during the course of<br />
the year can be dealt with by issuing <strong>com</strong>mercial paper.<br />
63
64 Forecast<br />
Planned Investments<br />
Our medium-term plan calls for investments of €7 billion in<br />
2012. This figure also does not factor in the announced portfolio<br />
measures. About one fifth of our planned investments<br />
will go towards maintaining our existing assets, the rest towards<br />
expansion or organic growth. The main geographic focus of<br />
our investments will continue to be Germany, where we will<br />
make substantial investments to maintain and expand our<br />
conventional generation portfolio and our power and gas<br />
infrastructure.<br />
Investments: 2012 Plan<br />
€ in billions Percentages<br />
Generation 1.6 23<br />
Renewables 1.6 23<br />
Optimization & Trading 0.6 9<br />
Exploration & Production 0.6 9<br />
Germany 1.1 15<br />
Other EU Countries 1.1 15<br />
Russia 0.4 6<br />
Total 7.0 100<br />
We plan to invest €1.6 billion in 2012 to expand and to replace<br />
and maintain Generation’s portfolio of hard-coal, gas, and<br />
nuclear assets. These plans include fossil new-build projects<br />
(such as Maasvlakte 3 und Datteln 4) and measures to extend<br />
asset operating lives (such as Ratcliffe, a 2 GW hard-coal-fired<br />
power station in the United Kingdom).<br />
We plan to invest about €1.6 billion in our Renewables segment<br />
(E.ON Climate & Renewables and our hydroelectric stations)<br />
in 2012. The main focus will be on offshore wind farms (such<br />
as London Array) and onshore farms in Europe and onshore<br />
farms in the United States.<br />
Optimization & Trading will invest approximately €0.6 billion,<br />
mainly in gas transport and storage infrastructure.<br />
Most of Exploration & Production’s investments of €0.6 billion<br />
will go towards developing gas and oil fields.<br />
Our investments of €1.1 billion at the Germany segment consist<br />
in particular of numerous individual investments to expand<br />
our intermediate- and low-voltage networks, switching equipment,<br />
and metering and control technology as well as other<br />
investments to ensure the reliable and uninterrupted transmission<br />
and distribution of electricity.<br />
About one sixth of our investments are earmarked for the<br />
Other EU Countries segment and will consist primarily of<br />
maintenance investments in our regional energy networks in<br />
Sweden and investments to expand infrastructure in Hungary<br />
and Czechia.<br />
We plan to invest about €0.4 billion in our Russia segment<br />
in 2012, mainly to continue ongoing projects to build new<br />
generating units, particularly at Berezovskaya power station.<br />
The E.ON Group’s planned investments for 2013 total about<br />
€5.7 billion. Our Generation and Other EU Countries segments<br />
will each account for about one fifth of investments. Slightly<br />
more than one quarter will go towards expanding our renewables<br />
operations. The remainder is earmarked, in particular,<br />
for the Germany segment and our power generation business<br />
in Russia.
Opportunities<br />
We conduct a bottom-up process at half-yearly intervals (at<br />
the end of the second and fourth quarters) in which the lead<br />
<strong>com</strong>panies of our units as well as certain E.ON AG departments<br />
follow Group-wide guidelines to identify and report<br />
opportu nities that they deem sufficiently concrete and substantial.<br />
An opportunity is substantial within the meaning of<br />
our guidelines if it could have a significantly positive effect<br />
on the asset, financial, or earnings situation of a unit or one<br />
of its segments.<br />
Changes in our regulatory environment could create opportunities.<br />
Market developments could also have a positive impact<br />
on our business. Such factors include wholesale and retail price<br />
developments and higher customer churn rates.<br />
The internal EU energy market is supposed to be <strong>com</strong>pleted<br />
by 2014 and serve as the first step towards a long-term European<br />
energy strategy. Nevertheless, many member states<br />
pursue their own agenda, aspects of which are not <strong>com</strong>patible<br />
with EU policy objectives. An example of this is the different<br />
approaches member states are taking with regard to capacity<br />
markets. We believe that an interconnected European market<br />
and nationally oriented markets will develop in parallel. This<br />
could lead to a situation in which E.ON, which operates across<br />
Europe, will have to look for opportunities in a fragmented<br />
regulatory environment<br />
Positive developments in foreign-currency rates and market<br />
prices for <strong>com</strong>modities (electricity, natural gas, coal, oil, and<br />
carbon) can create opportunities for our business. These include<br />
the opportunity to procure natural gas under favorable terms<br />
by participating in the gas-release program that ENI of Italy<br />
is required to conduct in the wake of a regulatory decision.<br />
CEO Letter<br />
E.ON Stock<br />
Combined Group Management <strong>Report</strong><br />
Consolidated Financial Statements<br />
Corporate Governance <strong>Report</strong><br />
Supervisory Board and Board of Management<br />
Tables and Explanations<br />
Combining our European trading operations at the start of 2008<br />
enables us to seize opportunities created by the increasing<br />
integration of European power and gas markets and of <strong>com</strong>modity<br />
markets, which are already global in scope. In view of<br />
market developments in the United Kingdom and Continental<br />
Europe, trading at European gas hubs can create additional<br />
sales and procurement opportunities.<br />
In addition, the ongoing optimization of gas transport and<br />
storage rights and of the availability and utilization of our<br />
power and gas facilities (shorter project timelines or shorter<br />
facility outages) could yield additional opportunities.<br />
General Statement on E.ON’s Future Development<br />
To ensure that going forward we continue to have the necessary<br />
earnings strength, we are systematically realigning our<br />
business for the future. We are guided by the four key <strong>com</strong>ponents<br />
of our strategy for cleaner & better energy: focusing<br />
our business in Europe, enhancing our performance by increasing<br />
our efficiency and improving our organizational setup,<br />
optimizing our investment strategy, and achieving selective<br />
growth outside Europe. Policy decisions and massive changes<br />
in our markets are presenting us with unprecedented challenges.<br />
Our clear strategy gives us the answers. We are systematically<br />
reorganizing our business in Europe and in fast-growing<br />
markets elsewhere, achieving substantial cost reductions,<br />
and boosting our performance. Renewables, new markets<br />
like Russia, and gas production will already be mainstays of<br />
our business and earnings by 2013.<br />
This Combined Group Management <strong>Report</strong> contains certain forward-looking statements based on E.ON management’s current assumptions and forecasts and other currently available<br />
information. Various known and unknown risks, uncertainties, and other factors could lead to material differences between E.ON’s actual future results, financial situation, development<br />
or performance and the estimates given here. E.ON assumes no liability whatsoever to update these forward-looking statements or to conform them to future events or developments.<br />
65
66<br />
Consolidated Financial Statements<br />
Independent Auditor’s <strong>Report</strong><br />
To E.ON AG, Düsseldorf<br />
<strong>Report</strong> on the Consolidated Financial Statements<br />
We have audited the ac<strong>com</strong>panying consolidated financial<br />
statements of E.ON AG, Düsseldorf, and its subsidiaries, which<br />
<strong>com</strong>prise the consolidated balance sheets, the consolidated<br />
statements of in<strong>com</strong>e, the consolidated statements of recognized<br />
in<strong>com</strong>e and expenses, the consolidated statements of<br />
cash flows, the statement of changes in equity, and the notes<br />
for the business year from January 1 to December 31, <strong>2011</strong>.<br />
Board of Managing Directors’ Responsibility for the<br />
Consolidated Financial Statements<br />
The Board of Managing Directors of E.ON AG, Düsseldorf, is<br />
responsible for the preparation of these consolidated financial<br />
statements. This responsibility includes that these consolidated<br />
financial statements are prepared in accordance with<br />
International Financial <strong>Report</strong>ing Standards, as adopted by<br />
the EU, and the additional requirements of German <strong>com</strong>mercial<br />
law pursuant to § (Article) 315a Abs. (paragraph) 1 HGB<br />
(“Handelsgesetzbuch”: German Commercial Code) and that<br />
these consolidated financial statements give a true and fair<br />
view of the net assets, financial position and results of operations<br />
of the group in accordance with these requirements.<br />
The Board of Managing Directors is also responsible for the<br />
internal controls as the Board of Managing Directors determines<br />
is necessary to enable the preparation of consolidated<br />
financial statements that are free from material misstatement,<br />
whether due to fraud or error.<br />
Auditor’s Responsibility<br />
Our responsibility is to express an opinion on these consolidated<br />
financial statements based on our audit. We conducted our<br />
audit in accordance with § 317 HGB and German generally<br />
accepted standards for the audit of financial statements promulgated<br />
by the Institut der Wirtschaftsprüfer (Institute of<br />
Public Auditors in Germany) (IDW) and additionally observed<br />
the International Standards on Auditing (ISA). Accordingly,<br />
we are required to <strong>com</strong>ply with ethical requirements and plan<br />
and perform the audit to obtain reasonable assurance about<br />
whether the consolidated financial statements are free from<br />
material misstatement.<br />
An audit involves performing audit procedures to obtain audit<br />
evidence about the amounts and disclosures in the consolidated<br />
financial statements. The selection of audit procedures<br />
depends on the auditor’s professional judgment. This includes<br />
the assessment of the risks of material misstatement of the<br />
consolidated financial statements, whether due to fraud or<br />
error. In assessing those risks, the auditor considers the internal<br />
control system relevant to the entity’s preparation of consolidated<br />
financial statements that give a true and fair view.<br />
The aim of this is to plan and perform audit procedures that<br />
are appropriate in the given circumstances, but not for the<br />
purpose of expressing an opinion on the effectiveness of the<br />
group’s internal control system. An audit also includes evaluating<br />
the appropriateness of accounting policies used and the<br />
reasonableness of accounting estimates made by the Board<br />
of Managing Directors, as well as evaluating the overall presentation<br />
of the consolidated financial statements.<br />
We believe that the audit evidence we have obtained is sufficient<br />
and appropriate to provide a basis for our audit opinion.
Audit Opinion<br />
According to § 322 Abs. 3 Satz (sentence) 1 HGB, we state that<br />
our audit of the consolidated financial statements has not led<br />
to any reservations.<br />
In our opinion based on the findings of our audit, the consolidated<br />
financial statements <strong>com</strong>ply, in all material respects,<br />
with IFRSs, as adopted by the EU, and the additional requirements<br />
of German <strong>com</strong>mercial law pursuant to § 315a Abs. 1 HGB<br />
and give a true and fair view of the net assets and financial<br />
position of the Group as at December 31, <strong>2011</strong> as well as the<br />
results of operations for the business year then ended, in<br />
accordance with these requirements.<br />
<strong>Report</strong> on the Group Management <strong>Report</strong><br />
We have audited the ac<strong>com</strong>panying group management report,<br />
which is <strong>com</strong>bined with the management report of the<br />
<strong>com</strong>pany, of E.ON AG, Düsseldorf, for the business year from<br />
January 1 to December 31, <strong>2011</strong>. The Board of Managing Directors<br />
of E.ON AG, Düsseldorf, is responsible for the preparation<br />
of the <strong>com</strong>bined management report in accordance with the<br />
requirements of German <strong>com</strong>mercial law applicable pursuant<br />
to § 315a Abs. 1 HGB. We conducted our audit in accordance<br />
with § 317 Abs. 2 HGB and German generally accepted standards<br />
for the audit of the <strong>com</strong>bined management report promulgated<br />
by the Institut der Wirtschaftsprüfer (Institute of Public<br />
Auditors in Germany) (IDW). Accordingly, we are required<br />
to plan and perform the audit of the <strong>com</strong>bined management<br />
report to obtain reasonable assurance about whether the<br />
<strong>com</strong>bined management report is consistent with the consolidated<br />
financial statements and the audit findings, as a whole<br />
provides a suitable view of the Group’s position and suitably<br />
presents the opportunities and risks of future development.<br />
CEO Letter<br />
E.ON Stock<br />
Combined Group Management <strong>Report</strong><br />
Consolidated Financial Statements<br />
Corporate Governance <strong>Report</strong><br />
Supervisory Board and Board of Management<br />
Tables and Explanations<br />
According to § 322 Abs. 3 Satz 1 HGB we state, that our audit<br />
of the <strong>com</strong>bined management report has not led to any reservations.<br />
In our opinion based on the findings of our audit of the consolidated<br />
financial statements and <strong>com</strong>bined management<br />
report, the <strong>com</strong>bined management report is consistent with<br />
the consolidated financial statements, as a whole provides<br />
a suitable view of the Group’s position and suitably presents<br />
the opportunities and risks of future development.<br />
Düsseldorf, February 29, 2012<br />
PricewaterhouseCoopers<br />
Aktiengesellschaft<br />
Wirtschaftsprüfungsgesellschaft<br />
Dr. Norbert Schwieters Michael Reuther<br />
Wirtschaftsprüfer Wirtschaftsprüfer<br />
(German Public Auditor) (German Public Auditor)<br />
67
68<br />
E.ON AG and Subsidiaries Consolidated Statements of In<strong>com</strong>e<br />
€ in millions Note <strong>2011</strong> 2010<br />
Sales including electricity and energy taxes 115,046 94,812<br />
Electricity and energy taxes -2,092 -1,949<br />
Sales (5) 112,954 92,863<br />
Changes in inventories (finished goods and work in progress) -16 82<br />
Own work capitalized (6) 519 588<br />
Other operating in<strong>com</strong>e (7) 13,785 15,961<br />
Cost of materials (8) -97,827 -73,575<br />
Personnel costs (11) -5,947 -5,281<br />
Depreciation, amortization and impairment charges (14) -7,081 -6,457<br />
Other operating expenses (7) -17,656 -13,597<br />
In<strong>com</strong>e/Loss (-) from <strong>com</strong>panies accounted for under the equity method 512 663<br />
In<strong>com</strong>e/Loss (-) from continuing operations before financial results and in<strong>com</strong>e taxes -757 11,247<br />
Financial results (9) -2,154 -2,184<br />
In<strong>com</strong>e/Loss (-) from equity investments -60 119<br />
In<strong>com</strong>e from other securities, interest and similar in<strong>com</strong>e 716 653<br />
Interest and similar expenses -2,810 -2,956<br />
In<strong>com</strong>e taxes (10) 1,036 -1,946<br />
In<strong>com</strong>e/Loss (-) from continuing operations -1,875 7,117<br />
In<strong>com</strong>e/Loss (-) from discontinued operations, net (4) 14 -836<br />
Net in<strong>com</strong>e/loss (-) -1,861 6,281<br />
Attributable to shareholders of E.ON AG -2,219 5,853<br />
Attributable to non-controlling interests 358 428<br />
in €<br />
Earnings per share (attributable to shareholders of E.ON AG)—basic and diluted (13)<br />
from continuing operations -1.17 3.51<br />
from discontinued operations 0.01 -0.44<br />
from net in<strong>com</strong>e/loss (-) -1.16 3.07
CEO Letter<br />
E.ON Stock<br />
Combined Group Management <strong>Report</strong><br />
Consolidated Financial Statements<br />
Corporate Governance <strong>Report</strong><br />
Supervisory Board and Board of Management<br />
Tables and Explanations<br />
E.ON AG and Subsidiaries Consolidated Statements of Recognized In<strong>com</strong>e and Expenses<br />
€ in millions <strong>2011</strong> 2010<br />
Net in<strong>com</strong>e/loss (-) -1,861 6,281<br />
Cash flow hedges -143 -1<br />
Unrealized changes -251 -204<br />
Reclassification adjustments recognized in in<strong>com</strong>e 108 203<br />
Available-for-sale securities -1,028 -1,658<br />
Unrealized changes -261 419<br />
Reclassification adjustments recognized in in<strong>com</strong>e -767 -2,077<br />
Currency translation adjustments 344 469<br />
Unrealized changes -232 662<br />
Reclassification adjustments recognized in in<strong>com</strong>e 576 -193<br />
Changes in actuarial gains/losses of defined benefit pension plans and similar obligations -370 -722<br />
Companies accounted for under the equity method -81 -15<br />
Unrealized changes -81 -15<br />
Reclassification adjustments recognized in in<strong>com</strong>e – –<br />
In<strong>com</strong>e taxes 376 324<br />
Total in<strong>com</strong>e and expenses recognized directly in equity -902 -1,603<br />
Total recognized in<strong>com</strong>e and expenses (total <strong>com</strong>prehensive in<strong>com</strong>e) -2,763 4,678<br />
Attributable to shareholders of E.ON AG -3,076 4,248<br />
Attributable to non-controlling interests 313 430<br />
69
70<br />
E.ON AG and Subsidiaries Consolidated Balance Sheets—Assets<br />
€ in millions Note<br />
December 31<br />
<strong>2011</strong> 2010<br />
Goodwill (14) 14,083 14,588<br />
Intangible assets (14) 7,372 8,070<br />
Property, plant and equipment (14) 55,869 60,870<br />
Companies accounted for under the equity method (15) 6,325 6,343<br />
Other financial assets (15) 6,812 6,104<br />
Equity investments 1,908 2,201<br />
Non-current securities 4,904 3,903<br />
Financial receivables and other financial assets (17) 3,619 3,357<br />
Operating receivables and other operating assets (17) 2,842 4,022<br />
In<strong>com</strong>e tax assets (10) 147 822<br />
Deferred tax assets (10) 5,152 2,481<br />
Non-current assets 102,221 106,657<br />
Inventories (16) 4,828 4,064<br />
Financial receivables and other financial assets (17) 1,789 1,674<br />
Trade receivables and other operating assets (17) 31,714 27,492<br />
In<strong>com</strong>e tax assets (10) 4,680 2,678<br />
Liquid funds (18) 7,020 8,273<br />
Securities and fixed-term deposits 3,079 1,697<br />
Restricted cash and cash equivalents 89 433<br />
Cash and cash equivalents 3,852 6,143<br />
Assets held for sale (4) 620 2,043<br />
Current assets 50,651 46,224<br />
Total assets 152,872 152,881
CEO Letter<br />
E.ON Stock<br />
Combined Group Management <strong>Report</strong><br />
Consolidated Financial Statements<br />
Corporate Governance <strong>Report</strong><br />
Supervisory Board and Board of Management<br />
Tables and Explanations<br />
E.ON AG and Subsidiaries Consolidated Balance Sheets—Equity and Liabilities<br />
€ in millions Note<br />
December 31<br />
<strong>2011</strong> 2010<br />
Capital stock (19) 2,001 2,001<br />
Additional paid-in capital (20) 13,747 13,747<br />
Retained earnings (21) 23,796 29,026<br />
Accumulated other <strong>com</strong>prehensive in<strong>com</strong>e (22) -277 410<br />
Treasury shares (19) -3,530 -3,531<br />
Equity attributable to shareholders of E.ON AG 35,737 41,653<br />
Non-controlling interests (before reclassification) 4,484 4,532<br />
Reclassification related to put options -608 -600<br />
Non-controlling interests (23) 3,876 3,932<br />
Equity 39,613 45,585<br />
Financial liabilities (26) 24,029 28,880<br />
Operating liabilities (26) 7,057 6,506<br />
In<strong>com</strong>e taxes (10) 3,585 3,406<br />
Provisions for pensions and similar obligations (24) 3,245 3,250<br />
Miscellaneous provisions (25) 22,427 20,381<br />
Deferred tax liabilities (10) 6,786 7,157<br />
Non-current liabilities 67,129 69,580<br />
Financial liabilities (26) 5,885 3,611<br />
Trade payables and other operating liabilities (26) 30,729 26,357<br />
In<strong>com</strong>e taxes (10) 4,425 2,578<br />
Miscellaneous provisions (25) 4,985 4,950<br />
Liabilities associated with assets held for sale (4) 106 220<br />
Current liabilities 46,130 37,716<br />
Total equity and liabilities 152,872 152,881<br />
71
72<br />
E.ON AG and Subsidiaries Consolidated Statements of Cash Flows<br />
€ in millions <strong>2011</strong> 2010<br />
Net in<strong>com</strong>e/loss (-) -1,861 6,281<br />
In<strong>com</strong>e from discontinued operations, net -14 836<br />
Depreciation, amortization and impairment of intangible assets and of property, plant and equipment 7,081 6,457<br />
Changes in provisions 1,465 968<br />
Changes in deferred taxes -2,040 265<br />
Other non-cash in<strong>com</strong>e and expenses 1,097 347<br />
Gain/Loss on disposal of -717 -3,246<br />
Intangible assets and property, plant and equipment -44 104<br />
Equity investments -599 -3,133<br />
Securities (> 3 months) -74 -217<br />
Changes in operating assets and liabilities and in in<strong>com</strong>e taxes 1,599 -1,294<br />
Inventories -645 342<br />
Trade receivables -2,537 -3,836<br />
Other operating receivables and in<strong>com</strong>e tax assets -2,393 -686<br />
Trade payables -72 -195<br />
Other operating liabilities and in<strong>com</strong>e taxes 7,246 3,081<br />
Cash provided by operating activities of continuing operations (operating cash flow) 6,610 10,614<br />
Cash provided by operating activities of discontinued operations – 471<br />
Cash provided by operating activities 6,610 11,085<br />
Proceeds from disposal of 5,987 9,601<br />
Intangible assets and property, plant and equipment 260 242<br />
Equity investments 5,727 9,359<br />
Purchases of investments in -6,524 -8,286<br />
Intangible assets and property, plant and equipment -6,216 -7,904<br />
Equity investments -308 -382<br />
Proceeds from disposal of securities (> 3 months) and of financial receivables and fixed-term deposits 5,845 6,316<br />
Purchases of securities (> 3 months) and of financial receivables and fixed-term deposits -8,703 -6,247<br />
Changes in restricted cash and cash equivalents 344 -256<br />
Cash provided by (used for) investing activities of continuing operations -3,051 1,128<br />
Cash provided by (used for) investing activities of discontinued operations – -372<br />
Cash provided by (used for) investing activities -3,051 756<br />
Payments received/made from changes in capital 1 -11 -332<br />
Payments for treasury shares, net – -1<br />
Cash dividends paid to shareholders of E.ON AG -2,858 -2,858<br />
Cash dividends paid to non-controlling interests -208 -243<br />
Proceeds from financial liabilities 3,978 2,429<br />
Repayments of financial liabilities -6,736 -8,929<br />
Cash used for financing activities of continuing operations -5,835 -9,934<br />
Cash provided by financing activities of discontinued operations – 10<br />
Cash used for financing activities -5,835 -9,924<br />
Net increase/decrease in cash and cash equivalents -2,276 1,917<br />
Effect of foreign exchange rates on cash and cash equivalents -12 16<br />
Cash and cash equivalents at the beginning of the year 6,143 4,210<br />
Cash and cash equivalents of continuing operations at the end of the year2 3,855 6,143<br />
1 No material netting has taken place in either of the years presented here.<br />
2 Cash and cash equivalents of continuing operations at the end of the year include an amount of €3 million at E.ON Bulgaria, which is reported as a disposal group.
Additional information on the Statements of Cash Flows is provided in Note 29.<br />
CEO Letter<br />
E.ON Stock<br />
Combined Group Management <strong>Report</strong><br />
Consolidated Financial Statements<br />
Corporate Governance <strong>Report</strong><br />
Supervisory Board and Board of Management<br />
Tables and Explanations<br />
Supplementary Information on Cash Flows from Operating Activities<br />
€ in millions <strong>2011</strong> 2010<br />
In<strong>com</strong>e taxes paid (less refunds) -49 -726<br />
Interest paid -1,644 -1,619<br />
Interest received 444 534<br />
Dividends received 710 866<br />
73
74<br />
Statement of Changes in Equity<br />
Changes in accumulated<br />
other <strong>com</strong>prehensive in<strong>com</strong>e<br />
Additional Retained<br />
Currency<br />
translation Available-for- Cash flow<br />
€ in millions Capital stock paid-in capital earnings adjustments sale securities hedges<br />
Balance as of January 1, 2010 2,001 13,747 26,609 -2,005 3,511 46<br />
Change in scope of consolidation<br />
Treasury shares repurchased/sold<br />
Capital increase<br />
Capital decrease<br />
Dividends paid -2,858<br />
Share additions<br />
Net additions/disposals from<br />
reclassification related to<br />
put options<br />
-115<br />
Total <strong>com</strong>prehensive in<strong>com</strong>e 5,390 435 -1,588 11<br />
Net in<strong>com</strong>e/loss (-) 5,853<br />
Other <strong>com</strong>prehensive in<strong>com</strong>e<br />
Changes in actuarial gains/<br />
losses of defined benefit<br />
pension plans and similar<br />
-463 435 -1,588 11<br />
obligations<br />
Changes in accumulated<br />
-463<br />
other <strong>com</strong>prehensive in<strong>com</strong>e 435 -1,588 11<br />
Balance as of December 31, 2010 2,001 13,747 29,026 -1,570 1,923 57<br />
Balance as of January 1, <strong>2011</strong> 2,001 13,747 29,026 -1,570 1,923 57<br />
Change in scope of consolidation<br />
Treasury shares repurchased/sold<br />
Capital increase<br />
Capital decrease<br />
Dividends paid -2,858<br />
Share additions<br />
Net additions/disposals from<br />
reclassification related to<br />
put options<br />
17<br />
Total <strong>com</strong>prehensive in<strong>com</strong>e -2,389 453 -1,028 -112<br />
Net in<strong>com</strong>e/loss (-) -2,219<br />
Other <strong>com</strong>prehensive in<strong>com</strong>e<br />
Changes in actuarial gains/<br />
losses of defined benefit<br />
pension plans and similar<br />
-170 453 -1,028 -112<br />
obligations<br />
Changes in accumulated<br />
-170<br />
other <strong>com</strong>prehensive in<strong>com</strong>e 453 -1,028 -112<br />
Balance as of December 31, <strong>2011</strong> 2,001 13,747 23,796 -1,117 895 -55
CEO Letter<br />
E.ON Stock<br />
Combined Group Management <strong>Report</strong><br />
Consolidated Financial Statements<br />
Corporate Governance <strong>Report</strong><br />
Supervisory Board and Board of Management<br />
Tables and Explanations<br />
Equity<br />
attributable Non-controlling Reclassification<br />
to shareholders interests (before<br />
related to Non-controlling<br />
Treasury shares<br />
of E.ON AG reclassification)<br />
put options<br />
interests Total<br />
-3,530 40,379 4,157 -550 3,607 43,986<br />
147 147 147<br />
-1 -1 -1<br />
68 68 68<br />
-35 -35 -35<br />
-2,858 -223 -223 -3,081<br />
-115 -12 -12 -127<br />
-50 -50 -50<br />
4,248 430 430 4,678<br />
5,853 428 428 6,281<br />
-1,605 2 2 -1,603<br />
-463 -29 -29 -492<br />
-1,142 31 31 -1,111<br />
-3,531 41,653 4,532 -600 3,932 45,585<br />
-3,531 41,653 4,532 -600 3,932 45,585<br />
-110 -110 -110<br />
1 1 1<br />
43 43 43<br />
-41 -41 -41<br />
-2,858 -198 -198 -3,056<br />
17 -55 -55 -38<br />
-8 -8 -8<br />
-3,076 313 313 -2,763<br />
-2,219 358 358 -1,861<br />
-857 -45 -45 -902<br />
-170 -25 -25 -195<br />
-687 -20 -20 -707<br />
-3,530 35,737 4,484 -608 3,876 39,613<br />
75
76 Notes<br />
(1) Summary of Significant Accounting Policies<br />
Basis of Presentation<br />
These Consolidated Financial Statements have been prepared<br />
in accordance with Section 315a (1) of the German Commercial<br />
Code (“HGB”) and with those IFRS and International Financial<br />
<strong>Report</strong>ing Interpretations Committee (“IFRIC”) interpretations<br />
that were adopted by the European Commission for use in<br />
the EU as of the end of the fiscal year, and whose application<br />
was mandatory as of December 31, <strong>2011</strong>.<br />
Principles<br />
The Consolidated Financial Statements are generally prepared<br />
based on historical cost, with the exception of available-forsale<br />
financial assets that are recognized at fair value and of<br />
financial assets and liabilities (including derivative financial<br />
instruments) that must be recognized in in<strong>com</strong>e at fair value.<br />
Scope of Consolidation<br />
The Consolidated Financial Statements incorporate the financial<br />
statements of E.ON AG and entities controlled by E.ON<br />
(“subsidiaries”). Control is achieved when the parent <strong>com</strong>pany<br />
has the power to govern the financial and oper ating policies<br />
of an entity so as to obtain economic benefits from its activities.<br />
In addition, special-purpose entities are con solidated<br />
when the substance of the relationship indicates that the<br />
entity is controlled by E.ON.<br />
The results of the subsidiaries acquired or disposed of during<br />
the year are included in the Consolidated Statement of In<strong>com</strong>e<br />
from the date of acquisition or until the date of their disposal,<br />
respectively.<br />
Where necessary, adjustments are made to the subsidiaries’<br />
financial statements to bring their accounting policies into<br />
line with those of the Group. Inter<strong>com</strong>pany receivables, liabilities<br />
and results between Group <strong>com</strong>panies are eliminated<br />
in the consolidation process.<br />
Associated Companies<br />
An associate is an entity over which E.ON has significant<br />
influence but which is neither a subsidiary nor an interest in a<br />
joint venture. Significant influence is achieved when E.ON<br />
has the power to participate in the financial and operating<br />
policy decisions of the investee but does not control or<br />
jointly control these decisions. Significant influence is generally<br />
presumed if E.ON directly or indirectly holds at least 20 percent,<br />
but less than 50 percent, of an entity’s voting rights.<br />
Interests in associated <strong>com</strong>panies are accounted for under<br />
the equity method. In addition, majority-owned <strong>com</strong>panies in<br />
which E.ON does not exercise control due to restrictions<br />
concerning the control of assets or management are also<br />
generally accounted for under the equity method.<br />
Interests in associated <strong>com</strong>panies accounted for under the<br />
equity method are reported on the balance sheet at cost,<br />
adjusted for changes in the Group’s share of the net assets<br />
after the date of acquisition, as well as any impairment<br />
charges. Losses that might potentially exceed the Group’s interest<br />
in an associated <strong>com</strong>pany when attributable long-term<br />
loans are taken into consideration are not recognized. Any<br />
goodwill resulting from the acquisition of an associated<br />
<strong>com</strong>pany is included in the carrying amount of the investment.<br />
Unrealized gains and losses arising from transactions with<br />
associated <strong>com</strong>panies accounted for under the equity method<br />
are eliminated within the consolidation process on a pro-rata<br />
basis if and insofar as these are material.<br />
Companies accounted for under the equity method are tested<br />
for impairment by <strong>com</strong>paring the carrying amount with its<br />
recoverable amount. If the carrying amount exceeds the recoverable<br />
amount, the carrying amount is adjusted for this<br />
difference. If the reasons for previously recognized impairment<br />
losses no longer exist, such impairment losses are reversed<br />
accordingly.<br />
The financial statements of equity interests accounted for<br />
under the equity method are generally prepared using accounting<br />
that is uniform within the Group.<br />
Joint Ventures<br />
Joint ventures are also accounted for under the equity method.<br />
Unrealized gains and losses arising from transactions with<br />
joint-venture <strong>com</strong>panies are eliminated within the consolidation<br />
process on a pro-rata basis if and insofar as these are material.
Business Combinations<br />
Business <strong>com</strong>binations are accounted for by applying the<br />
purchase method, whereby the purchase price is offset against<br />
the proportional share in the acquired <strong>com</strong>pany’s net assets.<br />
In doing so, the values at the acquisition date that corresponds<br />
to the date at which control of the acquired <strong>com</strong>pany was<br />
attained are used as a basis. The acquiree’s identifiable assets,<br />
liabilities and contingent liabilities are generally recognized<br />
at their fair values irrespective of the extent attributable to<br />
non-controlling interests. The fair values of individual assets<br />
are determined using published exchange or market prices at<br />
the time of acquisition in the case of marketable securities,<br />
for example, and in the case of land, buildings and major technical<br />
equipment, generally using independent expert reports<br />
that have been prepared by third parties. If exchange or market<br />
prices are unavailable for consideration, fair values are<br />
determined using the most reliable information available that<br />
is based on market prices for <strong>com</strong>parable assets or on suitable<br />
valuation techniques. In such cases, E.ON determines fair<br />
value using the discounted cash flow method by discounting<br />
estimated future cash flows by a weighted-average cost of<br />
capital. Estimated cash flows are consistent with the internal<br />
mid-term planning data for the next three years, followed by<br />
two additional years of cash flow projections, which are extrapolated<br />
until the end of an asset’s useful life using a growth rate<br />
based on industry and internal projections. The discount rate<br />
reflects the specific risks inherent in the acquired activities.<br />
Non-controlling interests can be measured either at cost<br />
(partial goodwill method) or at fair value (full goodwill method).<br />
The choice of method can be made on a case-by-case basis.<br />
The partial goodwill method is generally used within the E.ON<br />
Group.<br />
Transactions with holders of non-controlling interests are<br />
treated in the same way as transactions with investors. Should<br />
the acquisition of additional shares in a subsidiary result in<br />
a difference between the cost of purchasing the shares and<br />
the carrying amounts of the non-controlling interests acquired,<br />
that difference must be fully recognized in equity.<br />
CEO Letter<br />
E.ON Stock<br />
Combined Group Management <strong>Report</strong><br />
Consolidated Financial Statements<br />
Corporate Governance <strong>Report</strong><br />
Supervisory Board and Board of Management<br />
Tables and Explanations<br />
Gains and losses from disposals of shares to holders of noncontrolling<br />
interests are also recognized in equity, provided<br />
that such disposals do not result in a loss of control.<br />
Intangible assets must be recognized separately from goodwill<br />
if they are clearly separable or if their recognition arises from<br />
a contractual or other legal right. Provisions for restructuring<br />
measures may not be recorded in a purchase price allocation.<br />
If the purchase price paid exceeds the proportional share in the<br />
net assets at the time of acquisition, the positive difference<br />
is recognized as goodwill. No goodwill is recognized for positive<br />
differences attributable to equity interests that are not<br />
controlled. A negative difference is immediately recognized<br />
in in<strong>com</strong>e.<br />
Foreign Currency Translation<br />
The Company’s transactions denominated in foreign currency<br />
are translated at the current exchange rate at the date of<br />
the transaction. Monetary foreign currency items are adjusted<br />
to the current exchange rate at each balance sheet date; any<br />
gains and losses resulting from fluctuations in the relevant<br />
currencies, and the effects upon realization, are recognized<br />
in in<strong>com</strong>e and reported as other operating in<strong>com</strong>e and other<br />
operating expenses, respectively. Gains and losses from the<br />
translation of non-derivative financial instruments used in<br />
hedges of net investments in foreign operations are recognized<br />
in equity as a <strong>com</strong>ponent of other <strong>com</strong>prehensive in<strong>com</strong>e. The<br />
ineffective portion of the hedging instrument is immediately<br />
recognized in in<strong>com</strong>e.<br />
The functional currency as well as the reporting currency of<br />
E.ON AG is the euro. The assets and liabilities of the Company’s<br />
foreign subsidiaries with a functional currency other than<br />
the euro are translated using the exchange rates applicable<br />
on the balance sheet date, while items of the statements<br />
of in<strong>com</strong>e are translated using annual average exchange rates.<br />
Material transactions of foreign subsidiaries occurring during<br />
the fiscal year are translated in the financial statements using<br />
the exchange rate at the date of the transaction. Differences<br />
arising from the translation of assets and liabilities <strong>com</strong>pared<br />
with the corresponding translation of the prior year, as well<br />
as exchange rate differences between the in<strong>com</strong>e statement<br />
and the balance sheet, are reported separately in equity as<br />
a <strong>com</strong>ponent of other <strong>com</strong>prehensive in<strong>com</strong>e.<br />
77
78 Notes<br />
Foreign currency translation effects that are attributable to<br />
the cost of monetary financial instruments classified as available<br />
for sale are recognized in in<strong>com</strong>e. In the case of fairvalue<br />
adjustments of monetary financial instruments and for<br />
non-monetary financial instruments classified as available<br />
for sale, the foreign currency translation effects are recognized<br />
in equity as a <strong>com</strong>ponent of other <strong>com</strong>prehensive in<strong>com</strong>e.<br />
Foreign-exchange transactions out of the Russian Federation<br />
may be restricted in certain cases.<br />
The following table depicts the movements in exchange rates<br />
for the periods indicated for major currencies of countries<br />
outside the European Monetary Union:<br />
Currencies<br />
ISO<br />
Code<br />
€1, rate at<br />
year-end<br />
€1, annual<br />
average rate<br />
<strong>2011</strong> 2010 <strong>2011</strong> 2010<br />
British pound GBP 0.84 0.86 0.87 0.86<br />
Norwegian krone NOK 7.75 7.80 7.79 8.00<br />
Russian ruble RUB 41.77 40.82 40.88 40.20<br />
Swedish krona SEK 8.91 8.97 9.03 9.54<br />
Hungarian forint HUF 314.58 277.95 279.37 275.48<br />
U.S. dollar USD 1.29 1.34 1.39 1.33<br />
Recognition of In<strong>com</strong>e<br />
a) Revenues<br />
The Company generally recognizes revenue upon delivery<br />
of goods to customers or purchasers, or upon <strong>com</strong>pletion of<br />
services rendered. Delivery is deemed <strong>com</strong>plete when the<br />
risks and rewards associated with ownership have been transferred<br />
to the buyer as contractually agreed, <strong>com</strong>pensation<br />
has been contractually established and collection of the resulting<br />
receivable is probable. Revenues from the sale of goods<br />
and services are measured at the fair value of the consideration<br />
received or receivable. They reflect the value of the volume<br />
supplied, including an estimated value of the volume supplied<br />
to customers between the date of the last invoice and the end<br />
of the period.<br />
Revenues are presented net of sales taxes, returns, rebates<br />
and discounts, and after elimination of intragroup sales.<br />
Revenues are generated primarily from the sale of electricity<br />
and gas to industrial and <strong>com</strong>mercial customers, to retail<br />
customers and to wholesale markets. Also shown in this line<br />
item are revenues earned from the distribution of electricity<br />
and gas, from deliveries of steam, heat and water, as well as<br />
from proprietary trading.<br />
b) Interest In<strong>com</strong>e<br />
Interest in<strong>com</strong>e is recognized pro rata using the effective<br />
interest method.<br />
c) Dividend In<strong>com</strong>e<br />
Dividend in<strong>com</strong>e is recognized when the right to receive the<br />
distribution payment arises.<br />
Electricity and Energy Taxes<br />
The electricity tax is levied on electricity delivered to retail<br />
customers and is calculated on the basis of a fixed tax rate<br />
per kilowatt-hour (“kWh”). This rate varies between different<br />
classes of customers. Electricity and energy taxes paid are<br />
deducted from sales revenues on the face of the in<strong>com</strong>e statement<br />
if those taxes are levied upon delivery of energy to the<br />
retail customer.<br />
Accounting for Sales of Shares of Subsidiaries or<br />
Associated Companies<br />
If a subsidiary or associated <strong>com</strong>pany sells shares to a third<br />
party, leading to a reduction in E.ON’s ownership interest in the<br />
relevant <strong>com</strong>pany (“dilution”), and consequently to a loss of<br />
control, joint control or significant influence, gains and losses<br />
from these dilutive transactions are included in the in<strong>com</strong>e<br />
statement under other operating in<strong>com</strong>e or expenses.<br />
Earnings per Share<br />
Basic (undiluted) earnings per share is <strong>com</strong>puted by dividing<br />
the consolidated net in<strong>com</strong>e attributable to the shareholders<br />
of the parent <strong>com</strong>pany by the weighted-average number of<br />
ordinary shares outstanding during the relevant period. At E.ON,<br />
the <strong>com</strong>putation of diluted earnings per share is identical to<br />
that of basic earnings per share because E.ON AG has issued<br />
no potentially dilutive ordinary shares.<br />
Goodwill and Intangible Assets<br />
Goodwill<br />
According to IFRS 3, “Business Combinations” (“IFRS 3”), goodwill<br />
is not amortized, but rather tested for impairment at<br />
the cash-generating unit level on at least an annual basis.<br />
Impairment tests must also be performed between these<br />
annual tests if events or changes in circumstances indicate<br />
that the carrying amount of the respective cash-generating<br />
unit might not be recoverable.
Newly created goodwill is allocated to those cash-generating<br />
units expected to benefit from the respective business <strong>com</strong>bination.<br />
The cash-generating units to which goodwill is allocated<br />
are generally equivalent to the operating segments, since<br />
goodwill is controlled only at that level. With some exceptions,<br />
goodwill impairment testing is performed in euro, while the<br />
underlying goodwill is always carried in the functional currency.<br />
In a goodwill impairment test, the recoverable amount of a<br />
cash-generating unit is <strong>com</strong>pared with its carrying amount,<br />
including goodwill. The recoverable amount is the higher of<br />
the cash-generating unit’s fair value less costs to sell and its<br />
value in use. In a first step, E.ON determines the recoverable<br />
amount of a cash-generating unit on the basis of the fair value<br />
(less costs to sell) using generally accepted valuation procedures.<br />
This is based on the medium-term planning data of the<br />
respective cash-generating unit. Valuation is performed using<br />
the discounted cash flow method, and accuracy is verified<br />
through the use of appropriate multiples, to the extent available.<br />
In addition, market transactions or valuations prepared<br />
by third parties for <strong>com</strong>parable assets are used to the extent<br />
available. If needed, a calculation of value in use is also performed.<br />
Unlike fair value, the value in use is calculated from<br />
the viewpoint of management. In accordance with IAS 36,<br />
“Impairment of Assets” (“IAS 36”), it is further ensured that<br />
restructuring expenses, as well as initial and subsequent capital<br />
investments (where those have not yet <strong>com</strong>menced), in particular,<br />
are not included in the valuation.<br />
If the carrying amount exceeds the recoverable amount, the<br />
goodwill allocated to that cash-generating unit is adjusted in<br />
the amount of this difference.<br />
If the impairment thus identified exceeds the goodwill allocated<br />
to the affected cash-generating unit, the remaining<br />
assets of the unit must be written down in proportion to their<br />
carrying amounts. Individual assets may be written down<br />
only if their respective carrying amounts do not fall below the<br />
highest of the following values as a result:<br />
• Fair value less costs to sell<br />
• Value in use, or<br />
• Zero.<br />
Any additional impairment loss that would otherwise have<br />
been allocated to the asset concerned must instead be allocated<br />
pro rata to the remaining assets of the unit.<br />
CEO Letter<br />
E.ON Stock<br />
Combined Group Management <strong>Report</strong><br />
Consolidated Financial Statements<br />
Corporate Governance <strong>Report</strong><br />
Supervisory Board and Board of Management<br />
Tables and Explanations<br />
E.ON has elected to perform the annual testing of goodwill<br />
for impairment at the cash-generating unit level in the fourth<br />
quarter of each fiscal year in local currency.<br />
Impairment charges on the goodwill of a cash-generating unit<br />
and reported in the in<strong>com</strong>e statement under “Depreciation,<br />
amortization and impairment charges” may not be reversed<br />
in subsequent reporting periods.<br />
Intangible Assets<br />
IAS 38, “Intangible Assets” (“IAS 38”), requires that intangible<br />
assets be amortized over their expected useful lives unless<br />
their lives are considered to be indefinite.<br />
Acquired intangible assets subject to amortization are classified<br />
as marketing-related, customer-related, contract-based,<br />
and technology-based. Internally generated intangible assets<br />
subject to amortization are related to software. Intangible<br />
assets subject to amortization are measured at cost and useful<br />
lives. The useful lives of marketing-related, customerrelated<br />
and contract-based intangible assets generally range<br />
between 5 and 25 years. Technology-based intangible assets<br />
are generally amortized over a useful life of between 3 and<br />
5 years. This category includes software in particular. Contract-based<br />
intangible assets are amortized in accordance<br />
with the provisions specified in the contracts. Useful lives<br />
and amortization methods are subject to annual verification.<br />
Intangible assets subject to amortization are tested for<br />
impairment whenever events or changes in circumstances<br />
indicate that such assets may be impaired.<br />
Intangible assets not subject to amortization are measured<br />
at cost and tested for impairment annually or more frequently<br />
if events or changes in circumstances indicate that such<br />
assets may be impaired. Moreover, such assets are reviewed<br />
annually to determine whether an assessment of indefinite<br />
useful life remains applicable.<br />
79
80 Notes<br />
In accordance with IAS 36, the carrying amount of an intangible<br />
asset, whether subject to amortization or not, is tested for<br />
impairment by <strong>com</strong>paring the carrying value with the asset’s<br />
recoverable amount, which is the higher of its value in use and<br />
its fair value less costs to sell. Should the carrying amount<br />
exceed the corresponding recoverable amount, an impairment<br />
charge equal to the difference between the carrying amount<br />
and the recoverable amount is recognized and reported in<br />
in<strong>com</strong>e under “Depreciation, amortization and impairment<br />
charges.”<br />
If the reasons for previously recognized impairment losses no<br />
longer exist, such impairment losses are reversed. A reversal<br />
shall not cause the carrying amount of an intangible asset<br />
subject to amortization to exceed the amount that would<br />
have been determined, net of amortization, had no impairment<br />
loss been recognized during the period.<br />
If a recoverable amount cannot be determined for an individual<br />
intangible asset, the recoverable amount for the smallest<br />
identifiable group of assets (cash-generating unit) that the<br />
intangible asset may be assigned to is determined. See Note 14<br />
for additional information about goodwill and intangible assets.<br />
Research and Development Costs<br />
Under IFRS, research and development costs must be allocated<br />
to a research phase and a development phase. While expenditure<br />
on research is expensed as incurred, recognized development<br />
costs must be capitalized as an intangible asset if<br />
all of the general criteria for recognition specified in IAS 38,<br />
as well as certain other specific prerequisites, have been fulfilled.<br />
In the <strong>2011</strong> and 2010 fiscal years, these criteria were not<br />
fulfilled, except in the case of internally generated software.<br />
Emission Rights<br />
Under IFRS, emission rights held under national and international<br />
emission-rights systems for the settlement of obligations<br />
are reported as intangible assets. Because emission rights<br />
are not depleted as part of the production process, they are<br />
reported as intangible assets not subject to amortization.<br />
Emission rights are capitalized at cost when issued for the<br />
respective reporting period as (partial) fulfillment of the<br />
notice of allocation from the responsible national authorities,<br />
or upon acquisition.<br />
A provision is recognized for emissions produced. The provision<br />
is measured at the carrying amount of the emission rights<br />
held or, in the case of a shortfall, at the current fair value of the<br />
emission rights needed. The expenses incurred for the recognition<br />
of the provision are reported under cost of materials.<br />
As part of operating activities, emission rights are also held<br />
for proprietary trading purposes. Emission rights held for<br />
proprietary trading are reported under other operating assets<br />
and measured at the lower of cost or fair value.<br />
Property, Plant and Equipment<br />
Property, plant and equipment are initially measured at acquisition<br />
or production cost, including de<strong>com</strong>missioning or restoration<br />
cost that must be capitalized, and are depreciated<br />
over the expected useful lives of the <strong>com</strong>ponents, generally<br />
using the straight-line method, unless a different method of<br />
depreciation is deemed more suitable in certain exceptional<br />
cases. The useful lives of the major <strong>com</strong>ponents of property,<br />
plant and equipment are presented below:<br />
Useful Lives of Property, Plant and<br />
Equipment<br />
Buildings 10 to 50 years<br />
Technical equipment, plant and machinery<br />
Other equipment, fixtures, furniture and<br />
10 to 65 years<br />
office equipment 3 to 25 years<br />
Property, plant and equipment are tested for impairment<br />
whenever events or changes in circumstances indicate that an<br />
asset may be impaired. In such a case, property, plant and<br />
equipment are tested for impairment according to the principles<br />
prescribed for intangible assets in IAS 36. If an impairment<br />
loss is determined, the remaining useful life of the asset<br />
might also be subject to adjustment, where applicable. If the<br />
reasons for previously recognized impairment losses no longer<br />
exist, such impairment losses are reversed and recognized in<br />
in<strong>com</strong>e. Such reversal shall not cause the carrying amount to<br />
exceed the amount that would have resulted had no impairment<br />
taken place during the preceding periods.<br />
Investment subsidies do not reduce the acquisition and<br />
production costs of the respective assets; they are instead<br />
reported on the balance sheet as deferred in<strong>com</strong>e.
Subsequent costs arising, for example, from additional or<br />
replacement capital expenditure are only recognized as part<br />
of the acquisition or production cost of the asset, or else—if<br />
relevant—recognized as a separate asset if it is probable that<br />
the Group will receive a future economic benefit and the cost<br />
can be determined reliably.<br />
Repair and maintenance costs that do not constitute significant<br />
replacement capital expenditure are expensed as incurred.<br />
Exploration for and Evaluation of Mineral Resources<br />
The exploration and field development expenditures of the Gas<br />
global unit are accounted for using the so-called “successful<br />
efforts method.” In accordance with IFRS 6, “Exploration for and<br />
Evaluation of Mineral Resources” (“IFRS 6”), expenditures for<br />
exploratory drilling for which the out<strong>com</strong>e is not yet certain<br />
are initially capitalized as an intangible asset.<br />
Upon discovery of oil and/or gas reserves and field development<br />
approval, the relevant expenditures are reclassified as<br />
property, plant and equipment. Such property, plant and<br />
equipment is then depreciated in accordance with production<br />
volumes. For uneconomical drilling, the previously capitalized<br />
expenditures are immediately expensed. Other capitalized<br />
expenditures are also written off once it is determined that<br />
no viable reserves could be found. Other expenses for geological<br />
and geophysical work (seismology) and licensing fees<br />
are immediately expensed.<br />
Borrowing Costs<br />
Borrowing costs that arise in connection with the acquisition,<br />
construction or production of a qualifying asset from the<br />
time of acquisition or from the beginning of construction or<br />
production until its entry into service are capitalized and<br />
subsequently amortized alongside the related asset. In the<br />
case of a specific financing arrangement, the respective<br />
specific borrowing costs for that arrangement are used. For<br />
non-specific financing arrangements, a financing rate uniform<br />
within the Group of 5.0 percent was applied for <strong>2011</strong><br />
(2010: 4.5 percent). Other borrowing costs are expensed.<br />
CEO Letter<br />
E.ON Stock<br />
Combined Group Management <strong>Report</strong><br />
Consolidated Financial Statements<br />
Corporate Governance <strong>Report</strong><br />
Supervisory Board and Board of Management<br />
Tables and Explanations<br />
Government Grants<br />
Government investment subsidies do not reduce the acquisition<br />
and production costs of the respective assets; they are<br />
instead reported on the balance sheet as deferred in<strong>com</strong>e.<br />
They are recognized in in<strong>com</strong>e on a straight-line basis over<br />
the associated asset’s expected useful life.<br />
Government grants are recognized at fair value if it is highly<br />
probable that the grant will be issued and if the Group satisfies<br />
the necessary conditions for receipt of the grant.<br />
Government grants for costs are posted as in<strong>com</strong>e over the<br />
period in which the costs to be <strong>com</strong>pensated through the<br />
respective grants are incurred.<br />
Leasing<br />
Leasing transactions are classified according to the lease<br />
agreements and to the underlying risks and rewards specified<br />
therein in line with IAS 17, “Leases” (“IAS 17”). In addition,<br />
IFRIC 4, “Determining Whether an Arrangement Contains a<br />
Lease” (“IFRIC 4”), further defines the criteria as to whether<br />
an agreement that conveys a right to use an asset meets the<br />
definition of a lease. Certain purchase and supply contracts<br />
in the electricity and gas business as well as certain rights of<br />
use may be classified as leases if the criteria are met. E.ON<br />
is party to some agreements in which it is the lessor and to<br />
others in which it is the lessee.<br />
Leasing transactions in which E.ON is the lessee are classified<br />
either as finance leases or operating leases. If the Company<br />
bears substantially all of the risks and rewards incident to ownership<br />
of the leased property, the lease is classified as a finance<br />
lease. Accordingly, the Company recognizes on its balance<br />
sheet the asset and the associated liability in equal amounts.<br />
81
82 Notes<br />
Recognition takes place at the beginning of the lease term<br />
at the lower of the fair value of the leased property or the<br />
present value of the minimum lease payments.<br />
The leased property is depreciated over its useful economic<br />
life or, if it is shorter, the term of the lease. The liability is subsequently<br />
measured using the effective interest method.<br />
All other transactions in which E.ON is the lessee are classified<br />
as operating leases. Payments made under operating leases<br />
are generally expensed over the term of the lease.<br />
Leasing transactions in which E.ON is the lessor and substantially<br />
all the risks and rewards incident to ownership of the<br />
leased property are transferred to the lessee are classified as<br />
finance leases. In this type of lease, E.ON records the present<br />
value of the minimum lease payments as a receivable. Payments<br />
by the lessee are apportioned between a reduction of the<br />
lease receivable and interest in<strong>com</strong>e. The in<strong>com</strong>e from such<br />
arrangements is recognized over the term of the lease using<br />
the effective interest method.<br />
All other transactions in which E.ON is the lessor are treated<br />
as operating leases. E.ON retains the leased property on its<br />
balance sheet as an asset, and the lease payments are generally<br />
recorded on a straight-line basis as in<strong>com</strong>e over the term<br />
of the lease.<br />
Financial Instruments<br />
Non-Derivative Financial Instruments<br />
Non-derivative financial instruments are recognized at fair<br />
value on the settlement date when acquired. Unconsolidated<br />
equity investments and securities are measured in accordance<br />
with IAS 39, “Financial Instruments: Recognition and Measurement”<br />
(“IAS 39”). E.ON categorizes financial assets as held for<br />
trading, available for sale, or as loans and receivables. Management<br />
determines the categorization of the financial assets<br />
at initial recognition.<br />
Securities categorized as available for sale are carried at fair<br />
value on a continuing basis, with any resulting unrealized<br />
gains and losses, net of related deferred taxes, reported as a<br />
<strong>com</strong>ponent of equity (other <strong>com</strong>prehensive in<strong>com</strong>e) until<br />
realized. Realized gains and losses are determined by analyzing<br />
each transaction individually. If there is objective evidence of<br />
impairment, any unrealized gains and losses previously recognized<br />
in other <strong>com</strong>prehensive in<strong>com</strong>e are instead recognized<br />
in financial results. When estimating a possible impairment<br />
loss, E.ON takes into consideration all available information,<br />
such as market conditions and the length and extent of the<br />
impairment. If the value on the balance sheet date of the equity<br />
instruments classified as available for sale and of similar<br />
long-term investments is more than 20 percent below their<br />
cost, or if the value has, on average, been more than ten percent<br />
below its cost for a period of more than twelve months,<br />
this constitutes objective evidence of impairment. For debt<br />
instruments, objective evidence of impairment is deemed present<br />
if ratings have deteriorated from investment-grade to<br />
non-investment-grade. Reversals of impairment losses relating<br />
to equity instruments are recognized exclusively in equity,<br />
while reversals relating to debt instruments are recognized<br />
entirely in in<strong>com</strong>e.<br />
Loans and receivables (including trade receivables) are nonderivative<br />
financial assets with fixed or determinable payments<br />
that are not traded in an active market. Loans and receivables<br />
are reported on the balance sheet under “Receivables and<br />
other assets.” They are subsequently measured at amortized<br />
cost. Valuation allowances are provided for identifiable individual<br />
risks.<br />
Non-derivative financial liabilities (including trade payables)<br />
within the scope of IAS 39 are measured at amortized cost,<br />
using the effective interest method. Initial measurement takes<br />
place at fair value, with transaction costs included in the measurement.<br />
In subsequent periods, the amortization and accretion<br />
of any premium or discount is included in financial results.<br />
Derivative Financial Instruments and Hedging<br />
Transactions<br />
Derivative financial instruments and separated embedded<br />
derivatives are measured at fair value as of the trade date at<br />
initial recognition and in subsequent periods. IAS 39 requires<br />
that they be categorized as held for trading as long as they are<br />
not a <strong>com</strong>ponent of a hedge accounting relationship. Gains<br />
and losses from changes in fair value are immediately recognized<br />
in net in<strong>com</strong>e.
Instruments <strong>com</strong>monly used are foreign currency forwards<br />
and swaps, as well as interest rate swaps, cross-currency swaps<br />
and interest rate options. In <strong>com</strong>modities, the instruments<br />
used include physically and financially settled forwards and<br />
options related to electricity, gas, coal, oil and emission rights.<br />
As part of conducting operations in <strong>com</strong>modities, derivatives<br />
are also acquired for proprietary trading purposes.<br />
IAS 39 sets requirements for the designation and documentation<br />
of hedging relationships, the hedging strategy, as well<br />
as ongoing retrospective and prospective measurement of<br />
effectiveness in order to qualify for hedge accounting. The Company<br />
does not exclude any <strong>com</strong>ponent of derivative gains<br />
and losses from the measurement of hedge effectiveness. Hedge<br />
accounting is considered to be appropriate if the assessment<br />
of hedge effectiveness indicates that the change in fair value<br />
of the designated hedging instrument is 80 to 125 percent<br />
effective at offsetting the change in fair value due to the hedged<br />
risk of the hedged item or transaction.<br />
For qualifying fair value hedges, the change in the fair value of<br />
the derivative and the change in the fair value of the hedged<br />
item that is due to the hedged risk(s) are recognized in in<strong>com</strong>e.<br />
If a derivative instrument qualifies as a cash flow hedge under<br />
IAS 39, the effective portion of the hedging instrument’s change<br />
in fair value is recognized in equity (as a <strong>com</strong>ponent of other<br />
<strong>com</strong>prehensive in<strong>com</strong>e) and reclassified into in<strong>com</strong>e in the<br />
period or periods during which the cash flows of the transaction<br />
being hedged affect in<strong>com</strong>e. The hedging result is reclassified<br />
into in<strong>com</strong>e imme diately if it be<strong>com</strong>es probable that the<br />
hedged underlying transaction will no longer occur. For hedging<br />
instruments used to establish cash flow hedges, the change<br />
in fair value of the ineffective portion is recognized immediately<br />
in the in<strong>com</strong>e statement to the extent required. To hedge<br />
the foreign currency risk arising from the Company’s net investment<br />
in foreign operations, derivative as well as non-derivative<br />
financial instruments are used. Gains or losses due to changes<br />
in fair value and from foreign currency trans lation are recognized<br />
separately within equity, as a <strong>com</strong>ponent of other <strong>com</strong>prehensive<br />
in<strong>com</strong>e, under currency translation adjustments.<br />
Changes in fair value of derivative instruments that must be<br />
recognized in in<strong>com</strong>e are presented as other operating in<strong>com</strong>e<br />
or expenses. Gains and losses from interest-rate derivatives<br />
are netted for each contract and included in interest in<strong>com</strong>e.<br />
CEO Letter<br />
E.ON Stock<br />
Combined Group Management <strong>Report</strong><br />
Consolidated Financial Statements<br />
Corporate Governance <strong>Report</strong><br />
Supervisory Board and Board of Management<br />
Tables and Explanations<br />
Gains and losses from derivative proprietary trading instruments<br />
are shown net as either revenues or cost of materials.<br />
Certain realized amounts are, if related to the sale of products<br />
or services, also included in sales or cost of materials.<br />
Unrealized gains and losses resulting from the initial measurement<br />
of derivative financial instruments at the inception of<br />
the contract are not recognized in in<strong>com</strong>e. They are instead<br />
deferred and recognized in in<strong>com</strong>e systematically over the<br />
term of the derivative. An exception to the accrual principle<br />
applies if unrealized gains and losses from the initial measurement<br />
are verified by quoted market prices, observable prices<br />
of other current market transactions or other observable data<br />
supporting the valuation technique. In this case the gains and<br />
losses are recognized in in<strong>com</strong>e.<br />
Contracts that are entered into for purposes of receiving or<br />
delivering non-financial items in accordance with E.ON’s anticipated<br />
procurement, sale or use requirements, and held as<br />
such, qualify as own-use contracts. They are not accounted for as<br />
derivative financial instruments at fair value in accordance with<br />
IAS 39, but as open transactions subject to the rules of IAS 37.<br />
IFRS 7, “Financial Instruments: Disclosures” (“IFRS 7”), requires<br />
<strong>com</strong>prehensive quantitative and qualitative disclosures<br />
about the extent of risks arising from financial instruments.<br />
Additional information on financial instruments is provided<br />
in Notes 30 and 31.<br />
Inventories<br />
The Company measures inventories at the lower of acquisition<br />
or production cost and net realizable value. The cost of raw<br />
materials, finished products and goods purchased for resale is<br />
determined based on the average cost method. In addition<br />
to production materials and wages, production costs include<br />
material and production overheads based on normal capacity.<br />
The costs of general administration are not capitalized. Inventory<br />
risks resulting from excess and obsolescence are provided<br />
for using appropriate valuation allowances, whereby inventories<br />
are written down to net realizable value.<br />
83
84 Notes<br />
Receivables and Other Assets<br />
Receivables and other assets are initially measured at fair<br />
value, which generally approximates nominal value. They are<br />
subsequently measured at amortized cost, using the effective<br />
interest method. Valuation allowances, included in the reported<br />
net carrying amount, are provided for identifiable individual<br />
risks. If the loss of a certain part of the receivables is probable,<br />
valuation allowances are provided to cover the expected loss.<br />
Liquid Funds<br />
Liquid funds include current available-for-sale securities, checks,<br />
cash on hand and bank balances. Bank balances and availablefor-sale<br />
securities with an original maturity of more than three<br />
months are recognized under securities and fixed-term<br />
deposits. Liquid funds with an original maturity of less than<br />
three months are considered to be cash and cash equivalents,<br />
unless they are restricted.<br />
Restricted cash with a remaining maturity in excess of<br />
twelve months is classified as financial receivables and other<br />
financial assets.<br />
Assets Held for Sale and Liabilities Associated with<br />
Assets Held for Sale<br />
Individual non-current assets or groups of assets held for<br />
sale and any directly attributable liabilities (disposal groups)<br />
are reported in these line items if they can be disposed of<br />
in their current condition and if there is sufficient probability<br />
of their disposal actually taking place. For a group of assets<br />
and associated liabilities to be classified as a disposal group,<br />
the assets and liabilities in it must be held for sale in a single<br />
transaction or as part of a <strong>com</strong>prehensive plan.<br />
Discontinued operations are <strong>com</strong>ponents of an entity that<br />
are either held for sale or have already been sold and can be<br />
clearly distinguished from other corporate operations, both<br />
operationally and for financial reporting purposes. Additionally,<br />
the <strong>com</strong>ponent classified as a discontinued operation must<br />
represent a major business line or a specific geographic business<br />
segment of the Group.<br />
Non-current assets that are held for sale either individually<br />
or collectively as part of a disposal group, or that belong to<br />
a discontinued operation, are no longer depreciated. They are<br />
instead accounted for at the lower of the carrying amount<br />
and the fair value less any remaining costs to sell. If the fair<br />
value is less than the carrying amount, an impairment loss<br />
is recognized.<br />
The in<strong>com</strong>e and losses resulting from the measurement of<br />
<strong>com</strong>ponents held for sale at fair value less any remaining<br />
costs to sell, as well as the gains and losses arising from the<br />
disposal of discontinued operations, are reported separately<br />
on the face of the in<strong>com</strong>e statement under in<strong>com</strong>e/loss from<br />
discontinued operations, net, as is the in<strong>com</strong>e from the ordinary<br />
operating activities of these divisions. Prior-year in<strong>com</strong>e<br />
statement figures are adjusted accordingly. The relevant assets<br />
and liabilities are reported in a separate line on the balance<br />
sheet. The cash flows of discontinued operations are reported<br />
separately in the cash flow statement, with prior-year figures<br />
adjusted accordingly. However, there is no reclassification<br />
of prior-year balance sheet line items attributable to discontinued<br />
operations.<br />
Equity Instruments<br />
IFRS defines equity as the residual interest in the Group’s<br />
assets after deducting all liabilities. Therefore, equity is the<br />
net amount of all recognized assets and liabilities.<br />
E.ON has entered into purchase <strong>com</strong>mitments to holders of<br />
non-controlling interests in subsidiaries. By means of these<br />
agreements, the non-controlling shareholders have the right<br />
to require E.ON to purchase their shares on specified conditions.<br />
None of the contractual obli gations has led to the transfer<br />
of substantially all of the risk and rewards to E.ON at the<br />
time of entering into the contract. In such a case, IAS 32,<br />
“Financial Instruments: Presentation” (“IAS 32”), requires that<br />
a liability be recognized at the present value of the probable
future exercise price. This amount is reclassified from a separate<br />
<strong>com</strong>ponent within non-controlling interests and reported<br />
separately as a liability. The reclassification occurs irrespective<br />
of the probability of exercise. The accretion of the liability<br />
is recognized as interest expense. If a purchase <strong>com</strong>mitment<br />
expires unexercised, the liability reverts to non-controlling<br />
interests. Any difference between liabilities and non-controlling<br />
interests is recognized directly in retained earnings.<br />
Where shareholders of entities own statutory, non-excludable<br />
rights of termination (as in the case of German partnerships,<br />
for example), such termination rights require the reclassification<br />
of non-controlling interests from equity into liabilities<br />
under IAS 32. The liability is recognized at the present value<br />
of the expected settlement amount irrespective of the probability<br />
of termination. Changes in the value of the liability are<br />
reported within other oper ating in<strong>com</strong>e. Accretion of the<br />
liability and the non-controlling shareholders’ share in net<br />
in<strong>com</strong>e are shown as interest expense.<br />
If an E.ON Group <strong>com</strong>pany buys treasury shares of E.ON AG,<br />
the value of the consideration paid, including directly attributable<br />
additional costs (net after in<strong>com</strong>e taxes), is deducted<br />
from E.ON AG’s equity until the shares are retired, distributed<br />
or resold. If such treasury shares are subsequently distributed<br />
or sold, the consideration received, net of any directly attributable<br />
additional transaction costs and associated in<strong>com</strong>e taxes,<br />
is added to E.ON AG’s equity.<br />
Share-Based Payment<br />
Share-based payment plans issued in the E.ON Group are<br />
accounted for in accordance with IFRS 2, “Share-Based Payment”<br />
(“IFRS 2”). The E.ON Share Performance Plan introduced in<br />
fiscal 2006 involves share-based payment transactions that are<br />
settled in cash and measured at fair value as of each balance<br />
sheet date. E.ON determines the fair value of the fifth tranche<br />
using the Monte Carlo simulation technique. From the sixth<br />
tranche forward, the 60-day average of the E. ON share price<br />
as of the balance sheet date is used as the fair value. In addition,<br />
the calculation of the provision for the sixth tranche takes<br />
into account the financial measures ROACE and WACC. The<br />
<strong>com</strong>pensation expense is recognized in the in<strong>com</strong>e statement<br />
pro rata over the vesting period.<br />
CEO Letter<br />
E.ON Stock<br />
Combined Group Management <strong>Report</strong><br />
Consolidated Financial Statements<br />
Corporate Governance <strong>Report</strong><br />
Supervisory Board and Board of Management<br />
Tables and Explanations<br />
Provisions for Pensions and Similar Obligations<br />
The valuation of defined benefit obligations in accordance<br />
with IAS 19, “Employee Benefits” (“IAS 19”), is based on actuarial<br />
<strong>com</strong>putations using the projected unit credit method,<br />
with actuarial valuations performed at year-end. The valuation<br />
en<strong>com</strong>passes both pension obligations and pension entitlements<br />
that are known on the balance sheet date, as well as<br />
economic trend assumptions made in order to reflect realistic<br />
expectations.<br />
Actuarial gains and losses that may arise from differences<br />
between the estimated and actual number of beneficiaries and<br />
from differences between the estimated and actual underlying<br />
assumptions are recognized in full in the period in which<br />
they occur. Such gains and losses are not reported within the<br />
Consolidated Statements of In<strong>com</strong>e but rather are recognized<br />
within the Statements of Recognized In<strong>com</strong>e and Expenses<br />
as part of equity.<br />
The employer service cost representing the additional benefits<br />
that employees earned under the benefit plan during the<br />
fiscal year is reported under personnel costs; interest cost<br />
and expected return on plan assets are reported under financial<br />
results.<br />
Unrecognized past service cost is recognized immediately to<br />
the extent that the benefits are already vested or else amortized<br />
on a straight-line basis over the average period until the<br />
benefits be<strong>com</strong>e vested.<br />
The amount reported on the balance sheet represents the<br />
present value of the defined benefit obligations adjusted for<br />
unrecognized past service cost and reduced by the fair value<br />
of plan assets. If a net asset position arises from this calculation,<br />
the amount is limited to the as yet unrecognized past<br />
service cost plus the present value of available refunds and of<br />
the reduction in future contributions and to the benefit from<br />
prepayments of minimum funding requirements.<br />
85
86 Notes<br />
Payments for defined contribution pension plans are expensed<br />
as incurred and reported under personnel costs. Contributions<br />
to government pension plans are treated like payments for<br />
defined contribution pension plans to the extent that the obligations<br />
under these pension plans generally correspond to<br />
those under defined contribution pension plans.<br />
Provisions for Asset Retirement Obligations and<br />
Other Miscellaneous Provisions<br />
In accordance with IAS 37, “Provisions, Contingent Liabilities<br />
and Contingent Assets” (“IAS 37”), provisions are recognized<br />
when E.ON has a legal or constructive present obligation<br />
towards third parties as a result of a past event, it is probable<br />
that E.ON will be required to settle the obligation, and a reliable<br />
estimate can be made of the amount of the obligation. The<br />
provision is recognized at the expected settlement amount.<br />
Long-term obligations are reported as liabilities at the present<br />
value of their expected settlement amounts if the interest<br />
rate effect (the difference between present value and repayment<br />
amount) resulting from discounting is material; future<br />
cost increases that are foreseeable and likely to occur on the<br />
balance sheet date must also be included in the measurement.<br />
Long-term obligations are discounted at the market interest<br />
rate applicable as of the respective balance sheet date. The<br />
accretion amounts and the effects of changes in interest rates<br />
are generally presented as part of financial results. A reimbursement<br />
related to the provision that is virtually certain to<br />
be collected is capitalized as a separate asset. No offsetting<br />
within provisions is permitted. Advance payments remitted are<br />
deducted from the provisions.<br />
Obligations arising from the de<strong>com</strong>missioning or dismantling<br />
of property, plant and equipment are recognized during<br />
the period of their occurrence at their discounted settlement<br />
amounts, provided that the obligation can be reliably estimated.<br />
The carrying amounts of the respective property, plant and<br />
equipment are increased by the same amounts. In subsequent<br />
periods, capitalized asset retirement costs are amortized<br />
over the expected remaining useful lives of the assets, and the<br />
provision is accreted to its present value on an annual basis.<br />
Changes in estimates arise in particular from deviations from<br />
original cost estimates, from changes to the maturity or<br />
the scope of the relevant obligation, and also as a result of the<br />
regular adjustment of the discount rate to current market<br />
interest rates. The adjustment of provisions for the de<strong>com</strong>missioning<br />
and restoration of property, plant and equipment<br />
for changes to estimates is generally recognized by way of<br />
a corresponding adjustment to these assets, with no effect on<br />
in<strong>com</strong>e. If the property, plant and equipment to be de<strong>com</strong>missioned<br />
have already been fully depreciated, changes to<br />
estimates are recognized within the in<strong>com</strong>e statement.<br />
The estimates for non-contractual nuclear de<strong>com</strong>missioning<br />
provisions are based on external studies and are continuously<br />
updated.<br />
Under Swedish law, E.ON Sverige AB (“E.ON Sverige”) is<br />
required to pay fees to the Swedish Nuclear Waste Fund. The<br />
Swedish Radiation Safety Authority proposes the fees for<br />
the disposal of high-level radioactive waste and nuclear power<br />
plant de<strong>com</strong>missioning based on the amount of electricity<br />
produced at that particular nuclear power plant. The proposed<br />
fees are then submitted to government offices for approval.<br />
Upon approval, E.ON Sverige makes the corresponding payments.<br />
In accordance with IFRIC 5, “Rights to Interests Arising<br />
from De<strong>com</strong>missioning, Restoration and Environmental<br />
Rehabilitation Funds” (“IFRIC 5”), payments into the Swedish<br />
national fund for nuclear waste management are offset by a<br />
right of reimbursement of asset retirement obligations, which<br />
is recognized as an asset under “Other assets.” In accordance<br />
with customary procedure in Sweden, the provisions are discounted<br />
at the real interest rate.<br />
No provisions are established for contingent asset retirement<br />
obligations where the type, scope, timing and associated<br />
probabilities can not be determined reliably.<br />
If onerous contracts exist in which the unavoidable costs of<br />
meeting a contractual obligation exceed the economic benefits<br />
expected to be received under the contract, provisions are<br />
established for losses from open transactions. Such provisions<br />
are recognized at the lower of the excess obligation upon<br />
performance under the contract and any potential penalties<br />
or <strong>com</strong>pensation arising in the event of non-performance.<br />
Obligations under an open contractual relationship are determined<br />
from a customer perspective.
Contingent liabilities are possible obligations toward third<br />
parties arising from past events that are not wholly within the<br />
control of the entity, or else present obligations toward third<br />
parties arising from past events in which an outflow of<br />
resources embodying economic benefits is not probable or<br />
where the amount of the obligation cannot be measured<br />
with sufficient reliability. Contingent liabilities are generally<br />
not recognized on the balance sheet.<br />
Where necessary, provisions for restructuring costs are recognized<br />
at the present value of the future outflows of resources.<br />
Provisions are recognized once a detailed restructuring plan<br />
has been decided on by management and <strong>com</strong>municated to<br />
the employees or their representatives. Only those expenses<br />
that are directly attributable to the restructuring measures<br />
are used in measuring the amount of the provision. Expenses<br />
associated with the future operation are not taken into consideration.<br />
In<strong>com</strong>e Taxes<br />
Under IAS 12, “In<strong>com</strong>e Taxes” (“IAS 12”), deferred taxes are recognized<br />
on temporary differences arising between the carrying<br />
amounts of assets and liabilities on the balance sheet and their<br />
tax bases (balance sheet liability method). Deferred tax assets<br />
and liabilities are recognized for temporary differences that<br />
will result in taxable or deductible amounts when taxable<br />
in<strong>com</strong>e is calculated for future periods, unless those differences<br />
are the result of the initial recognition of an asset or liability<br />
in a transaction other than a business <strong>com</strong>bination that, at the<br />
time of the transaction, affects neither accounting nor taxable<br />
profit/loss. IAS 12 further requires that deferred tax assets be<br />
recognized for unused tax loss carry forwards and unused tax<br />
credits. Deferred tax assets are recognized to the extent that<br />
it is probable that taxable profit will be available against<br />
which the deductible temporary differences and unused tax<br />
losses can be utilized. Each of the corporate entities is assessed<br />
individually with regard to the probability of a positive tax<br />
result in future years. Any existing history of losses is incorporated<br />
in this assessment. For those tax assets to which these<br />
assumptions do not apply, the value of the deferred tax assets<br />
is reduced.<br />
CEO Letter<br />
E.ON Stock<br />
Combined Group Management <strong>Report</strong><br />
Consolidated Financial Statements<br />
Corporate Governance <strong>Report</strong><br />
Supervisory Board and Board of Management<br />
Tables and Explanations<br />
Deferred tax liabilities caused by temporary differences associated<br />
with investments in affiliated and associated <strong>com</strong>panies<br />
are recognized unless the timing of the reversal of such<br />
temporary differences can be controlled within the Group<br />
and it is probable that, owing to this control, the differences<br />
will in fact not be reversed in the foreseeable future.<br />
Deferred tax assets and liabilities are measured using the<br />
enacted or substantively enacted tax rates expected to be<br />
applicable for taxable in<strong>com</strong>e in the years in which temporary<br />
differences are expected to be recovered or settled. The<br />
effect on deferred tax assets and liabilities of changes in tax<br />
rates and tax law is generally recognized in in<strong>com</strong>e. Equity<br />
is adjusted for deferred taxes that had previously been recognized<br />
directly in equity.<br />
Deferred taxes for domestic <strong>com</strong>panies are calculated using<br />
a total tax rate of 30 percent (2010: 30 percent). This tax rate<br />
includes, in addition to the 15 percent (2010: 15 percent)<br />
corporate in<strong>com</strong>e tax, the solidarity surcharge of 5.5 percent<br />
on the corporate tax (2010: 5.5 percent on the corporate tax),<br />
and the average trade tax rate of 14 percent (2010: 14 percent)<br />
applicable to the E.ON Group. Foreign subsidiaries use applicable<br />
national tax rates.<br />
Note 10 shows the major temporary differences so recorded.<br />
Consolidated Statements of Cash Flows<br />
In accordance with IAS 7, “Cash Flow Statements” (“IAS 7”),<br />
the Consolidated Statements of Cash Flows are classified<br />
by operating, investing and financing activities. Cash flows<br />
from discontinued operations are reported separately in<br />
the Consolidated Statement of Cash Flows. Interest received<br />
and paid, in<strong>com</strong>e taxes paid and refunded, as well as dividends<br />
received are classified as operating cash flows, whereas dividends<br />
paid are classified as financing cash flows. The purchase<br />
and sale prices respectively paid (received) in acquisitions<br />
and disposals of <strong>com</strong>panies are reported net of any cash and<br />
87
88 Notes<br />
cash equivalents acquired (disposed of) under investing activities<br />
if the respective acquisition or disposal results in a gain<br />
or loss of control. In the case of acquisitions and disposals that<br />
do not, respectively, result in a gain or loss of control, the corresponding<br />
cash flows are reported under financing activities.<br />
The impact on cash and cash equivalents of valuation changes<br />
due to exchange rate fluctuations is disclosed separately.<br />
Segment Information<br />
In accordance with the so-called management approach<br />
required by IFRS 8, the internal reporting organization used by<br />
management for making decisions on operating matters is<br />
used to identify the Company’s reportable segments. The internal<br />
performance measure used as the segment result is earnings<br />
before interest, taxes, depreciation and amortization<br />
(“EBITDA”) adjusted to exclude certain extraordinary effects<br />
(see Note 33).<br />
Structure of the Consolidated Balance Sheets and<br />
Statements of In<strong>com</strong>e<br />
In accordance with IAS 1, “Presentation of Financial Statements”<br />
(“IAS 1”), the Consolidated Balance Sheets have been prepared<br />
using a classified balance sheet structure. Assets that will be<br />
realized within twelve months of the reporting date, as well<br />
as liabilities that are due to be settled within one year of the<br />
reporting date are generally classified as current.<br />
The Consolidated Statements of In<strong>com</strong>e are classified using<br />
the nature of expense method, which is also applied for<br />
internal purposes.<br />
Capital Structure Management<br />
E.ON uses the debt factor as the measure for the management<br />
of its capital structure. The debt factor is defined as the ratio<br />
of economic net debt to our EBITDA. Economic net debt supplements<br />
net financial position with provisions for pensions and<br />
asset retirement obligations, as well as the net market values<br />
of currency derivatives from financial trans actions (not including<br />
transactions relating to E.ON’s operating business and asset<br />
management). The medium-term target set by E.ON for its<br />
debt factor is a value of less than 3, based on E. ON’s target<br />
rating of solid single A.<br />
Based on our EBITDA in <strong>2011</strong> of €9,293 million (2010: €13,346 million)<br />
and economic net debt of €36,385 million as of the balance<br />
sheet date (2010: €37,701 million), the debt factor is 3.9<br />
(2010: 2.8). Adjusted for the mostly non-cash non-recurring<br />
effects from the early nuclear power exit, the debt factor as<br />
of year-end <strong>2011</strong> is 3.4.<br />
Critical Accounting Estimates and Assumptions;<br />
Critical Judgments in the Application of Accounting<br />
Policies<br />
The preparation of the Consolidated Financial Statements<br />
requires management to make estimates and assumptions<br />
that may influence the application of accounting principles<br />
within the Group and affect the measurement and presentation<br />
of reported figures. Estimates are based on past experience<br />
and on additional knowledge obtained on transactions to<br />
be reported. Actual amounts may differ from these estimates.<br />
The estimates and underlying assumptions are reviewed on<br />
an ongoing basis. Adjustments to accounting estimates are<br />
recognized in the period in which the estimate is revised if the<br />
change affects only that period, or in the period of the revision<br />
and subsequent periods if both current and future periods<br />
are affected.<br />
Estimates are particularly necessary for the measurement of<br />
the value of property, plant and equipment and of intangible<br />
assets, especially in connection with purchase price allocations,<br />
the recognition and measurement of deferred tax assets,<br />
the accounting treatment of provisions for pensions and miscellaneous<br />
provisions, for impairment testing in accordance<br />
with IAS 36, as well as for the determination of the fair value<br />
of certain financial instruments.<br />
The underlying principles used for estimates in each of the<br />
relevant topics are outlined in the respective sections.
(2) New Standards and Interpretations<br />
Standards and Interpretations Applicable in <strong>2011</strong><br />
The International Accounting Standards Board (“IASB”) and the<br />
International Financial <strong>Report</strong>ing Interpretations Committee<br />
(“IFRIC”) have issued the following standards and interpretations<br />
that have been transferred by the EU into European law<br />
and whose application is mandatory in the reporting period<br />
from January 1, <strong>2011</strong>, through December 31, <strong>2011</strong>:<br />
IAS 24, “Related Party Disclosures”<br />
In November 2009, the IASB issued a revised version of IAS 24<br />
“Related Party Disclosures” (“IAS 24”). In particular, the revisions<br />
clarify the definition of a “related party” and simplify the disclosure<br />
requirements for entities deemed related by virtue<br />
of being controlled or significantly influenced by a particular<br />
government. Revised IAS 24 has been transferred by the EU<br />
into European law and its application is thus mandatory for<br />
fiscal years beginning on or after January 1, <strong>2011</strong>. Revised<br />
IAS 24 will have no material impact on E.ON’s Consolidated<br />
Financial Statements.<br />
Omnibus Standard to Amend Multiple International<br />
Financial <strong>Report</strong>ing Standards<br />
In the context of its <strong>Annual</strong> Improvements Process, the IASB<br />
revises existing standards. In May 2010, the IASB published a<br />
corresponding omnibus standard, the third issued under this<br />
process. It contains changes to IFRS and their associated<br />
Bases for Conclusions. The omnibus standard has been transferred<br />
by the EU into European law. The endorsement has<br />
resulted in two different first-time application dates. The amendments<br />
are to be applied either for fiscal years beginning on<br />
or after July 1, 2010, or for those beginning on or after January 1,<br />
<strong>2011</strong>. There are no material changes for E.ON arising from the<br />
omnibus standard.<br />
CEO Letter<br />
E.ON Stock<br />
Combined Group Management <strong>Report</strong><br />
Consolidated Financial Statements<br />
Corporate Governance <strong>Report</strong><br />
Supervisory Board and Board of Management<br />
Tables and Explanations<br />
Amendments to IFRS 1, “First-time Adoption of<br />
International Financial <strong>Report</strong>ing Standards,” and<br />
to IFRS 7, “Financial Instruments: Disclosures”<br />
In January 2010, the IASB issued amendments to IFRS 1, “Firsttime<br />
Adoption of International Financial <strong>Report</strong>ing Standards”<br />
(“IFRS 1”), and to IFRS 7, “Financial Instruments: Disclosures”<br />
(“IFRS 7”). The effect of amending the standards is that entities<br />
applying IFRS for the first time are now relieved from having<br />
to provide the <strong>com</strong>parative disclosures for fair-value measurement<br />
and for liquidity risk. The exemption applies in cases<br />
where the <strong>com</strong>parison periods end before December 31, 2009.<br />
The amendment has been transferred by the EU into European<br />
law and thus it is to be applied for fiscal years beginning<br />
on or after July 1, 2010. The standards thus amended have no<br />
impact on E.ON’s Consolidated Financial Statements as they<br />
are already prepared in accordance with IFRS.<br />
Amendment to IAS 32, “Financial Instruments:<br />
Presentation”—Classification of Rights Issues<br />
In October 2009, the IASB issued an amendment to IAS 32,<br />
“Financial Instruments: Presentation” (“IAS 32”), regulating in<br />
particular the classification of rights issues. This new amendment<br />
requires that certain subscription rights, options and<br />
warrants that are denominated in a foreign currency be recognized<br />
as equity by the issuer of the equity instruments to<br />
which the rights refer, rather than as a derivative liability, as<br />
was past practice. The amendment is to be applied for fiscal<br />
years beginning on or after February 1, 2010. Earlier application<br />
is permitted. The amendment has been transferred by the<br />
EU into European law. It will have no impact on E.ON’s Consolidated<br />
Financial Statements.<br />
Amendments to IFRIC 14—Prepayments of a<br />
Minimum Funding Requirement<br />
In November 2009, “Prepayments of a Minimum Funding<br />
Requirement,” an amendment to IFRIC 14, was published. The<br />
amendment relates to entities that are subject to minimum<br />
funding requirements and make prepayments of contributions.<br />
89
90 Notes<br />
According to the amendment, such an entity is now permitted<br />
to present the benefit of such a prepayment as an asset where<br />
applicable. The amendment has been transferred by the EU<br />
into European law and thus it is to be applied for fiscal years<br />
beginning on or after January 1, <strong>2011</strong>. This will have no impact<br />
on E.ON’s Consolidated Financial Statements.<br />
IFRIC 19, “Extinguishing Financial Liabilities with<br />
Equity Instruments”<br />
IFRIC 19, “Extinguishing Financial Liabilities with Equity Instruments”<br />
(“IFRIC 19”), was published in November 2009. IFRIC 19<br />
clarifies the accounting treatment of financial liabilities that<br />
are settled through the transfer of equity instruments. The<br />
financial instruments issued are deemed part of the “consideration<br />
paid” as defined by IAS 39.41. The borrower must therefore<br />
fully or partially derecognize the liability. Any difference<br />
between the carrying amount of the financial liability thus<br />
(partially) extinguished and the initial measurement amount<br />
of the equity instruments issued is recognized in in<strong>com</strong>e.<br />
IFRIC 19 is effective for fiscal years beginning on or after July 1,<br />
2010. The new interpretation has been transferred by the<br />
EU into European law. IFRIC 19 has no impact on E.ON’s Consolidated<br />
Financial Statements.<br />
Standards and Interpretations Not Yet Applicable<br />
in <strong>2011</strong><br />
The IASB and the IFRIC have issued the following additional<br />
standards and interpretations. These standards and interpretations<br />
are not being applied by E.ON in the <strong>2011</strong> fiscal year<br />
because adoption by the EU remains outstanding at this time<br />
for some of them, or because their application is not yet<br />
mandatory:<br />
IFRS 9, “Financial Instruments”<br />
In November 2009, the IASB issued the new standard IFRS 9,<br />
“Financial Instruments” (“IFRS 9”). Under IFRS 9, all financial<br />
instruments currently within the scope of IAS 39 will henceforth<br />
be subdivided into only two classifications: financial<br />
instruments measured at amortized cost and financial instruments<br />
measured at fair value. In October 2010, the IASB issued<br />
an extended version of IFRS 9. This version contains additional<br />
requirements for the accounting of financial liabilities. The<br />
application of IFRS 9 was to be mandatory for fiscal years<br />
beginning on or after January 1, 2013. In December <strong>2011</strong>, however,<br />
the IASB published an amendment deferring mandatory<br />
first-time application to fiscal years beginning on or after<br />
January 1, 2015. Earlier application is permitted. The IASB also<br />
amended IFRS 7 in the context of such early application:<br />
depending on the actual date on which an entity initially applied<br />
IFRS 9, there are different requirements regarding the presentation<br />
of a <strong>com</strong>parative period and the associated disclosures<br />
in the notes. The standard has not yet been transferred by the<br />
EU into European law. E.ON is currently evaluating the impact<br />
on its Consolidated Financial Statements.<br />
IFRS 10, “Consolidated Financial Statements”<br />
In May <strong>2011</strong>, the IASB issued the new standard IFRS 10, “Consolidated<br />
Financial Statements” (“IFRS 10”). This IFRS replaces<br />
the existing guidance on control and consolidation contained<br />
in IAS 27, “Consolidated and Separate Financial Statements,”<br />
and in SIC-12, “Consolidation—Special Purpose Entities” (“SIC-12”).<br />
IFRS 10 establishes a uniform definition of the term “control,”<br />
with greater emphasis on the principle of substance over form<br />
than in the past. The new standard can thus give rise to an<br />
altered scope of consolidation. IFRS 10 is generally to be applied<br />
retrospectively for fiscal years beginning on or after January 1,<br />
2013. Earlier application is permitted as long as the standards<br />
IFRS 11, “Joint Arrangements” (“IFRS 11”), IFRS 12, “Disclosure<br />
of Interests in Other Entities” (“IFRS 12”), IAS 27, “Separate<br />
Financial Statements” (“IAS 27”), and IAS 28, “Investments in<br />
Associates and Joint Ventures” (“IAS 28”), are also being applied<br />
at the same time. The standard has not yet been transferred<br />
by the EU into European law. E.ON is currently evaluating the<br />
impact on its Consolidated Financial Statements.<br />
IFRS 11, “Joint Arrangements”<br />
In May <strong>2011</strong>, the IASB issued the new standard IFRS 11. It<br />
replaces IAS 31, “Interests in Joint Ventures” (“IAS 31”), and SIC-13,<br />
“Jointly Controlled Entities—Non-Monetary Contributions<br />
by Venturers” (“SIC-13”). The standard will in future distinguish<br />
between two types of joint arrangements: joint ventures
and joint operations. The provisions of IFRS 10 form the basis<br />
for determining joint control. If after assessing the particular<br />
facts a joint venture is determined to exist, it must be<br />
accounted for using the equity method. In the case of a joint<br />
operation, however, the attributable shares of assets and liabilities,<br />
and of expenses and in<strong>com</strong>e, must be assigned directly<br />
to the equity holder. The application of the new standard will<br />
be mandatory for fiscal years beginning on or after January 1,<br />
2013. Earlier application is permitted as long as the standards<br />
IFRS 10, IFRS 12, IAS 27 and IAS 28 are also being applied at the<br />
same time. The standard has not yet been transferred by the<br />
EU into European law. E.ON is currently evaluating the impact<br />
on its Consolidated Financial Statements.<br />
IFRS 12, “Disclosure of Interests in Other Entities”<br />
IFRS 12 regulates the disclosure requirements for both IFRS 10<br />
and IFRS 11, and was published by the IASB together with<br />
these standards on May 12, <strong>2011</strong>. The standard requires entities<br />
to publish information on the nature of their holdings, the<br />
associated risks and the effects on their net assets, financial<br />
position and results of operations. This information is required<br />
for subsidiaries, joint arrangements, associates and unconsolidated<br />
structured units (special-purpose entities). Important<br />
discretionary decisions and assumptions, including any changes<br />
to them, that were made in determining control according<br />
to IFRS 10 and for joint arrangements must also be disclosed.<br />
The application of the new standard will be mandatory for<br />
fiscal years beginning on or after January 1, 2013, with earlier<br />
application permitted. The standard has not yet been transferred<br />
by the EU into European law. E.ON is currently evaluating<br />
the impact on its Consolidated Financial Statements.<br />
IFRS 13, “Fair Value Measurement”<br />
In May <strong>2011</strong>, the IASB issued the new standard IFRS 13, “Fair<br />
Value Measurement” (“IFRS 13”). The objective of the standard<br />
is to define the term “fair value” and to establish guidance<br />
and disclosure requirements for fair value measurement that<br />
should be applied across standards. In the standard, fair<br />
value is defined as the price that would be received to sell an<br />
asset or paid to transfer a liability in an orderly transaction<br />
between independent market participants at the measurement<br />
CEO Letter<br />
E.ON Stock<br />
Combined Group Management <strong>Report</strong><br />
Consolidated Financial Statements<br />
Corporate Governance <strong>Report</strong><br />
Supervisory Board and Board of Management<br />
Tables and Explanations<br />
date. For non-financial assets, the fair value is determined<br />
based on the highest and best use of the asset as determined<br />
by a market participant. IFRS 13 takes effect on January 1, 2013,<br />
and is applied prospectively, with earlier application permitted.<br />
The standard has not yet been transferred by the EU into<br />
European law. E.ON is currently still evaluating the impact on<br />
its Consolidated Financial Statements.<br />
IAS 27, “Separate Financial Statements”<br />
In May <strong>2011</strong>, the IASB issued a new version of IAS 27. The new<br />
version now contains regulations for IFRS separate financial<br />
statements only (previously consolidated and separate financial<br />
statements). The application of the new standard is to be<br />
mandatory for fiscal years beginning on or after January 1, 2013.<br />
Earlier application is permitted as long as the standards IFRS 10,<br />
IFRS 11, IFRS 12 and IAS 28 are also being applied at the<br />
same time. The standard has not yet been transferred by the<br />
EU into European law. E.ON anticipates no effects from the<br />
new standard.<br />
IAS 28, “Investments in Associates and Joint Ventures”<br />
In May <strong>2011</strong>, the IASB issued a new version of IAS 28. The new<br />
version now stipulates that in planned partial disposals of<br />
interests in associates and joint ventures, the portion to be sold<br />
must, if it meets the criteria of IFRS 5, “Non-Current Assets<br />
Held For Sale and Discontinued Operations” (“IFRS 5”), be classified<br />
as a non-current asset held for sale. The remaining investment<br />
shall continue to be accounted for using the equity<br />
method. If the sale results in the creation of an associate, that<br />
associate will be accounted for using the equity method.<br />
Otherwise, the rules of IFRS 9 must be followed. The new IAS 28<br />
incorporates the provisions of SIC-13 and removes currently<br />
existing exceptions from the scope of IAS 28. The new version<br />
is to be mandatory for fiscal years beginning on or after<br />
January 1, 2013. Earlier application is permitted as long as the<br />
standards IFRS 10, IFRS 11, IFRS 12 and IAS 27 are also being<br />
applied at the same time. The standard has not yet been transferred<br />
by the EU into European law. E.ON is currently evaluating<br />
the effects of the new standard.<br />
91
92 Notes<br />
Amendments to IFRS 1, “First-time Adoption of<br />
International Financial <strong>Report</strong>ing Standards”—<br />
Severe Hyperinflation and Removal of Fixed Dates<br />
In December 2010, the IASB issued two amendments to IFRS 1.<br />
The first amendment provides application guidance in cases<br />
where an entity was unable to <strong>com</strong>ply with IFRS rules because<br />
its functional currency was subject to hyperinflation. The<br />
second amendment replaces the references to the fixed transition<br />
date of “January 1, 2004” with the “date of transition to<br />
IFRS.” The amendments are to be applied for fiscal years beginning<br />
on or after July 1, <strong>2011</strong>. They have not yet been transferred<br />
by the EU into European law. The standard thus amended has<br />
no impact on the E.ON Consolidated Financial Statements as<br />
they are already prepared in accordance with IFRS.<br />
Amendments to IFRS 7, “Financial Instruments:<br />
Disclosures”—Disclosures—Transfers of Financial<br />
Assets<br />
In October 2010, the IASB issued amendments to IFRS 7. The<br />
new version of the standard seeks to allow users of financial<br />
statements to improve their understanding of transfer transactions<br />
of financial assets (for example, securitizations of debt<br />
and deposits). The amendments relate in particular to the<br />
disclosure of potential risks that remain with the entity that<br />
transferred the assets as a consequence of continuing involvement.<br />
The amendments have been transferred by the EU into<br />
European law and thus they are to be applied for fiscal years<br />
beginning on or after July 1, <strong>2011</strong>. At this time, E.ON anticipates<br />
no material impact on its Consolidated Financial Statements.<br />
Amendments to IAS 1, “Presentation of Financial<br />
Statements”<br />
In June <strong>2011</strong>, the IASB issued amendments to IAS 1, “Presentation<br />
of Financial Statements” (“IAS 1”). The changes stipulate<br />
that the individual <strong>com</strong>ponents of other <strong>com</strong>prehensive<br />
in<strong>com</strong>e (“OCI”) shall in future be separated in the statement<br />
of <strong>com</strong>prehensive in<strong>com</strong>e according to whether they will<br />
be recycled into the in<strong>com</strong>e statement at a later date or not.<br />
The amendments are to be applied for fiscal years beginning<br />
on or after July 1, 2012. They have not yet been transferred<br />
by the EU into European law. E.ON anticipates that the amendments<br />
will not have a material impact on its Consolidated<br />
Financial Statements.<br />
Amendments to IAS 12, “In<strong>com</strong>e Taxes”—Deferred<br />
Tax: Recovery of Underlying Assets<br />
In December 2010, the IASB issued amendments to IAS 12,<br />
“In<strong>com</strong>e Taxes” (“IAS 12”). When measuring temporary tax differences<br />
in connection with real estate held as investment<br />
property, there is now a presumption that such temporary<br />
differences are normally reversed through sale, rather than<br />
through continued use. The amendments are to be applied for<br />
fiscal years beginning on or after January 1, 2012. They have<br />
not yet been transferred by the EU into European law. E.ON<br />
does not anticipate that the amendments will have any impact<br />
on its Consolidated Financial Statements.<br />
Amendments to IAS 19, “Employee Benefits”<br />
In June <strong>2011</strong>, the IASB issued amendments to IAS 19, “Employee<br />
Benefits” (“IAS 19”). The application of the so-called “corridor<br />
method” will in future no longer be allowed for the delayed<br />
recognition of actuarial gains and losses. Actuarial gains and<br />
losses must now be fully and immediately recognized in OCI.<br />
The expected return on plan assets and the interest cost of<br />
the defined benefit obligations are replaced by one uniform<br />
net interest result that is based on the discount rate. The net<br />
interest result will in future be calculated on the basis of<br />
the net pension liabilities or assets resulting from the existing<br />
defined benefit pension plans. Any past service cost will<br />
henceforth be recognized in full, and generally in the period in<br />
which the underlying plan amendment occurs. Furthermore,<br />
additional disclosures will be required on matters including<br />
the characteristics of the existing pension plans, the identifiable<br />
risks to which the entity is exposed and the effects of<br />
the defined benefit plans on the entity’s future cash flows.
The amended standard also contains a revision of the rules<br />
governing termination benefits. The amendments to IAS 19 are<br />
to be applied for fiscal years beginning on or after January 1,<br />
2013. They have not yet been transferred by the EU into European<br />
law. E.ON is currently still evaluating the impact on its<br />
Consolidated Financial Statements.<br />
Amendments to IAS 32, “Financial Instruments:<br />
Presentation,” and to IFRS 7, “Financial Instruments:<br />
Disclosures”<br />
In December <strong>2011</strong>, the IASB issued amendments to IAS 32 and<br />
IFRS 7. Entities shall in future be required to disclose gross<br />
and net amounts from offsetting, as well as amounts for existing<br />
rights of set-off that do not meet the accounting criteria<br />
for offsetting. In addition, inconsistencies in applying the<br />
existing rules for offsetting financial assets and financial liabilities<br />
have been eliminated. The amendments mentioned have<br />
different first-time application dates. The amendments to IAS<br />
32 are to be applied for fiscal years beginning on or after<br />
(3) Scope of Consolidation<br />
The number of consolidated <strong>com</strong>panies changed as follows:<br />
Scope of Consolidation<br />
Domestic Foreign Total<br />
Consolidated <strong>com</strong>panies<br />
as of January 1, 2010 160 441 601<br />
Additions 9 14 23<br />
Disposals/Mergers<br />
Consolidated <strong>com</strong>panies<br />
8 121 129<br />
as of December 31, 2010 161 334 495<br />
Additions 3 17 20<br />
Disposals/Mergers<br />
Consolidated <strong>com</strong>panies<br />
3 37 40<br />
as of December 31, <strong>2011</strong> 161 314 475<br />
CEO Letter<br />
E.ON Stock<br />
Combined Group Management <strong>Report</strong><br />
Consolidated Financial Statements<br />
Corporate Governance <strong>Report</strong><br />
Supervisory Board and Board of Management<br />
Tables and Explanations<br />
January 1, 2014. The amendments to IFRS 7 are to be applied<br />
for fiscal years beginning on or after January 1, 2013. They have<br />
not yet been transferred by the EU into European law. E.ON<br />
anticipates that the amendments will not have a material<br />
impact on its Consolidated Financial Statements.<br />
IFRIC 20, “Stripping Costs in the Production Phase<br />
of a Surface Mine”<br />
IFRIC 20, “Stripping Costs in the Production Phase of a Surface<br />
Mine” (“IFRIC 20”), was published in October <strong>2011</strong>. IFRIC 20<br />
specifies the preconditions under which the cost of removing<br />
waste from a surface mine during its production phase should<br />
lead to the recognition of an asset. It also provides guidance<br />
on how that asset should be measured, both initially and in<br />
subsequent periods. IFRIC 20 is effective for fiscal years beginning<br />
on or after January 1, 2013. Earlier application is permitted.<br />
The interpretation has not yet been transferred by the EU<br />
into European law. IFRIC 20 has no impact on E.ON’s Consolidated<br />
Financial Statements.<br />
In <strong>2011</strong>, a total of 51 domestic and 54 foreign associated <strong>com</strong>panies<br />
were accounted for under the equity method (2010:<br />
53 domestic and 53 foreign). Significant acquisitions, disposals<br />
and discontinued operations are discussed in Note 4.<br />
93
94 Notes<br />
(4) Acquisitions, Disposals and Discontinued<br />
Operations<br />
Disposal Groups and Assets Held for Sale in <strong>2011</strong><br />
E.ON Bulgaria<br />
In line with the strategy to divest €15 billion in assets by<br />
the end of 2013, E.ON signed an agreement with the Czech<br />
<strong>com</strong>pany ENERGO-PRO on the disposal of its wholly-owned<br />
subsidiary E.ON Bulgaria in December <strong>2011</strong>. The purchase price<br />
of approximately €0.1 billion is subject to final purchase price<br />
adjustments. The major asset items on the balance sheet were<br />
property, plant and equipment (€0.2 billion) and current assets<br />
(€0.1 billion). Provisions and liabilities amounted to €0.1 billion<br />
in total. The agreement on the purchase price necessitated the<br />
recognition in December of impairment charges on goodwill<br />
and non-current assets totaling €0.1 billion. The transaction is<br />
expected to close in the first half of 2012. The Bulgarian activities<br />
are part of the “Other regional units” segment. These activities<br />
are presented as a disposal group on grounds of materiality.<br />
Central Networks<br />
In line with the aforementioned divestment strategy, E.ON sold<br />
its U.K. power distribution network operator to PPL Corporation<br />
(“PPL”), Allentown, Pennsylvania, U.S., effective April 1, <strong>2011</strong>.<br />
The purchase price for the equity and for the assumption of<br />
certain liabilities is approximately £4.1 billion (equivalent to<br />
€4.6 billion as of April 1, <strong>2011</strong>). In addition, provisions for pensions<br />
of about £0.1 billion were also transferred. As negotiations<br />
had already reached an advanced stage by March 1, <strong>2011</strong>,<br />
the activities had been presented as a disposal group as of<br />
that date. Held in the United Kingdom regional unit, Central<br />
Networks had net assets before consolidation effects of approximately<br />
£2.0 billion (equivalent to €2.3 billion) as of April 1, <strong>2011</strong>.<br />
Its major balance sheet line items were non-current assets<br />
(€5.0 billion), operating receivables (€0.4 billion), intragroup liabilities<br />
(€1.2 billion) and financial liabilities to non-Group third<br />
parties (€0.6 billion), as well as pension and other provisions<br />
(€0.7 billion) and liabilities (€0.6 billion). The disposal gain<br />
before foreign exchange translation differences amounts to<br />
about £0.5 billion. OCI as of April 1, <strong>2011</strong>, consisted primarily of<br />
foreign exchange translation differences totaling -€0.2 billion;<br />
the resulting gain on disposal thus amounted to €0.4 billion.<br />
E.ON Rete<br />
In mid-December 2010, the contractual agreements to sell all<br />
of the shares of E.ON Rete S.r.l., Milan, Italy, the <strong>com</strong>pany operating<br />
the Italian gas distribution network for the former Italy<br />
market unit, to a consortium consisting of Italian investment<br />
fund F2i SGR S.p.A. and AXA Private Equity at a sales price of<br />
approximately €0.3 billion, were finalized. These activities have<br />
been presented as a disposal group since December 31, 2010.<br />
The major balance sheet line items were €0.1 billion and<br />
€0.2 billion, respectively, in intangible assets and property, plant<br />
and equipment, as well as €0.2 billion in liabilities. The transaction<br />
closed at the beginning of April <strong>2011</strong> with a minor book<br />
gain on the disposal.<br />
Stadtwerke Duisburg/Stadtwerke Karlsruhe<br />
Following the disposal of the Thüga group, the shareholdings<br />
in Stadtwerke Karls ruhe GmbH (10 percent), Karlsruhe, Germany,<br />
and in Stadtwerke Duisburg Aktiengesellschaft (20 percent),<br />
Duisburg, Germany, both accounted for in the Gas global unit,<br />
were classified as assets held for sale as of December 31, 2010.<br />
The sales closed at the beginning of <strong>2011</strong> and in July <strong>2011</strong>,<br />
respectively.<br />
HSE<br />
Following the disposal of the Thüga group, a concrete stage<br />
in negotiations on the disposal of the 40-percent shareholding<br />
in HEAG Südhessische Energie AG, Darmstadt, Germany,<br />
accounted for in the Gas global unit, was reached in the third<br />
quarter of 2010. Accordingly, the ownership interest was<br />
reclassified as an asset held for sale at the end of August 2010.<br />
The carrying amount of the ownership interest is approximately<br />
€0.3 billion. The contract for the sale was signed in February<br />
2012. The transaction still requires the approval of various municipal<br />
<strong>com</strong>mittees of the city of Darmstadt and is expected to<br />
close in the first half of 2012.<br />
BKW<br />
Also in the context of portfolio streamlining, E.ON decided to dispose<br />
of its approximately 21-percent shareholding in BKW FMB<br />
Energie AG (“BKW”), Bern, Switzerland. The first stage of the<br />
transaction was <strong>com</strong>pleted in July 2010, when BKW itself and<br />
Groupe E SA, Fribourg, Switzerland, acquired a stake of approximately<br />
14 percent. The remaining approximately 7 percent<br />
of the shares have been reported as a financial asset since the<br />
fourth quarter of <strong>2011</strong>. The carrying amount is €0.1 billion.<br />
Interest in OAO Gazprom<br />
The portfolio streamlining efforts also included the disposal<br />
in the fourth quarter of 2010 of most of E.ON’s interest in<br />
OAO Gazprom (“Gazprom”), Moscow, Russian Federation, sold<br />
to Russia’s state-owned Vnesheconombank (“VEB”), Moscow,
Russian Federation. The proceeds from this transaction totaled<br />
approximately €2.6 billion, resulting in a book gain of approximately<br />
€2.0 billion. The remaining stake, held in the Gas global<br />
unit, was classified as held for sale with a carrying amount of<br />
approximately €0.9 billion as of December 31, 2010. This remainder<br />
was sold in the first quarter of <strong>2011</strong>. The gain on disposal<br />
amounted to approximately €0.6 billion.<br />
Discontinued Operations in 2010<br />
U.S. Midwest<br />
At the end of April 2010, E.ON and PPL signed agreements on<br />
the sale of the power and gas business in the United States,<br />
bundled in the U.S. Midwest market unit. The agreed purchase<br />
price for the equity and for the assumption of certain liabilities<br />
was approximately $7.6 billion (equivalent to approximately<br />
€5.5 billion as of November 1, 2010). We also transferred pension<br />
obligations in the amount of approximately $0.8 billion.<br />
The increased probability of the intended sale taking place<br />
necessitated a reexamination of the measurement of the U.S.<br />
businesses, taking into account the expected proceeds on<br />
disposal. The result of this examination, taken together with the<br />
purchase price actually agreed, resulted in goodwill impairment<br />
of approximately €0.9 billion, which already had to be<br />
recognized in the first quarter of 2010. The transaction closed<br />
on November 1, 2010. Amounts totaling -€0.2 billion that were<br />
carried in OCI had to be transferred to the in<strong>com</strong>e statement<br />
in connection with this disposal.<br />
The table below provides selected financial information,<br />
including the 2010 goodwill impairment and subsequent<br />
effects at U.S. Midwest.<br />
Selected Financial Information—<br />
U.S. Midwest (Summary)<br />
€ in millions <strong>2011</strong> 2010<br />
Sales – 1,563<br />
Other in<strong>com</strong>e/expenses, net<br />
In<strong>com</strong>e/Loss (-) from continuing<br />
operations before in<strong>com</strong>e taxes and<br />
20 -2,233<br />
non-controlling interests 20 -670<br />
In<strong>com</strong>e tax benefit<br />
In<strong>com</strong>e/Loss (-) from discontinued<br />
– -149<br />
operations 20 -819<br />
CEO Letter<br />
E.ON Stock<br />
Combined Group Management <strong>Report</strong><br />
Consolidated Financial Statements<br />
Corporate Governance <strong>Report</strong><br />
Supervisory Board and Board of Management<br />
Tables and Explanations<br />
Disposal Groups and Assets Held for Sale in 2010<br />
Europgas<br />
As part of a series of portfolio optimizations, E.ON sought to<br />
sell its 50-percent stake in Europgas a.s., Prague, Czech Republic;<br />
accordingly, the holding was reported as an asset held<br />
for sale as of June 30, 2010. Accounted for in the Pan-European<br />
Gas market unit using the equity method, the holding had a<br />
carrying amount of approximately €0.2 billion. The transaction<br />
closed at the end of July 2010.<br />
Commitment to the European Commission<br />
In December 2008, E.ON’s <strong>com</strong>mitment to the European Commission<br />
to sell a variety of generating capacity and the ultrahigh-voltage<br />
network in Germany took effect. The total of<br />
approximately 5 GW in capacity to be sold, including associated<br />
assets and liabilities, has been presented as a disposal group<br />
since the end of 2008. The net carrying amounts of the disposal<br />
group related exclusively to the Central Europe market<br />
unit and initially amounted to approximately €0.4 billion. The<br />
disposal of significant portions of the capacity to be sold took<br />
place in several transactions during 2009. The first quarter of<br />
2010 saw the closing of the contract with Stadtwerke Hannover<br />
AG, Hanover, Germany, on the sale of a further 0.3 GW in<br />
capacity with a gain on disposal of approximately €0.2 billion.<br />
The disposal of the remaining 0.3 GW of generating capacity<br />
closed in April 2010.<br />
In November 2009, an agreement was reached with TenneT B.V.,<br />
Arnhem, The Netherlands, on the disposal of the German<br />
ultrahigh-voltage network. The ultrahigh-voltage network was<br />
therefore reclassified as a disposal group in the fourth quarter<br />
of 2009 with a net carrying amount of approximately €0.8 billion.<br />
The major asset and liability items as of the disposal<br />
date were property, plant and equipment and current assets<br />
in the amount of €1.0 billion and €0.7 billion, respectively,<br />
as well as liabilities and deferred taxes in the amount of<br />
€0.9 billion and €0.2 billion, respectively. The relevant entity<br />
also had financial obligations from investing activities in the<br />
amount of approximately €2 billion. The agreed transaction<br />
closed at the end of February 2010. With purchase price allocations<br />
taken into account, the gain on disposal was €0.1 billion.<br />
The <strong>com</strong>mitment to the European Commission was thus fulfilled<br />
in its entirety in April 2010.<br />
95
96 Notes<br />
(5) Revenues<br />
Revenues are generally recognized upon delivery of goods to<br />
customers or purchasers, or upon <strong>com</strong>pletion of services rendered.<br />
Delivery is considered to have occurred when the risks<br />
and rewards associated with ownership have been transferred<br />
to the buyer, <strong>com</strong>pensation has been contractually established<br />
and collection of the resulting receivable is probable.<br />
Revenues are generated primarily from the sale of electricity and<br />
gas to industrial and <strong>com</strong>mercial customers, to retail customers<br />
and to wholesale markets. Additional revenue is earned<br />
from the distribution of gas and electricity, from deliveries of<br />
steam, heat and water, as well as from proprietary trading.<br />
(6) Own Work Capitalized<br />
Own work capitalized amounted to €519 million in <strong>2011</strong><br />
(2010: €588 million) and resulted primarily from engineering<br />
services in networks and in connection with new construction<br />
projects.<br />
(7) Other Operating In<strong>com</strong>e and Expenses<br />
The table below provides details of other operating in<strong>com</strong>e<br />
for the periods indicated:<br />
Other Operating In<strong>com</strong>e<br />
€ in millions <strong>2011</strong> 2010<br />
In<strong>com</strong>e from exchange rate differences 6,027 5,177<br />
Gain on derivative financial instruments 4,559 6,046<br />
Gain on disposal of investments<br />
Gain on disposal of property,<br />
1,416 3,424<br />
plant and equipment 132 54<br />
Miscellaneous 1,651 1,260<br />
Total 13,785 15,961<br />
Revenues from the sale of electricity and gas to industrial and<br />
<strong>com</strong>mercial customers, to retail customers and to wholesale<br />
markets are recognized when earned on the basis of a contractual<br />
arrangement with the customer or purchaser; they reflect<br />
the value of the volume supplied, including an estimated value<br />
of the volume supplied to customers between the date of<br />
their last meter reading and period-end. Unrealized and realized<br />
proceeds from proprietary trading activities are recognized<br />
net in revenues.<br />
At €113 billion, revenues in <strong>2011</strong> were 22 percent higher than in<br />
the previous year. The increase is primarily the result of higher<br />
trading volumes at our Trading unit.<br />
The classification of revenues by segment is presented in<br />
Note 33.<br />
In general, E.ON employs derivatives to hedge <strong>com</strong>modity<br />
risks as well as currency and interest risks.<br />
Gains and losses on derivative financial instruments relate to<br />
gains from fair value measurement and to realized gains<br />
from derivatives under IAS 39, with the exception of in<strong>com</strong>e<br />
effects from interest rate derivatives. In this respect there<br />
was a significant impact from <strong>com</strong>modity derivatives in particular,<br />
which in <strong>2011</strong> resulted predominantly from the marking<br />
to market of gas, oil and emissions-related derivatives. In 2010<br />
there were effects resulting especially from coal, oil and gasrelated<br />
derivatives.<br />
In<strong>com</strong>e from exchange rate differences consisted primarily of<br />
realized gains from currency derivatives in the amount of<br />
€3,042 million (2010: €3,420 million) and of effects from foreign<br />
currency translation on the balance sheet date in the amount<br />
of €2,353 million (2010: €1,480 million).
The gains on the disposal of investments and securities consisted<br />
primarily of gains of €602 million (2010: €1,953 million)<br />
on the disposal of the Gazprom shares and €387 million on<br />
the disposal of the U.K. power distribution network (see also<br />
Note 4). Additional gains were realized on the sale of securities<br />
in the amount of €147 million (2010: €257 million).<br />
Miscellaneous other operating in<strong>com</strong>e in 2010 consisted primarily<br />
of reductions of valuation allowances on accounts<br />
receivable and reversals of provisions, as well as <strong>com</strong>pensation<br />
payments received for damages.<br />
The following table provides details of other operating<br />
expenses for the periods indicated:<br />
Other Operating Expenses<br />
€ in millions <strong>2011</strong> 2010<br />
Loss from exchange rate differences 6,761 4,936<br />
Loss on derivative financial instruments 5,685 3,559<br />
Taxes other than in<strong>com</strong>e taxes 386 326<br />
Loss on disposal of investments 742 75<br />
Miscellaneous 4,082 4,701<br />
Total 17,656 13,597<br />
(8) Cost of Materials<br />
The principal <strong>com</strong>ponents of expenses for raw materials and<br />
supplies and for purchased goods are the purchase of gas and<br />
electricity and of fuels for electricity generation, as well as the<br />
nuclear segment. Network usage charges are also included in<br />
this line item. Expenses for purchased services consist primarily<br />
of maintenance costs. The cost of materials increased<br />
by €24,252 million to €97,827 million (2010: €73,575 million).<br />
The primary causes were the higher trading volumes in <strong>2011</strong><br />
<strong>com</strong>pared with the previous year, higher costs incurred in connection<br />
with the early, unplanned shutdowns of nuclear power<br />
plants in Germany as a result of the new amendment to the<br />
German Nuclear Energy Act, and higher procurement costs.<br />
CEO Letter<br />
E.ON Stock<br />
Combined Group Management <strong>Report</strong><br />
Consolidated Financial Statements<br />
Corporate Governance <strong>Report</strong><br />
Supervisory Board and Board of Management<br />
Tables and Explanations<br />
Losses from exchange rate differences consisted primarily of<br />
realized losses from currency derivatives in the amount of<br />
€3,069 million (2010: €3,198 million) and of effects from foreign<br />
currency translation on the balance sheet date in the amount<br />
of €3,172 million (2010: €1,413 million).<br />
Miscellaneous other operating expenses include concession<br />
payments in the amount of €492 million (2010: €473 million),<br />
expenses for external audit, non-audit and consulting services<br />
in the amount of €259 million (2010: €292 million), advertising<br />
and marketing expenses in the amount of €216 million (2010:<br />
€284 million), as well as write-downs of trade receivables in<br />
the amount of €346 million (2010: €380 million). Additionally<br />
reported in this item are services rendered by third parties,<br />
IT expenditures and insurance premiums.<br />
Other operating expenses from exploration activities totaled<br />
€36 million (2010: €37 million).<br />
Cost of Materials<br />
€ in millions<br />
Expenses for raw materials and supplies<br />
<strong>2011</strong> 2010<br />
and for purchased goods 93,765 70,165<br />
Expenses for purchased services 4,062 3,410<br />
Total 97,827 73,575<br />
97
98 Notes<br />
(9) Financial Results<br />
The following table provides details of financial results for the<br />
periods indicated:<br />
Financial Results<br />
€ in millions<br />
In<strong>com</strong>e from <strong>com</strong>panies in which equity<br />
<strong>2011</strong> 2010<br />
investments are held<br />
Impairment charges/reversals on other<br />
128 167<br />
financial assets -188 -48<br />
In<strong>com</strong>e/Loss (-) from equity investments -60 119<br />
In<strong>com</strong>e from securities, interest<br />
and similar in<strong>com</strong>e 716 653<br />
Available for sale 332 208<br />
Loans and receivables 165 171<br />
Held for trading 7 78<br />
Other interest in<strong>com</strong>e 212 196<br />
Interest and similar expenses -2,810 -2,956<br />
Amortized cost -1,292 -1,535<br />
Held for trading -158 -32<br />
Other interest expenses -1,360 -1,389<br />
Net interest in<strong>com</strong>e -2,094 -2,303<br />
Financial results -2,154 -2,184<br />
The measurement categories are described in detail in Note 2.<br />
Financial results have improved slightly in <strong>2011</strong> <strong>com</strong>pared with<br />
the previous year. Lower interest expenses were offset by<br />
higher impairments recognized on other financial assets. These<br />
impairments predominantly relate to the securities held in<br />
the context of the Company’s asset management activities<br />
(see Note 31).<br />
(10) In<strong>com</strong>e Taxes<br />
The table at right provides details of in<strong>com</strong>e taxes, including<br />
deferred taxes, for the periods indicated:<br />
Other interest in<strong>com</strong>e consists mostly of in<strong>com</strong>e from lease<br />
receivables (finance leases) and in<strong>com</strong>e resulting from taxes for<br />
previous years. Other interest expense includes the accretion<br />
of provisions for asset retirement obligations in the amount<br />
of €748 million (2010: €722 million). Also contained in this<br />
item is the interest cost from provisions for pensions—net of<br />
the expected return on plan assets—in the amount of €143 million<br />
(2010: €167 million). A total of €34 million in prepayment<br />
penalties was paid in <strong>2011</strong> (2010: €65 million) in connection with<br />
the early repayment of loans and the necessary reversal of<br />
associated interest rate hedges. The early buyback of bonds<br />
resulted in a one-time expense of approximately €115 million<br />
(2010: €1 million). This amount represents the difference<br />
between the amount paid to repurchase the bonds at market<br />
prices and their carrying amounts.<br />
In accordance with IAS 32, the accretion of liabilities in connection<br />
with put options resulted in an expense of €60 million<br />
(2010: €47 million).<br />
Interest expense was reduced by capitalized interest on debt<br />
totaling €312 million (2010: €316 million).<br />
Realized gains and losses from interest rate swaps are shown<br />
net on the face of the in<strong>com</strong>e statement.<br />
In<strong>com</strong>e Taxes<br />
€ in millions <strong>2011</strong> 2010<br />
Domestic in<strong>com</strong>e taxes 432 987<br />
Foreign in<strong>com</strong>e taxes 555 684<br />
Other in<strong>com</strong>e taxes 17 10<br />
Current taxes 1,004 1,681<br />
Domestic -1,139 581<br />
Foreign -901 -316<br />
Deferred taxes -2,040 265<br />
Total in<strong>com</strong>e taxes -1,036 1,946
The decrease in tax expense by €3 billion <strong>com</strong>pared with 2010<br />
primarily reflects the changes in the earnings environment.<br />
The effective tax rate has increased from 22 percent in 2010<br />
to 36 percent in <strong>2011</strong>.<br />
German legislation providing for fiscal measures to ac<strong>com</strong>pany<br />
the introduction of the European Company and amending<br />
other fiscal provisions (“SE-Steuergesetz” or “SEStEG”), which<br />
came into effect on December 13, 2006, altered the regulations<br />
on corporate tax credits arising from the corporate imputation<br />
system (“Anrechnungs verfahren”), which had existed<br />
until 2001. The change de-links the corporate tax credit from<br />
distributions of dividends. Instead, after December 31, 2006,<br />
an unconditional claim for payment of the credit in ten equal<br />
annual installments from 2008 through 2017 has been established.<br />
The resulting receivable is included in in<strong>com</strong>e tax assets<br />
and amounted to €153 million in <strong>2011</strong> (2010: €958 million).<br />
The decline in in<strong>com</strong>e tax assets is mainly attributable to the<br />
significant reduction of corporate tax credits in <strong>2011</strong>.<br />
In<strong>com</strong>e tax liabilities consist primarily of in<strong>com</strong>e taxes for the<br />
respective current year and for prior-year periods that have<br />
not yet been definitively examined by the tax authorities.<br />
Reconciliation to Effective In<strong>com</strong>e Taxes/Tax Rate<br />
In<strong>com</strong>e taxes relating to discontinued operations are reported<br />
in the in<strong>com</strong>e statement under “In<strong>com</strong>e/Loss from discontinued<br />
operations, net.” They relate to the U.S. Midwest market unit<br />
and amounted to €149 million in 2010. See Note 4 for additional<br />
discussion.<br />
CEO Letter<br />
E.ON Stock<br />
Combined Group Management <strong>Report</strong><br />
Consolidated Financial Statements<br />
Corporate Governance <strong>Report</strong><br />
Supervisory Board and Board of Management<br />
Tables and Explanations<br />
As of December 31, <strong>2011</strong>, €47 million (2010: €12 million) in<br />
deferred tax liabilities were recognized for the differences<br />
between net assets and the tax bases of subsidiaries and<br />
associated <strong>com</strong>panies (the so-called “outside basis differences”).<br />
Deferred tax liabilities were not recognized for subsidiaries<br />
and associated <strong>com</strong>panies to the extent that the Company can<br />
control the reversal effect and that it is therefore probable<br />
that temporary differences will not be reversed in the foreseeable<br />
future. Accordingly, deferred tax liabilities were not<br />
recognized for temporary differences of €1,434 million (2010:<br />
€1,833 million) at subsidiaries and associated <strong>com</strong>panies, as<br />
E.ON is able to control the timing of their reversal and the<br />
temporary difference will not reverse in the foreseeable future.<br />
Changes in tax rates in the United Kingdom, Hungary and a<br />
number of other countries resulted in tax in<strong>com</strong>e of €34 million<br />
in total. In 2010, changes in foreign tax rates produced deferred<br />
tax in<strong>com</strong>e of €54 million in total.<br />
The differences between the <strong>2011</strong> base in<strong>com</strong>e tax rate of<br />
30 percent (2010: 30 percent) applicable in Germany and the<br />
effective tax rate are reconciled as follows:<br />
<strong>2011</strong> 2010<br />
€ in<br />
millions %<br />
€ in<br />
millions %<br />
Expected corporate in<strong>com</strong>e tax -873 30.0 2,719 30.0<br />
Credit for dividend distributions -37 1.3 -96 -1.0<br />
Foreign tax rate differentials -163 5.6 -148 -1.6<br />
Changes in tax rate/tax law -34 1.2 -54 -0.6<br />
Tax effects on tax-free in<strong>com</strong>e -8 0.3 -743 -8.2<br />
Tax effects on equity accounting -144 4.9 -196 -2.2<br />
Other1 223 -7.7 464 5.1<br />
Effective in<strong>com</strong>e taxes/tax rate -1,036 35.6 1,946 21.5<br />
1 In <strong>2011</strong>, including €258 million primarily in tax effects on dividends and disposals; in 2010, including €358 million due to goodwill impairment.<br />
99
100 Notes<br />
Deferred tax assets and liabilities as of December 31, <strong>2011</strong>, and<br />
December 31, 2010, break down as shown in the following table:<br />
Deferred Tax Assets and Liabilities<br />
December 31<br />
€ in millions<br />
<strong>2011</strong> 2010<br />
Intangible assets 319 256<br />
Property, plant and equipment 1,030 817<br />
Financial assets 205 225<br />
Inventories 28 23<br />
Receivables 709 944<br />
Provisions 5,693 5,410<br />
Liabilities 4,307 3,932<br />
Net operating loss carryforwards 1,713 807<br />
Tax credits 27 23<br />
Other 520 280<br />
Subtotal 14,551 12,717<br />
Changes in value -88 -98<br />
Deferred tax assets 14,463 12,619<br />
Intangible assets 1,933 1,908<br />
Property, plant and equipment 6,184 6,553<br />
Financial assets 223 204<br />
Inventories 157 123<br />
Receivables 4,995 4,943<br />
Provisions 781 1,382<br />
Liabilities 449 733<br />
Other 1,375 1,449<br />
Deferred tax liabilities 16,097 17,295<br />
Net deferred tax assets/liabilities (-) -1,634 -4,676<br />
Net deferred taxes break down as follows based on the timing<br />
of their reversal:<br />
Net Deferred Tax Assets and Liabilities<br />
December 31, <strong>2011</strong> December 31, 2010<br />
NonNon-<br />
€ in millions<br />
Current current Current current<br />
Deferred tax assets 1,220 4,020 83 2,496<br />
Changes in value -13 -75 -1 -97<br />
Net deferred tax assets 1,207 3,945 82 2,399<br />
Deferred tax liabilities -812 -5,974 -671 -6,486<br />
Net deferred tax assets/liabilities (-) 395 -2,029 -589 -4,087
Of the deferred taxes reported, a total of -€304 million was<br />
charged directly to equity in <strong>2011</strong> (2010: €54 million). A further<br />
€44 million in current taxes (2010: €64 million) was also recognized<br />
directly in equity.<br />
In<strong>com</strong>e taxes recognized in other <strong>com</strong>prehensive in<strong>com</strong>e for<br />
the years <strong>2011</strong> and 2010 break down as follows:<br />
The adjustment of the purchase price for the Belgian power<br />
plant unit finalized in 2010 resulted in deferred tax assets of<br />
€14 million as of December 31, 2010.<br />
CEO Letter<br />
E.ON Stock<br />
Combined Group Management <strong>Report</strong><br />
Consolidated Financial Statements<br />
Corporate Governance <strong>Report</strong><br />
Supervisory Board and Board of Management<br />
Tables and Explanations<br />
In<strong>com</strong>e Taxes on Components of Other Comprehensive In<strong>com</strong>e<br />
<strong>2011</strong> 2010<br />
Before<br />
After Before<br />
After<br />
in<strong>com</strong>e In<strong>com</strong>e in<strong>com</strong>e in<strong>com</strong>e In<strong>com</strong>e in<strong>com</strong>e<br />
€ in millions<br />
taxes taxes taxes taxes taxes taxes<br />
Cash flow hedges -143 40 -103 -1 10 9<br />
Available-for-sale securities -1,028 -5 -1,033 -1,658 70 -1,588<br />
Currency translation adjustments<br />
Changes in actuarial gains/losses of defined benefit<br />
344 166 510 469 12 481<br />
pension plans and similar obligations -370 175 -195 -722 230 -492<br />
Companies accounted for under the equity method -81 – -81 -15 2 -13<br />
Total -1,278 376 -902 -1,927 324 -1,603<br />
The tax loss carryforwards as of the dates indicated are as<br />
follows:<br />
Tax Loss Carryforwards<br />
December 31<br />
€ in millions<br />
<strong>2011</strong> 2010<br />
Domestic tax loss carryforwards 3,811 706<br />
Foreign tax loss carryforwards 5,931 4,121<br />
Total 9,742 4,827<br />
Since January 1, 2004, domestic tax loss carryforwards can<br />
only be offset against a maximum of 60 percent of taxable<br />
in<strong>com</strong>e, subject to a full offset against the first €1 million.<br />
This minimum corporate taxation also applies to trade tax<br />
loss carry forwards. Of the foreign tax loss carryforwards, a<br />
significant portion relates to previous years. No deferred<br />
taxes have been recognized on a total of €2,408 million (2010:<br />
€2,133 million) in tax loss carryforwards that do not expire.<br />
101
102 Notes<br />
(11) Personnel-Related Information<br />
Personnel Costs<br />
The following table provides details of personnel costs for the<br />
periods indicated:<br />
Personnel Costs<br />
€ in millions <strong>2011</strong> 2010<br />
Wages and salaries 4,882 4,153<br />
Social security contributions<br />
Pension costs and other employee<br />
648 668<br />
benefits 417 460<br />
Pension costs 410 453<br />
Total 5,947 5,281<br />
Personnel costs rose by €666 million to €5,947 million<br />
(2010: €5.281 million); this was due especially to restructuring<br />
expenses associated with the E.ON 2.0 project.<br />
Share-Based Payment<br />
The expenses for share-based payment in <strong>2011</strong> (the employee<br />
stock purchase program, the E. ON Stock Appreciation Rights<br />
plan and the E. ON Share Performance Plan) amounted to<br />
€13.7 million (2010: €12.8 million).<br />
Employee Stock Purchase Program<br />
In <strong>2011</strong>, as in 2010, employees at German E.ON Group <strong>com</strong>panies<br />
had the opportunity to purchase shares of E.ON AG at<br />
preferential terms under a voluntary employee stock purchase<br />
program. Employees receive a matching contribution from<br />
the Company of at least 25 percent, but no more than €511,<br />
on the shares they purchased by the November 17, <strong>2011</strong>, cut-off<br />
date. On that date, the relevant market price of E.ON stock<br />
was €16.75. Depending on the number of shares purchased,<br />
the preferential prices paid ranged between €7.11 and €13.18<br />
(2010: between €9.94 and €17.95). The expense of €9.7 million<br />
(2010: €10.2 million) arising from the granting of the preferential<br />
prices is recognized as personnel costs and included in<br />
the “Wages and salaries” line item.<br />
Since the 2003 fiscal year, employees in the United Kingdom<br />
have the opportunity to purchase E.ON shares through an<br />
employee stock purchase program and to acquire additional<br />
bonus shares. The cost of issuing these bonus shares amounted<br />
to €3.3 million in <strong>2011</strong> (2010: €2.3 million) and is also recorded<br />
under personnel costs as part of “Wages and salaries.”<br />
In <strong>2011</strong>, E.ON acquired a total of 1,210,014 shares (0.06 percent<br />
of the capital stock of E.ON AG), mostly in the market, under<br />
the voluntary employee stock purchase program (2010: 980,897<br />
shares or 0.05 percent of the capital stock of E.ON AG) at an<br />
average purchase price of €17.20 per share (2010: €22.70 per<br />
share, purchased in the market).<br />
Information on the changes in the number of treasury shares<br />
held by E.ON AG can be found in Note 19.<br />
Long-Term Variable Compensation<br />
Members of the Board of Management of E.ON AG and certain<br />
executives of the E.ON Group receive share-based payment<br />
as part of their voluntary long-term variable <strong>com</strong>pensation.<br />
Share-based payment can only be granted if the qualified<br />
executive owns a certain minimum number of shares of E.ON<br />
stock, which must be held until maturity or full exercise. The<br />
purpose of such <strong>com</strong>pensation is to reward their contribution<br />
to E.ON’s growth and to further the long-term success of the<br />
Company. This variable <strong>com</strong>pensation <strong>com</strong>ponent, <strong>com</strong>prising<br />
a long-term incentive effect along with a certain element<br />
of risk, provides for a sensible linking of the interests of shareholders<br />
and management.<br />
The following discussion includes a report on the E.ON AG<br />
Stock Appreciation Rights plan, which ended in 2005, and on<br />
the E.ON Share Performance Plan, which was introduced in<br />
2006 and modified in 2010 and <strong>2011</strong> for subsequent tranches.
Stock Appreciation Rights of E.ON AG<br />
From 1999 up to and including 2005, E.ON annually granted<br />
stock appreciation rights (“SAR”) through the E.ON AG Stock<br />
Appreciation Rights program.<br />
Only SAR from the seventh tranche existed in the <strong>2011</strong> fiscal<br />
year. The terms of the plan are as follows:<br />
Stock Appreciation Rights of E.ON AG<br />
7th tranche<br />
Date of issuance Jan. 3, 2005<br />
approx.<br />
Term<br />
7 years<br />
Blackout period 2 years<br />
Exercise hurdle (minimum percentage by which<br />
exercise price exceeds the price at issuance) 10%<br />
Maximum gain on exercise of three subscription<br />
rights €65.35<br />
The amount paid to executives when they exercise their SAR<br />
is paid out in cash, and is equal to the difference between<br />
the E.ON AG share price at the time of exercise and the adjusted<br />
underlying share price at issuance of €20.37, multiplied by<br />
the number of SAR exercised and by a subscription factor of<br />
3. The adjustment of the underlying share price and the introduction<br />
of the subscription ratio of 3 were made necessary<br />
by the E.ON AG stock split on August 4, 2008, in order to ensure<br />
neutrality in value with an unchanged number of SAR. A cap<br />
on gains was put in place for seventh-tranche SAR equal to<br />
100 percent of the underlying price at the time of issuance in<br />
order to limit the effect of unforeseen extraordinary increases<br />
in the underlying share price.<br />
The in<strong>com</strong>e recognized in the reporting period amounted to<br />
€0.2 million (2010: €0.6 million).<br />
The seventh-tranche stock appreciation rights that were still<br />
outstanding during the fiscal year all expired valueless at<br />
maturity.<br />
E.ON Share Performance Plan Issues through 2010<br />
Since 2006, E.ON has been granting virtual shares (“Performance<br />
Rights”) under the E.ON Share Performance Plan. At<br />
the end of its term, each Performance Right is entitled to<br />
a cash payout linked to the final E.ON share price established<br />
at that time, as well as to the performance during the term<br />
of the E.ON share price relative to its benchmark, the STOXX<br />
Europe 600 Utilities (Net Return) index. The amount paid out<br />
CEO Letter<br />
E.ON Stock<br />
Combined Group Management <strong>Report</strong><br />
Consolidated Financial Statements<br />
Corporate Governance <strong>Report</strong><br />
Supervisory Board and Board of Management<br />
Tables and Explanations<br />
is equal to the target value at issuance if the E.ON share price<br />
is maintained at the end of the term and the performance<br />
of the E.ON share price matches that of the benchmark index.<br />
If the E.ON share outperforms the index, the amount paid<br />
out is increased proportionally. If, on the other hand, the E.ON<br />
share underperforms the index, disproportionate deductions<br />
are made. In the case of underperformance by 20 percent or<br />
more, there is no payment. The maximum amount to be paid<br />
out to each participant per Performance Right is limited to<br />
three times the target value originally set.<br />
60-day average prices are used to determine the target value<br />
at issuance, the final price and the relative performance, in<br />
order to mitigate the effects of incidental, short-lived price<br />
movements.<br />
The plan contains adjustment mechanisms to eliminate the<br />
effect of events such as interim corporate actions. Starting<br />
with tranche five, the term was extended to four years from<br />
the previous three. The following are the base parameters of<br />
the two tranches still active in <strong>2011</strong> under these plan terms:<br />
E.ON Share Performance Rights<br />
5th tranche 4th tranche<br />
Date of issuance Jan. 1, 2010 Jan. 1, 2009<br />
Term 4 years 3 years<br />
Target value at issuance €27.25 €27.93<br />
Maximum amount paid €81.75 €83.79<br />
The provision for the plan at year-end amounted to €2.4 million<br />
(2010: €10.7 million). A liability of €1.3 million, the total<br />
amount of the payouts, was recognized for the fourth tranche<br />
as of the balance sheet date. The in<strong>com</strong>e for the E.ON Share<br />
Performance Plan up to and including tranche five amounted to<br />
€6.8 million in the <strong>2011</strong> fiscal year (2010: €0.9 million expense).<br />
103
104 Notes<br />
E.ON Share Performance Plan Issues from <strong>2011</strong><br />
In <strong>2011</strong>, virtual shares (“Performance Rights”) were granted<br />
under the sixth tranche of the E.ON Share Performance Plan<br />
with a target value at issuance of €22.43. At the end of its<br />
term, each Performance Right is entitled to a cash payout<br />
linked to the final E.ON share price established at that time.<br />
Under the modified terms of the plan applicable to future<br />
tranches, the number of rights to be settled at the end of the<br />
term is now governed by the degree to which specific corporate<br />
financial measures are achieved over the term. The<br />
benchmark is the return on capital, expressed as the return<br />
on average capital employed (“ROACE”) <strong>com</strong>pared with the<br />
weighted-average cost of capital (“WACC”), averaged over the<br />
unchanged four-year term of the new tranche. At the same<br />
time, starting with the sixth tranche, the maximum payout was<br />
further limited to 2.5 times the target value originally set.<br />
60-day average prices are used to determine both the target<br />
value at issuance and the final price in order to mitigate the<br />
effects of incidental, short-lived price movements. The plan<br />
contains adjustment mechanisms to eliminate the effects of<br />
interim corporate actions. The 60-day average of the E.ON<br />
share price as of the balance sheet date is used to measure<br />
the fair value of the rights. A provision of €7.9 million was<br />
recognized. The expense for the fiscal year was €7.9 million.<br />
(12) Other Information<br />
German Corporate Governance Code<br />
On December 12, <strong>2011</strong>, the Board of Management and the<br />
Supervisory Board of E.ON AG made a declaration of <strong>com</strong>pliance<br />
pursuant to Section 161 of the German Stock Corporation Act<br />
(“AktG”). The declaration has been made permanently and<br />
publicly accessible to stockholders on the Company’s Web site<br />
(www.eon.<strong>com</strong>).<br />
Fees and Services of the Independent Auditor<br />
During <strong>2011</strong> and 2010, the following fees for services provided<br />
by the independent auditor of the Consolidated Financial Statements,<br />
Pricewaterhouse Coopers (“PwC”), Aktien gesellschaft,<br />
Employees<br />
During <strong>2011</strong>, E.ON employed an average of 80,859 persons<br />
(2010: 85,509), not including an average of 2,238 apprentices<br />
(2010: 2,261). The employees of the U.S. Midwest market unit<br />
are no longer reported in the table (see Note 4).<br />
The breakdown by segment is shown below:<br />
Employees1 <strong>2011</strong> 2010<br />
Generation 10,762 11,075<br />
Renewables 1,777 1,753<br />
Gas 3,192 3,168<br />
Trading 1,020 1,079<br />
Germany 21,566 21,278<br />
Other EU Countries 33,489 38,004<br />
Russia 4,894 4,713<br />
Group Management/Other2 4,159 4,439<br />
Total 80,859 85,509<br />
1 Figures do not include board members, managing directors, or apprentices.<br />
2 Includes E.ON IT Group.<br />
Wirtschafts prüfungs gesellschaft, (domestic) and by <strong>com</strong>panies<br />
in the international PwC network were recorded as expenses:<br />
Independent Auditor Fees<br />
€ in millions <strong>2011</strong> 2010<br />
Financial statement audits 27 30<br />
Domestic 18 20<br />
Other attestation services 23 25<br />
Domestic 19 18<br />
Tax advisory services 1 1<br />
Domestic 1 –<br />
Other services 1 3<br />
Domestic 1 3<br />
Total 52 59<br />
Domestic 39 41
The fees for financial statement audits concern the audit of<br />
the Consolidated Financial Statements and the legally mandated<br />
financial statements of E.ON AG and its affiliates.<br />
Fees for other attestation services concern in particular the<br />
review of the interim IFRS financial statements. Further<br />
included in this item are project-related reviews performed<br />
in the context of the introduction of IT and internal control<br />
systems, due- diligence services rendered in connection with<br />
acquisitions and disposals, and other mandatory and voluntary<br />
audits.<br />
(13) Earnings per Share<br />
The <strong>com</strong>putation of basic and diluted earnings per share for<br />
the periods indicated is shown below:<br />
Earnings per Share<br />
€ in millions<br />
In<strong>com</strong>e/Loss (-) from continuing<br />
<strong>2011</strong> 2010<br />
operations -1,875 7,117<br />
Less: Non-controlling interests<br />
In<strong>com</strong>e/Loss (-) from continuing<br />
operations (attributable to shareholders<br />
-358 -428<br />
of E.ON AG) -2,233 6,689<br />
In<strong>com</strong>e/Loss (-) from discontinued<br />
operations, net<br />
Net in<strong>com</strong>e/loss (-) attributable to<br />
14 -836<br />
shareholders of E.ON AG -2,219 5,853<br />
in €<br />
Earnings per share (attributable to<br />
shareholders of E.ON AG)<br />
from continuing operations -1.17 3.51<br />
from discontinued operations 0.01 -0.44<br />
from net in<strong>com</strong>e/loss (-) -1.16 3.07<br />
Weighted-average number of shares<br />
outstanding (in millions) 1,905 1,905<br />
CEO Letter<br />
E.ON Stock<br />
Combined Group Management <strong>Report</strong><br />
Consolidated Financial Statements<br />
Corporate Governance <strong>Report</strong><br />
Supervisory Board and Board of Management<br />
Tables and Explanations<br />
Fees for tax advisory services primarily include advisory on a<br />
case-by-case basis with regard to the tax treatment of M&A<br />
transactions, ongoing consulting related to the preparation of<br />
tax returns and the review of tax assessments, as well as advisory<br />
on other tax-related issues, both in Germany and abroad.<br />
Fees for other services consist primarily of technical support<br />
in IT and other projects.<br />
List of Shareholdings<br />
The list of shareholdings pursuant to Section 313 (2) HGB is<br />
an integral part of these Notes to the Financial Statements<br />
and is presented on pages 159 through 173.<br />
The <strong>com</strong>putation of diluted earnings per share is identical to<br />
that of basic earnings per share because E.ON AG has issued<br />
no potentially dilutive ordinary shares.<br />
105
106 Notes<br />
(14) Goodwill, Intangible Assets and<br />
Property, Plant and Equipment<br />
Goodwill, Intangible Assets and Property, Plant and Equipment<br />
Exchange<br />
Acquisition and production costs<br />
Changes in<br />
January 1,<br />
rate scope of<br />
December 31,<br />
€ in millions<br />
<strong>2011</strong> differences consolidation Additions Disposals Transfers <strong>2011</strong><br />
Goodwill 17,588 39 -392 0 0 -12 17,223<br />
Marketing-related intangible assets 52 – – – -46 – 6<br />
Customer-related intangible assets 2,310 20 -17 – -79 -1 2,233<br />
Contract-based intangible assets 7,119 -57 1 59 -33 -307 6,782<br />
Technology-based intangible assets 842 -4 -15 56 -74 50 855<br />
Internally generated intangible assets 260 2 -48 42 -10 -18 228<br />
Intangible assets subject to amortization 10,583 -39 -79 157 -242 -276 10,104<br />
Intangible assets not subject to amortization 1,741 7 54 2,945 -3,207 -41 1,499<br />
Advance payments on intangible assets 72 – – 137 – -118 91<br />
Intangible assets 12,396 -32 -25 3,239 -3,449 -435 11,694<br />
Real estate and leasehold rights 3,274 8 -15 9 -68 36 3,244<br />
Buildings 8,929 -83 -143 229 -392 467 9,007<br />
Technical equipment, plant and machinery<br />
Other equipment, fixtures, furniture and<br />
99,048 -481 -7,089 2,923 -3,228 4,074 95,247<br />
office equipment<br />
Advance payments and construction<br />
2,185 -12 -358 202 -283 -72 1,662<br />
in progress 10,062 41 65 3,353 -168 -4,514 8,839<br />
Property, plant and equipment 123,498 -527 -7,540 6,716 -4,139 -9 117,999
CEO Letter<br />
E.ON Stock<br />
Combined Group Management <strong>Report</strong><br />
Consolidated Financial Statements<br />
Corporate Governance <strong>Report</strong><br />
Supervisory Board and Board of Management<br />
Tables and Explanations<br />
Accumulated depreciation<br />
Net carrying<br />
amounts<br />
Exchange Changes in<br />
January 1,<br />
rate scope of<br />
December 31, December 31,<br />
<strong>2011</strong> differences consolidation Additions Disposals Transfers Impairment Reversals <strong>2011</strong> <strong>2011</strong><br />
-3,000 1 12 0 0 7 -160 0 -3,140 14,083<br />
-48 – – – 46 – – – -2 4<br />
-1,589 -20 16 -112 78 – -68 – -1,695 538<br />
-1,744 2 – -244 22 410 -145 – -1,699 5,083<br />
-649 2 9 -80 69 -2 – – -651 204<br />
-214 – 47 -15 6 16 – – -160 68<br />
-4,244 -16 72 -451 221 424 -213 0 -4,207 5,897<br />
-80 -2 – – 112 – -138 – -108 1,391<br />
-2 – – – – – -5 – -7 84<br />
-4,326 -18 72 -451 333 424 -356 0 -4,322 7,372<br />
-340 – – -10 24 – -37 2 -361 2,883<br />
-4,666 26 61 -256 326 -1 -293 2 -4,801 4,206<br />
-56,042 175 2,273 -2,823 2,971 2 -2,380 21 -55,803 39,444<br />
-1,556 10 247 -171 271 107 -4 – -1,096 566<br />
-24 -1 – -1 101 – -144 – -69 8,770<br />
-62,628 210 2,581 -3,261 3,693 108 -2,858 25 -62,130 55,869<br />
107
108 Notes<br />
Goodwill, Intangible Assets and Property, Plant and Equipment<br />
Exchange<br />
Acquisition and production costs<br />
Changes in<br />
January 1,<br />
rate scope of<br />
December 31,<br />
€ in millions<br />
2010 differences consolidation Additions Disposals Transfers 2010<br />
Goodwill 20,309 253 -2,910 0 0 -64 17,588<br />
Marketing-related intangible assets 48 – 4 – – – 52<br />
Customer-related intangible assets 2,392 43 -50 1 -56 -20 2,310<br />
Contract-based intangible assets 7,226 174 33 42 -398 42 7,119<br />
Technology-based intangible assets 804 19 -74 53 -57 97 842<br />
Internally generated intangible assets 229 6 2 27 – -4 260<br />
Intangible assets subject to amortization 10,699 242 -85 123 -511 115 10,583<br />
Intangible assets not subject to amortization 1,633 48 4 2,607 -2,500 -51 1,741<br />
Advance payments on intangible assets 52 1 3 39 -5 -18 72<br />
Intangible assets 12,384 291 -78 2,769 -3,016 46 12,396<br />
Real estate and leasehold rights 3,049 199 69 16 -86 27 3,274<br />
Buildings 8,269 148 -453 282 -79 762 8,929<br />
Technical equipment, plant and machinery<br />
Other equipment, fixtures, furniture and<br />
95,186 2,026 -5,393 2,883 -775 5,121 99,048<br />
office equipment<br />
Advance payments and construction<br />
2,360 42 -105 166 -170 -108 2,185<br />
in progress 11,699 311 -1,047 5,088 -127 -5,862 10,062<br />
Property, plant and equipment 120,563 2,726 -6,929 8,435 -1,237 -60 123,498<br />
Goodwill<br />
Led by its Group Management in Düsseldorf, the E.ON Group<br />
has since the beginning of <strong>2011</strong> been organized in global<br />
and regional units that each represent operating segments as<br />
defined by IFRS 8 (see Note 33 for additional details). In the<br />
Changes in Goodwill and in Other Reversals and Impairment Charges by Segment<br />
from January 1, <strong>2011</strong><br />
€ in millions<br />
Generation<br />
Renewables<br />
Gas Trading Germany<br />
Other EU<br />
Countries Russia<br />
Group<br />
Management/Consolidation<br />
E.ON<br />
Group<br />
Net carrying amount of goodwill<br />
as of January 1, <strong>2011</strong> 4,153 2,034 3,569 235 1,043 2,036 1,518 0 14,588<br />
Changes resulting from<br />
acquisitions and disposals -10 12 – – – -382 – – -380<br />
Impairment charges – – – – – -160 – – -160<br />
Other changes1 Net carrying amount of good-<br />
67 15 -11 – – -2 -34 – 35<br />
will as of December 31, <strong>2011</strong> 4,210 2,061 3,558 235 1,043 1,492 1,484 0 14,083<br />
Other non-current assets2 Reversals – 18 3 – – 4 – – 25<br />
Impairment 2,293 146 151 10 126 467 21 – 3,214<br />
1 Other changes include restructuring, transfers and exchange rate differences, as well as reclassifications to assets held for sale.<br />
2 Other non-current assets consist of intangible assets and of property, plant and equipment.<br />
context of this corporate structural reorganization, it became<br />
necessary to reallocate goodwill to the individual units. The<br />
changes in goodwill during the <strong>2011</strong> fiscal year, as well as the<br />
allocation of impairments and reversals for each of the reportable<br />
segments, are shown in the table below:
CEO Letter<br />
E.ON Stock<br />
Combined Group Management <strong>Report</strong><br />
Consolidated Financial Statements<br />
Corporate Governance <strong>Report</strong><br />
Supervisory Board and Board of Management<br />
Tables and Explanations<br />
Accumulated depreciation<br />
Net carrying<br />
amounts<br />
Exchange Changes in<br />
January 1,<br />
rate scope of<br />
December 31, December 31,<br />
2010 differences consolidation Additions Disposals Transfers Impairment Reversals 2010 2010<br />
-3,408 2 1,473 0 0 0 -1,067 0 -3,000 14,588<br />
-47 – -1 – – – – – -48 4<br />
-1,431 -34 23 -122 24 16 -65 – -1,589 721<br />
-1,403 -8 24 -257 393 18 -511 – -1,744 5,375<br />
-582 -16 17 -85 56 -34 -5 – -649 193<br />
-174 -5 -2 -25 – – -8 – -214 46<br />
-3,637 -63 61 -489 473 0 -589 0 -4,244 6,339<br />
-82 -3 3 – 7 – -27 22 -80 1,661<br />
0 – – – – – -2 – -2 70<br />
-3,719 -66 64 -489 480 0 -618 22 -4,326 8,070<br />
-281 -7 16 -10 30 – -89 1 -340 2,934<br />
-4,337 -73 220 -233 33 -224 -53 1 -4,666 4,263<br />
-53,909 -833 1,945 -2,860 470 -37 -861 43 -56,042 43,006<br />
-1,602 -26 73 -174 152 24 -3 – -1,556 629<br />
-107 -2 – -1 – 91 -6 1 -24 10,038<br />
-60,236 -941 2,254 -3,278 685 -146 -1,012 46 -62,628 60,870<br />
Changes in Goodwill and in Other Reversals and Impairment Charges by Segment<br />
from January 1, <strong>2011</strong>—Presentation of Other EU Countries<br />
€ in millions U.K. Sweden Czechia Hungary<br />
Other regional<br />
units<br />
Other EU<br />
Countries<br />
Net carrying amount of goodwill<br />
as of January 1, <strong>2011</strong> 1,250 145 65 76 500 2,036<br />
Changes resulting from acquisitions<br />
and disposals -362 -11 -9 – – -382<br />
Impairment charges – – – – -160 -160<br />
Other changes1 Net carrying amount of good-<br />
9 – -2 -9 – -2<br />
will as of December 31, <strong>2011</strong> 897 134 54 67 340 1,492<br />
Other non-current assets2 Reversals – 1 – 3 – 4<br />
Impairment 13 45 – 173 236 467<br />
1 Other changes include restructuring, transfers and exchange rate differences, as well as reclassifications to assets held for sale.<br />
2 Other non-current assets include intangible assets and property, plant and equipment.<br />
109
110 Notes<br />
Impairments<br />
IFRS 3 prohibits the amortization of goodwill. Instead, goodwill<br />
is tested for impairment at least annually at the level of<br />
the cash-generating units. Goodwill must also be tested for<br />
impairment at the level of individual cash-generating units<br />
between these annual tests if events or changes in circumstances<br />
indicate that the recoverable amount of a par ticular<br />
cash-generating unit might be impaired. Intangible assets<br />
subject to amortization and property, plant and equipment<br />
must generally be tested for impairment whenever there are<br />
particular events or external circumstances indicating the<br />
possibility of impairment.<br />
To perform the impairment tests, the Company first determines<br />
the fair values less costs to sell of its cash-generating units,<br />
which are calculated based on discounted cash flow methods<br />
and verified through the use of suitable multiples, to the extent<br />
available. Market transactions or valuations by third parties<br />
for similar assets or cash-generating units are additionally<br />
taken into account.<br />
Valuations are based on the medium-term corporate planning<br />
authorized by the Board of Management. The calculations<br />
for impairment-testing purposes are generally based on the<br />
three planning years of the medium-term plan plus two additional<br />
detailed planning years. In certain justified exceptional<br />
cases a longer detailed planning period of ten years is used<br />
as the calculation basis, especially when that is required under<br />
a regulatory framework or specific regulatory provisions. The<br />
cash flow assumptions extending beyond the detailed planning<br />
period are determined using unit-specific growth rates that<br />
are based on historical analysis and prospective forecasting.<br />
The growth rates used in <strong>2011</strong> ranged between 1.5 and 3.5 percent<br />
(2010: 1.5 and 3.5 percent). The nominal growth rates are<br />
derived from long-term inflation rates, adjusted for unit-<br />
specific forecasts of changes by the respective business units<br />
(for example, regu latory framework, reinvestment cycles or<br />
growth prospects). The interest rates used for discounting cash<br />
flows are calculated using market data for each cash-generating<br />
unit, and as of December 31, <strong>2011</strong>, ranged between 5.4 and<br />
11.1 percent after taxes (2010: 5.4 and 11.9 percent).<br />
The principal assumptions underlying the determination by<br />
management of recoverable amount are the respective forecasts<br />
for <strong>com</strong>modity market prices, future electricity and gas<br />
prices in the wholesale and retail markets, E.ON’s investment<br />
activity, changes in the regulatory framework, as well as for<br />
rates of growth and capital cost.<br />
The above discussion applies accordingly to the testing for<br />
impairment of intangible assets and of property plant and<br />
equipment, and of groups of these assets. If the goodwill of<br />
a cash-generating unit is <strong>com</strong>bined with assets or groups of<br />
assets for impairment testing, the assets must be tested first.<br />
The recoverable amount primarily used to test a business for<br />
impairment is the fair value less costs to sell; at the Russia<br />
focus region, however, the recoverable amount is based on<br />
the value in use.<br />
As part of the annual testing of goodwill for impairment performed<br />
in the fourth quarter of <strong>2011</strong>, various assets and groups<br />
of assets were included in the testing in response to a series<br />
of triggering events.<br />
In particular, the more pessimistic assessment in contrast to<br />
2010 of long-term power prices, continuing regulatory interventions<br />
and reduced load hours for power plants in Spain<br />
and Italy were material factors influencing the valuation of<br />
activities in Spain and Italy. In Hungary and in the Slovak Republic,<br />
generation volumes and margins have also failed to meet<br />
expectations. In Central Europe, particularly in the Benelux<br />
countries, shutdowns ahead of schedule of generation assets<br />
because of reduced profitability brought about by lower<br />
generation volumes and margins, as well as reduced revenues<br />
from heat-run power plants and the consumer heating business,<br />
had their impact on current valuations.<br />
The tests resulted in the recognition of impairment charges<br />
totaling €3,127 million.
Of this total, an amount of €160 million related to goodwill<br />
written down because fair values less costs to sell within<br />
the “Other regional units” segment were no longer sufficient<br />
to cover their corresponding carrying amounts.<br />
The goodwill of virtually all cash-generating units whose goodwill<br />
is material in relation to the total carrying amount of<br />
all goodwill shows a surplus of recoverable amounts over the<br />
respective carrying amounts and, therefore, based on current<br />
assessment of the economic situation, only a significant change<br />
in the valuation parameters discount rate and growth rate<br />
would necessitate the recognition of goodwill impairment.<br />
Impairments were additionally recognized on property, plant<br />
and equipment in the amount of approximately €2,720 million.<br />
This amount relates primarily to generation assets in the<br />
Generation global unit and breaks down into generating capacity<br />
in Spain (€822 million) and Italy (€768 million), along with<br />
a total of €579 million in four other countries. In the regional<br />
units, impairments had to be recognized at the Hungary<br />
(€173 million) and Netherlands (€163 million) regional units.<br />
These charges related mostly to locally controlled heat-run<br />
power plants.<br />
Moreover, intangible assets had to be written down in the<br />
amount of €247 million, relating primarily to the activities of<br />
the Renewables global unit (€144 million), the Germany<br />
regional unit (€45 million) and the Gas global unit (€29 million).<br />
During the year, in the context of tests performed in response<br />
to triggering events, intangible assets and property, plant and<br />
equipment were written down by €109 million and €138 million,<br />
respectively.<br />
In the context of the 2010 goodwill impairment tests, a total<br />
of €1,067 million in impairment charges had to be recognized<br />
at the former Italy Non- regulated (€957 million) and Spain<br />
(€110 million) cash-generating units. Impairments were additionally<br />
recognized on other non-current assets in the amount<br />
of €1,496 million. This amount included €984 million charged<br />
to property, plant and equipment, primarily at the former<br />
Central Europe (€391 million), Spain (€338 million) and Italy<br />
(€255 million) market units. Impairments had to be recognized<br />
on intangible assets at the former Italy (€430 million)<br />
and Climate & Renewables (€82 million) market units.<br />
Intangible Assets<br />
CEO Letter<br />
E.ON Stock<br />
Combined Group Management <strong>Report</strong><br />
Consolidated Financial Statements<br />
Corporate Governance <strong>Report</strong><br />
Supervisory Board and Board of Management<br />
Tables and Explanations<br />
In <strong>2011</strong>, the Company recorded an amortization expense of<br />
€451 million (2010: €489 million). Impairment charges on<br />
intangible assets, including those already mentioned at the<br />
affected units, amounted to €356 million in <strong>2011</strong> (2010:<br />
€618 million).<br />
Reversals of impairments on intangible assets totaled<br />
€0 million in <strong>2011</strong> (2010: €22 million).<br />
Intangible assets include emission rights from different<br />
trading systems with a carrying amount of €309 million<br />
(2010: €512 million).<br />
€59 million in research and development costs as defined by<br />
IAS 38 were expensed in <strong>2011</strong> (2010: €61 million).<br />
Based on the current amount of intangible assets subject<br />
to amortization, the estimated amortization expense for each<br />
of the five succeeding fiscal years is as follows:<br />
Estimated Aggregated<br />
Amortization Expense<br />
€ in millions<br />
2012 389<br />
2013 332<br />
2014 298<br />
2015 277<br />
2016 265<br />
Total 1,561<br />
As acquisitions and disposals occur in the future, actual<br />
amounts may vary.<br />
As of December 31, <strong>2011</strong>, intangible assets from exploration<br />
activity had carrying amounts of €428 million (2010: €535 million).<br />
Impairment charges of €129 million (2010: €21 million)<br />
were recognized on these intangible assets.<br />
111
112 Notes<br />
Property, Plant and Equipment<br />
Borrowing costs in the amount of €312 million were capitalized<br />
in <strong>2011</strong> (2010: €316 million) as part of the historical cost of<br />
property, plant and equipment.<br />
In <strong>2011</strong>, the Company recorded depreciation of property,<br />
plant and equipment in the amount of €3,261 million (2010:<br />
€3,278 million). Impairment charges, including those relating<br />
to the issues already mentioned, were recognized on property,<br />
plant and equipment in the amount of €2.858 million (2010:<br />
€1,012 million). A total of €25 million in reversals of impairments<br />
on property, plant and equipment was recognized in <strong>2011</strong><br />
(2010: €46 million).<br />
The corresponding payment obligations under finance leases<br />
are due as shown below:<br />
The present value of the minimum lease obligations is reported<br />
primarily under liabilities from leases.<br />
Regarding future obligations under operating leases where<br />
economic ownership is not transferred to E.ON as the lessee,<br />
see Note 27.<br />
E.ON also functions in the capacity of lessor. The lease installments<br />
from operating leases are due as shown in the table<br />
at right:<br />
In <strong>2011</strong> there were restrictions on disposals involving primarily<br />
land and buildings, as well as technical equipment and<br />
machinery, in the amount of €876 million (2010: €719 million).<br />
Certain power plants, gas storage facilities and supply networks<br />
are utilized under finance leases and capitalized in the<br />
E.ON Consolidated Financial Statements because the economic<br />
ownership of the assets leased is attributable to E.ON.<br />
The property, plant and equipment thus capitalized had the<br />
following carrying amounts as of December 31, <strong>2011</strong>:<br />
E.ON as Lessee—Carrying Amounts of Capitalized Lease Assets<br />
€ in millions<br />
December 31<br />
<strong>2011</strong> 2010<br />
Land 4 5<br />
Buildings 35 45<br />
Technical equipment, plant and machinery 695 530<br />
Other equipment, fixtures, furniture and office equipment 92 6<br />
Net carrying amount of capitalized lease assets 826 586<br />
E.ON as Lessee—Payment Obligations under Finance Leases<br />
Minimum lease payments Covered interest share Present values<br />
€ in millions<br />
<strong>2011</strong> 2010 <strong>2011</strong> 2010 <strong>2011</strong> 2010<br />
Due within 1 year 110 48 48 27 62 21<br />
Due in 1 to 5 years 327 183 191 102 136 81<br />
Due in more than 5 years 1,336 655 756 309 580 346<br />
Total 1,773 886 995 438 778 448<br />
E.ON as Lessor—Operating Leases<br />
€ in millions<br />
Nominal value of outstanding lease<br />
installments<br />
<strong>2011</strong> 2010<br />
Due within 1 year 93 93<br />
Due in 1 to 5 years 238 231<br />
Due in more than 5 years 362 412<br />
Total 693 736<br />
See Note 17 for information on receivables from finance leases.
(15) Companies Accounted for under the Equity<br />
Method and Other Financial Assets<br />
The following table shows the structure of the <strong>com</strong>panies<br />
accounted for under the equity method and the other financial<br />
assets as of the dates indicated:<br />
Companies Accounted for under the<br />
Equity Method and Other Financial Assets<br />
December 31<br />
€ in millions<br />
Companies accounted for under the<br />
<strong>2011</strong> 2010<br />
equity method 6,325 6,343<br />
Equity investments 1,908 2,201<br />
Non-current securities 4,904 3,903<br />
Total 13,137 12,447<br />
Companies accounted for under the equity method consist<br />
solely of associates and joint ventures. The balance sheet<br />
and earnings data of the ten joint ventures are not material<br />
on aggregate.<br />
The amount shown for non-current securities relates primarily<br />
to fixed-in<strong>com</strong>e securities.<br />
In <strong>2011</strong>, impairment charges on <strong>com</strong>panies accounted for under<br />
the equity method amounted to €142 million (2010: €145 million)<br />
and impairments on other financial assets amounted to<br />
€108 million (2010: €55 million). The carrying amount of other<br />
financial assets with impairment losses was €191 million as<br />
of the end of the fiscal year (2010: €250 million).<br />
€473 million (2010: €393 million) in non-current securities is<br />
restricted for the fulfillment of legal insurance obligations<br />
of VKE (see Note 31).<br />
CEO Letter<br />
E.ON Stock<br />
Combined Group Management <strong>Report</strong><br />
Consolidated Financial Statements<br />
Corporate Governance <strong>Report</strong><br />
Supervisory Board and Board of Management<br />
Tables and Explanations<br />
Shares in Companies Accounted for under the<br />
Equity Method<br />
The financial information below summarizes the most important<br />
in<strong>com</strong>e statement and balance sheet data for the <strong>com</strong>panies<br />
that are accounted for under the equity method.<br />
Earnings Data for Companies Accounted<br />
for under the Equity Method<br />
€ in millions <strong>2011</strong> 2010<br />
Sales 19,622 21,737<br />
Net in<strong>com</strong>e/loss 2,335 2,674<br />
Balance Sheet Data for Companies<br />
Accounted for under the Equity Method<br />
December 31<br />
€ in millions<br />
<strong>2011</strong> 2010<br />
Non-current assets 28,740 23,764<br />
Current assets 7,606 9,408<br />
Provisions 4,981 5,990<br />
Liabilities 16,613 14,275<br />
Equity 14,752 12,907<br />
Investment in<strong>com</strong>e generated from <strong>com</strong>panies accounted for<br />
under the equity method amounted to €682 million in <strong>2011</strong><br />
(2010: €783 million).<br />
The carrying amounts of <strong>com</strong>panies accounted for under the<br />
equity method whose shares are marketable totaled €329 million<br />
in <strong>2011</strong> (2010: €313 million). The fair value of E.ON’s share<br />
in these <strong>com</strong>panies was €274 million (2010: €277 million).<br />
Additions of investments in <strong>com</strong>panies accounted for under<br />
the equity method resulted in a total goodwill of €9 million<br />
in <strong>2011</strong> (2010: €17 million).<br />
Investments in associated <strong>com</strong>panies totaling €757 million<br />
(2010: €509 million) were restricted because they were pledged<br />
as collateral for financing as of the balance sheet date.<br />
113
114 Notes<br />
(16) Inventories<br />
The following table provides a breakdown of inventories as<br />
of the dates indicated:<br />
Inventories<br />
December 31<br />
€ in millions<br />
<strong>2011</strong> 2010<br />
Raw materials and supplies 2,160 2,163<br />
Goods purchased for resale 2,488 1,614<br />
Work in progress and finished products 180 287<br />
Total 4,828 4,064<br />
Raw materials, goods purchased for resale and finished<br />
products are generally valued at average cost.<br />
Write-downs totaled €120 million in <strong>2011</strong> (2010: €18 million).<br />
Reversals of write-downs amounted to €11 million in <strong>2011</strong><br />
(2010: €7 million). The carrying amount of inventories recognized<br />
at net realizable value was €65 million (2010: €15 million).<br />
No inventories have been pledged as collateral.<br />
(17) Receivables and Other Assets The following table lists receivables and other assets by<br />
remaining time to maturity as of the dates indicated:<br />
Receivables and Other Assets<br />
December 31, <strong>2011</strong> December 31, 2010<br />
NonNon-<br />
€ in millions<br />
Current current Current current<br />
Receivables from finance leases 78 973 62 896<br />
Other financial receivables and financial assets 1,711 2,646 1,612 2,461<br />
Financial receivables and other financial assets 1,789 3,619 1,674 3,357<br />
Trade receivables 18,065 – 15,819 –<br />
Receivables from derivative financial instruments 9,863 1,901 7,567 3,068<br />
Other operating assets 3,786 941 4,106 954<br />
Trade receivables and other operating assets 31,714 2,842 27,492 4,022<br />
Total 33,503 6,461 29,166 7,379<br />
As of December 31, <strong>2011</strong>, other financial assets include receivables<br />
from owners of non-controlling interests in jointly owned<br />
power plants of €62 million (2010: €104 million) and margin<br />
account deposits for futures trading of €988 million (2010:<br />
€572 million). In addition, based on the provisions of IFRIC 5,<br />
other financial assets include a claim for a refund from the<br />
Swedish Nuclear Waste Fund in the amount of €1,595 million<br />
(2010: €1,498 million) in connection with the de<strong>com</strong>missioning<br />
of nuclear power plants and nuclear waste disposal. Since<br />
this asset is designated for a particular purpose, E.ON’s access<br />
to it is restricted.<br />
The aging schedule of trade receivables is presented in the<br />
table at right:<br />
Aging Schedule of Trade Receivables<br />
€ in millions <strong>2011</strong> 2010<br />
Total trade receivables 18,065 15,819<br />
Not impaired and not yet due 16,393 13,838<br />
Not impaired and up to 60 days past-due 1,050 1,217<br />
Not impaired and 61 to 90 days past-due 114 108<br />
Not impaired and 91 to 180 days past-due 173 199<br />
Not impaired and 181 to 360 days past-due 78 118<br />
Not impaired and over 360 days past-due 52 63<br />
Net value of impaired receivables 205 276
The individual impaired receivables are due from a large<br />
number of retail customers from whom it is unlikely that full<br />
repayment will ever be received. Receivables are monitored<br />
within the various units.<br />
Valuation allowances for trade receivables have changed as<br />
shown in the following table:<br />
The present value of the outstanding lease payments is<br />
reported under receivables from finance leases.<br />
(18) Liquid Funds<br />
The following table provides a breakdown of liquid funds by<br />
original maturity as of the dates indicated:<br />
CEO Letter<br />
E.ON Stock<br />
Combined Group Management <strong>Report</strong><br />
Consolidated Financial Statements<br />
Corporate Governance <strong>Report</strong><br />
Supervisory Board and Board of Management<br />
Tables and Explanations<br />
Valuation Allowances for Trade Receivables<br />
€ in millions <strong>2011</strong> 2010<br />
Balance as of January 1 -840 -747<br />
Change in scope of consolidation 17 6<br />
Write-downs -346 -380<br />
Reversals of write-downs 75 58<br />
Disposals 216 219<br />
Other1 18 4<br />
Balance as of December 31 -860 -840<br />
1 “Other” includes currency translation adjustments.<br />
Receivables from finance leases are primarily the result of<br />
certain electricity delivery contracts that must be treated as<br />
leases according to IFRIC 4. The nominal and present values of<br />
the outstanding lease payments have the following due dates:<br />
E.ON as Lessor—Finance Leases<br />
Gross investment in<br />
finance lease<br />
Unrealized interest Present value of minimum<br />
arrangements<br />
in<strong>com</strong>e<br />
lease payments<br />
€ in millions<br />
<strong>2011</strong> 2010 <strong>2011</strong> 2010 <strong>2011</strong> 2010<br />
Due within 1 year 147 138 69 76 78 62<br />
Due in 1 to 5 years 612 565 278 251 334 314<br />
Due in more than 5 years 1,060 947 421 365 639 582<br />
Total 1,819 1,650 768 692 1,051 958<br />
Liquid Funds<br />
December 31<br />
€ in millions<br />
<strong>2011</strong> 2010<br />
Securities and fixed-term deposits<br />
Current securities with an<br />
3,079 1,697<br />
original maturity greater than 3 months<br />
Fixed-term deposits with an<br />
2,734 1,397<br />
original maturity greater than 3 months 345 300<br />
Restricted cash and cash equivalents 89 433<br />
Cash and cash equivalents 3,852 6,143<br />
Total 7,020 8,273<br />
In <strong>2011</strong>, there was €1 million in restricted cash (2010: €0 million)<br />
with a maturity greater than three months.<br />
Current securities with an original maturity greater than three<br />
months include €98 million (2010: €89 million) in secu rities held<br />
by VKE that are restricted for the fulfillment of legal insurance<br />
obligations (see Note 31).<br />
Cash and cash equivalents include €2,962 million (2010:<br />
€3,295 million) in checks, cash on hand and balances in<br />
Bundesbank accounts and at other financial institutions with<br />
an original maturity of less than three months, to the extent<br />
that they are not restricted.<br />
115
116 Notes<br />
(19) Capital Stock<br />
The capital stock is subdivided into 2,001,000,000 registered<br />
ordinary shares with no par value (“no-par-value shares”) and<br />
amounts to €2,001,000,000 (2010: €2,001,000,000).<br />
Pursuant to a resolution by the <strong>Annual</strong> Shareholders Meeting<br />
of May 6, 2010, the Company is authorized to purchase own<br />
shares until May 5, 2015. The shares purchased, <strong>com</strong>bined with<br />
other treasury shares in the possession of the Company, or<br />
attributable to the Company pursuant to Sections 71a et seq.<br />
AktG, may at no time exceed 10 percent of its capital stock.<br />
The Board of Management was authorized at the aforementioned<br />
<strong>Annual</strong> Shareholders Meeting to cancel any shares thus<br />
acquired without requiring a separate shareholder resolution<br />
for the cancellation or its implementation. The total number of<br />
outstanding shares as of December 31, <strong>2011</strong>, was 1,905,470,135<br />
(December 31, 2010: 1,905,408,843). As of December 31, <strong>2011</strong>,<br />
E.ON AG and one of its subsidiaries held a total of 95,529,865<br />
treasury shares (December 31, 2010: 95,591,157) having a book<br />
value of €3,530 million (equivalent to 4.78 percent or €95,529,865<br />
of the capital stock). 1,150,000 shares were purchased on the<br />
market and 60,014 treasury shares were used for the employee<br />
stock purchase program and distributed to employees in <strong>2011</strong><br />
(2010: 980,897 shares purchased on the market). See also Note<br />
11 for information on the distribution of shares under the<br />
employee stock purchase program. An additional 1,278 treasury<br />
shares (2010: 1,129 shares) were also distributed to employees.<br />
The Company has further been authorized by the <strong>Annual</strong> Shareholders<br />
Meeting to buy shares using put or call options, or a<br />
<strong>com</strong>bination of both. When derivatives in the form of put or<br />
call options, or a <strong>com</strong>bination of both, are used to acquire<br />
shares, the option transactions must be conducted at market<br />
terms with a financial institution or on the market. No shares<br />
were acquired in <strong>2011</strong> using this purchase model.<br />
Authorized Capital<br />
By shareholder resolution adopted at the <strong>Annual</strong> Shareholders<br />
Meeting of May 6, 2009, the Board of Management was authorized,<br />
subject to the Supervisory Board’s approval, to increase<br />
the Company’s capital stock by up to €460 million (“Authorized<br />
Capital pursuant to Sections 202 et seq. AktG”) through<br />
one or more issuances of new registered ordinary shares in<br />
return for contributions in cash and/or in kind (with the option<br />
to restrict shareholders’ subscription rights). This capital<br />
increase is authorized until May 5, 2014. Subject to the Supervisory<br />
Board’s approval, the Board of Management is authorized<br />
to exclude shareholders’ subscription rights.<br />
Conditional Capital<br />
At the <strong>Annual</strong> Shareholders Meeting of May 6, 2010, shareholders<br />
approved a conditional increase of the capital stock<br />
(with the option to exclude shareholders’ subscription rights)<br />
in the amount of €175 million, which is authorized until May 5,<br />
2015. The conditional capital increase will be implemented<br />
only to the extent required to fulfill the obligations arising on<br />
the exercise by holders of conversion and option rights, and<br />
those arising from <strong>com</strong>pliance with the mandatory conversion<br />
of bonds with conversion or option rights, participation rights<br />
and in<strong>com</strong>e bonds that have been issued or guaranteed by<br />
E.ON AG or by an E.ON AG Group <strong>com</strong>pany as defined by Section<br />
18 AktG, and to the extent that no cash settlement has<br />
been granted in lieu of conversion and no E.ON AG treasury<br />
shares or shares of another listed <strong>com</strong>pany have been used<br />
to service the rights. The conditional capital has not been used.<br />
Voting Rights<br />
The following notices pursuant to Section 21 (1) of the German<br />
Securities Trading Act (“WpHG”) concerning changes in voting<br />
rights have been received:<br />
Information on Stockholders of E.ON AG<br />
Threshold Gained voting<br />
Voting rights<br />
Stockholder Date of notice exceeded rights on Allocation Percentages Absolute<br />
Government of Norway1 Jan. 9, 2009 5% Dec. 31, 2008 direct/indirect 5.91 118,276,492<br />
BlackRock Inc. New York, U.S. 2 March 25, <strong>2011</strong> 5% March 18, <strong>2011</strong> indirect 5.01 100,145,589<br />
1 4.17 percent (83,455,839 votes) are attributable to the government of Norway pursuant to Section 22 (1), sentence 1, no. 1, WpHG; 1.74 percent (34,720,645 votes) pursuant to<br />
Section 22 (1), sentence 1, nos. 1 and 2, WpHG; and 0.005 percent (100,008 votes) pursuant to Section 22 (1), sentence 1, nos. 1, 2 (in conjunction with sentence 2) and 6 (in<br />
conjunction with sentence 2), WpHG.<br />
2 5.01 percent (100,145,589 votes) are attributable to this <strong>com</strong>pany pursuant to Section 22 (1), sentence 1, no. 6, WpHG.
(20) Additional Paid-in Capital<br />
As of December 31, <strong>2011</strong>, additional paid-in capital stands<br />
unchanged at €13,747 million (2010: €13,747 million).<br />
(21) Retained Earnings<br />
The following table breaks down the E.ON Group’s retained<br />
earnings as of the dates indicated:<br />
Retained Earnings<br />
December 31<br />
€ in millions<br />
<strong>2011</strong> 2010<br />
Legal reserves 45 45<br />
Other retained earnings 23,751 28,981<br />
Total 23,796 29,026<br />
Under German securities law, E.ON AG shareholders may<br />
receive distributions from the balance sheet profit of E. ON AG<br />
reported as available for distribution in accordance with the<br />
German Commercial Code.<br />
(22) Changes in Other Comprehensive In<strong>com</strong>e<br />
The remaining stake in Gazprom was sold in the first quarter<br />
of <strong>2011</strong>. Approximately €0.6 billion (2010: approx. €2 billion)<br />
was reclassified in connection with this disposal and recognized<br />
in in<strong>com</strong>e. Ownership interests classified as held for<br />
sale did not constitute significant <strong>com</strong>ponents of other <strong>com</strong>prehensive<br />
in<strong>com</strong>e in <strong>2011</strong> (2010: €653 million).<br />
CEO Letter<br />
E.ON Stock<br />
Combined Group Management <strong>Report</strong><br />
Consolidated Financial Statements<br />
Corporate Governance <strong>Report</strong><br />
Supervisory Board and Board of Management<br />
Tables and Explanations<br />
As of December 31, <strong>2011</strong>, German-GAAP retained earnings<br />
totaled €3,109 million (2010: €3,017 million). Of this amount,<br />
legal reserves of €45 million (2010: €45 million) are restricted<br />
pursuant to Section 150 (3) and (4) AktG.<br />
Accordingly, the amount of retained earnings available for<br />
distribution in principle is €3,064 million (2010: €2,972 million).<br />
A proposal to distribute a cash dividend for <strong>2011</strong> of €1.00 per<br />
share will be submitted to the <strong>Annual</strong> Shareholders Meeting.<br />
A cash dividend of €1.50 per share was paid for 2010. Based<br />
on E.ON AG’s <strong>2011</strong> year-end closing share price, the dividend<br />
yield is 6.0 percent. Based on a €1.00 dividend, the total profit<br />
distribution is €1,905 million.<br />
The table below illustrates the share of OCI attributable to<br />
<strong>com</strong>panies accounted for under the equity method.<br />
Share of OCI Attributable to Companies<br />
Accounted for under the Equity Method<br />
€ in millions <strong>2011</strong> 2010<br />
Balance as of December 31 (before taxes) 327 408<br />
Taxes – –<br />
Balance as of December 31 (after taxes) 327 408<br />
117
118 Notes<br />
(23) Non-Controlling Interests<br />
Non-controlling interests by segment as of the dates indicated<br />
are shown in the table below.<br />
Non-Controlling Interests<br />
December 31<br />
€ in millions<br />
<strong>2011</strong> 2010<br />
Generation 303 384<br />
Renewables 7 23<br />
Gas 47 48<br />
Trading – –<br />
Germany 2,221 2,223<br />
Other EU Countries 535 517<br />
Russia 764 738<br />
Group Management/Consolidation -1 -1<br />
Total 3,876 3,932<br />
(24) Provisions for Pensions and Similar<br />
Obligations<br />
The retirement benefit obligations toward the employees<br />
of the E.ON Group, which amounted to €14.6 billion, were<br />
covered by plan assets having a fair value of €11.4 billion as<br />
of December 31, <strong>2011</strong>. This corresponds to a funded status<br />
of 78 percent.<br />
The decrease in non-controlling interests in <strong>2011</strong> resulted primarily<br />
from sales at the Generation unit in the United Kingdom,<br />
which were partially offset by improved results in Russia.<br />
The table below illustrates the share of OCI that is attributable<br />
to non-controlling interests.<br />
Share of OCI Attributable to<br />
Non-Controlling Interests<br />
December 31<br />
€ in millions<br />
<strong>2011</strong> 2010<br />
Cash flow hedges 2 3<br />
Available-for-sale securities 9 11<br />
Currency translation adjustments<br />
Changes in actuarial gains/losses of<br />
defined benefit pension plans and<br />
-247 -229<br />
similar obligations -11 13<br />
Total -247 -202<br />
In addition to the reported plan assets, Versorgungskasse<br />
Energie (“VKE”) administers another pension fund holding<br />
assets of €0.6 billion (2010: €0.6 billion) that do not constitute<br />
plan assets under IAS 19 but which nevertheless are for the<br />
most part intended for the coverage of employee retirement<br />
benefits at E.ON Group <strong>com</strong>panies in Germany (see Note 31).<br />
In recent years, the funded status, measured as the difference<br />
between the defined benefit obligation and the fair value of<br />
plan assets, has changed as follows:<br />
Five-Year History of the Funded Status<br />
€ in millions<br />
<strong>2011</strong> 2010<br />
December 31<br />
2009 2008 2007<br />
Defined benefit obligation 14,607 16,514 16,087 14,096 15,936<br />
Fair value of plan assets -11,359 -13,263 -13,205 -11,034 -13,056<br />
Funded status 3,248 3,251 2,882 3,062 2,880
Description of the Benefit Obligations<br />
In addition to their entitlements under government retirement<br />
systems and the in<strong>com</strong>e from private retirement planning,<br />
most E.ON Group employees are also covered by occupational<br />
retirement plans.<br />
Both defined benefit plans and defined contribution plans<br />
are in place at E.ON. The majority of the benefit obligations<br />
reported consists of obligations of E.ON Group <strong>com</strong>panies<br />
in which the retirement pension is calculated either on the<br />
salaries earned during the most recent years of service<br />
(final-pay arrangements) or on a scale of fixed amounts.<br />
In order to avoid exposure to future risks from occupational<br />
retirement plans, newly designed pension plans were introduced<br />
at the major German and foreign E.ON Group <strong>com</strong>panies<br />
beginning in 1998. Virtually all new hires at E.ON Group <strong>com</strong>panies,<br />
particularly in Germany, the United Kingdom and Spain,<br />
are now covered by benefit plans whose future risks can be<br />
Foreign benefit obligations relate almost entirely to the<br />
benefit plans at E.ON Group <strong>com</strong>panies in the United Kingdom<br />
(<strong>2011</strong>: €4,547 million; 2010: €6,867 million) and in Spain<br />
(<strong>2011</strong>: €415 million; 2010: €407 million). The portion of the entire<br />
benefit obligation allocated to post-employment health care<br />
benefits amounted to €15 million (2010: €15 million).<br />
The reduction in foreign benefit obligations is due primarily<br />
to the disposal in <strong>2011</strong> of Central Networks; the disposal is<br />
shown in the table under “Changes in scope of consolidation.”<br />
CEO Letter<br />
E.ON Stock<br />
Combined Group Management <strong>Report</strong><br />
Consolidated Financial Statements<br />
Corporate Governance <strong>Report</strong><br />
Supervisory Board and Board of Management<br />
Tables and Explanations<br />
calculated and controlled. In addition, the final-pay arrangements<br />
for existing employees at the Group’s German <strong>com</strong>panies<br />
were largely converted into a newly designed benefit<br />
plan beginning in 2004.<br />
The provisions for pensions and similar obligations also include<br />
minor provisions for obligations from the assumption of<br />
costs for post-employment health care benefits, which are<br />
granted primarily at E.ON Group <strong>com</strong>panies in Spain.<br />
In pure defined contribution plans, the Company discharges<br />
its obligations toward employees when it pays agreed contribution<br />
amounts into funds managed by external insurers or<br />
similar institutions.<br />
Changes in the Benefit Obligations<br />
The following table shows the changes in the present value<br />
of the defined benefit obligation for the periods indicated:<br />
Changes in the Defined Benefit Obligation<br />
<strong>2011</strong> 2010<br />
€ in millions<br />
Total Domestic Foreign Total Domestic Foreign<br />
Defined benefit obligation as of January 1 16,514 9,058 7,456 16,087 8,285 7,802<br />
Employer service cost 239 157 82 241 147 94<br />
Interest cost 724 440 284 840 446 394<br />
Changes in scope of consolidation -2,647 -18 -2,629 -913 1 -914<br />
Past service cost 19 16 3 32 16 16<br />
Actuarial gains (-)/losses 442 291 151 800 567 233<br />
Exchange rate differences 66 – 66 205 – 205<br />
Employee contributions 2 – 2 4 – 4<br />
Pensions paid -749 -489 -260 -838 -474 -364<br />
Settlements -1 – -1 – – –<br />
Other -2 – -2 56 70 -14<br />
Defined benefit obligation as of December 31 14,607 9,455 5,152 16,514 9,058 7,456<br />
Actuarial losses in <strong>2011</strong> are attributable in large part to the<br />
decrease in the discount rates used for the E.ON Group <strong>com</strong>panies<br />
in Germany and in the United Kingdom. They were<br />
partly offset by a reduction in the salary increase rate affecting<br />
the German E.ON Group <strong>com</strong>panies and by lower salary and<br />
pension increase rates determined for the E.ON Group <strong>com</strong>panies<br />
in the United Kingdom.<br />
119
120 Notes<br />
The actuarial assumptions used to measure the defined benefit<br />
obligations at E.ON’s German and U.K. subsidiaries as of<br />
the respective balance sheet date are as follows:<br />
Actuarial Assumptions<br />
December 31, <strong>2011</strong> December 31, 2010<br />
Percentages<br />
Germany U.K. Germany U.K.<br />
Discount rate 4.75 4.60 5.00 5.40<br />
Salary increase rate 2.50 3.40 2.75 4.00<br />
Pension increase rate1 2.00 2.80 2.00 3.30<br />
Expected rate of return on plan assets 4.70 4.90 4.70 5.80<br />
1 The pension increase rate for Germany applies to eligible individuals not subject to a one-percent pension increase rate.<br />
The net periodic pension cost is calculated for the E. ON Group<br />
<strong>com</strong>panies in Germany and in the United Kingdom on the<br />
basis of the actuarial assumptions that were determined for<br />
the preceding balance sheet date:<br />
Actuarial Assumptions<br />
<strong>2011</strong> 2010<br />
Percentages<br />
Germany U.K. Germany U.K.<br />
Discount rate 5.00 5.40 5.50 5.70<br />
Salary increase rate 2.75 4.00 2.75 4.00<br />
Pension increase rate1 2.00 3.30 2.00 3.30<br />
Expected rate of return on plan assets 4.70 5.80 4.70 6.10<br />
1 The pension increase rate for Germany applies to eligible individuals not subject to a one-percent pension increase rate.<br />
In addition, there are pension funds in Germany for which<br />
an expected rate of return on plan assets of 4.50 percent<br />
(2010: 4.50 percent; 2009: 4.50 percent) is used as a basis for<br />
the respective subsequent fiscal year.<br />
To measure the E.ON Group’s occupational pension obligations<br />
for accounting purposes, the Company has employed the<br />
current versions of the biometric tables recognized in each<br />
respective country for the calculation of pension obligations.<br />
Other <strong>com</strong>pany-specific actuarial assumptions, including<br />
employee fluctuation, have also been included in the<br />
<strong>com</strong>putations.<br />
The discount rate assumptions used by E.ON basically reflect<br />
the currency-specific rates available at the end of the respective<br />
fiscal year for high-quality fixed-rate corporate bonds with<br />
a duration corresponding to the average period to maturity<br />
of the respective pension benefit obligations.<br />
At the E.ON Group, a uniform increase or decrease of 0.5 percentage<br />
points in the discount rates would change the present<br />
value of the defined benefit obligation by -€961 million and<br />
+€1,075 million, respectively, as of December 31, <strong>2011</strong>.
Description of Plan Assets<br />
Defined benefit pension plans in the Group’s <strong>com</strong>panies, be<br />
they within or outside of Germany, are mostly funded through<br />
the accumulation of plan assets in specially created pension<br />
vehicles that legally are distinct from the Company.<br />
Under the Contractual Trust Arrangement (CTA) established for<br />
the German subsidiaries, plan assets totaling €6,257 million on<br />
December 31, <strong>2011</strong>, (2010: €6,415 million) are administered by<br />
E.ON Pension Trust e.V. on a fiduciary basis. The remainder of<br />
the domestic plan assets in the amount of €269 million (2010:<br />
€283 million) is held primarily by pension funds in Germany.<br />
The foreign plan assets, which totaled €4,833 million as of<br />
December 31, <strong>2011</strong> (2010: €6,565 million), are dedicated<br />
primarily to the funding of the pension plans at E.ON Group<br />
The €0.6 billion (2010: €0.6 billion) in non-current securities<br />
and liquid funds administered by VKE are not included in the<br />
determination of the funded status as of December 31, <strong>2011</strong>,<br />
since they do not constitute plan assets under IAS 19. These<br />
assets, the majority of which is dedicated to the coverage of<br />
benefit obligations toward employees of German E.ON Group<br />
<strong>com</strong>panies, must additionally be taken into consideration for<br />
a <strong>com</strong>plete evaluation of the funded status of the E. ON Group’s<br />
benefit obligations.<br />
CEO Letter<br />
E.ON Stock<br />
Combined Group Management <strong>Report</strong><br />
Consolidated Financial Statements<br />
Corporate Governance <strong>Report</strong><br />
Supervisory Board and Board of Management<br />
Tables and Explanations<br />
<strong>com</strong>panies in the United Kingdom and in Spain. The plan<br />
assets of the E.ON Group <strong>com</strong>panies in the U.K. are managed<br />
mostly by independent pension trusts and, as of December 31,<br />
<strong>2011</strong>, amounted to €4,467 million (2010: €6,212 million). The<br />
assets covering E.ON’s Spanish pension plans and totaling<br />
€325 million (2010: €312 million) consist almost entirely of<br />
qualifying insurance policies, which constitute plan assets<br />
under IAS 19. Because of the disposal of Central Networks in<br />
<strong>2011</strong>, the foreign plan assets as of December 31, <strong>2011</strong>, are<br />
reduced accordingly.<br />
The changes in the fair value of the plan assets covering the<br />
benefit obligation for the defined benefit pension plans are<br />
shown in the following table:<br />
Changes in Plan Assets<br />
<strong>2011</strong> 2010<br />
€ in millions<br />
Total Domestic Foreign Total Domestic Foreign<br />
Fair value of plan assets as of January 1 13,263 6,698 6,565 13,205 6,779 6,426<br />
Expected return on plan assets 581 314 267 673 313 360<br />
Employer contributions 631 201 430 294 100 194<br />
Employee contributions 2 – 2 4 – 4<br />
Changes in scope of consolidation -2,540 -6 -2,534 -507 – -507<br />
Actuarial gains/losses (-) 72 -212 284 221 -40 261<br />
Exchange rate differences 70 – 70 179 – 179<br />
Pensions paid -719 -469 -250 -807 -454 -353<br />
Settlements -1 – -1 – – –<br />
Other – – – 1 – 1<br />
Fair value of plan assets as of December 31 11,359 6,526 4,833 13,263 6,698 6,565<br />
A small portion of the plan assets consists of financial instruments<br />
of E.ON (<strong>2011</strong>: €0.7 billion; 2010: €0 billion). Because<br />
of the contractual structure, however, the share of plan assets<br />
attributable to E. ON’s own financial instruments does not<br />
constitute an E.ON-specific risk to the CTA. The plan assets further<br />
include virtually no owner-occupied real estate or equity or<br />
additional debt instruments issued by E.ON Group <strong>com</strong>panies.<br />
The principal investment objective for the plan assets is to<br />
provide full coverage of benefit obligations at all times for<br />
the payments due under the corresponding pension plans.<br />
121
122 Notes<br />
To implement the investment objective, the E.ON Group generally<br />
pursues a liability-driven investment (LDI) approach that<br />
takes into account the structure of the benefit obligations.<br />
This long-term LDI strategy seeks to manage the funded status,<br />
with the result that any changes in the defined benefit<br />
obli gation, especially those caused by fluctuating inflation and<br />
interest rates are, to a certain degree, covered by simultaneous<br />
corresponding changes in the fair value of plan assets. The<br />
LDI strategy may also involve the use of derivatives (for example,<br />
interest rate swaps and inflation swaps). In order to<br />
improve the funded status of the E.ON Group as a whole, a portion<br />
of the plan assets will also be invested in a diversified<br />
portfolio of asset classes that are expected to provide for longterm<br />
returns in excess of those of fixed-in<strong>com</strong>e investments.<br />
Provisions for Pensions and Similar Obligations<br />
The E.ON Group’s recognized net obligation is derived from<br />
the difference between the present value of the defined<br />
bene fit obligation and the fair value of plan assets, adjusted<br />
for unrecognized past service cost, and is determined as<br />
shown in the following table:<br />
The determination of the target portfolio structure for the<br />
individual plan assets is based on regular asset-liability studies.<br />
In these studies, the target portfolio structure is reviewed<br />
under consideration of existing investment principles, the current<br />
level of financing of existing benefit obligations, the<br />
condition of the capital markets and the structure of the benefit<br />
obligations, and is adjusted as necessary. The expected<br />
long-term returns for the individual plan assets are derived<br />
from the portfolio structure targeted and from the expected<br />
long-term returns for the individual asset classes in the assetliability<br />
studies.<br />
Plan assets were invested in the asset classes shown in the<br />
following table as of the dates indicated:<br />
Classification of Plan Assets<br />
December 31, <strong>2011</strong> December 31, 2010<br />
Percentages<br />
Total Domestic Foreign Total Domestic Foreign<br />
Equity securities 11 13 8 16 13 18<br />
Debt securities 64 65 63 66 70 62<br />
Real estate 9 12 6 9 11 7<br />
Other 16 10 23 9 6 13<br />
Derivation of the Provisions for Pensions and Similar Obligations<br />
€ in millions<br />
December 31<br />
<strong>2011</strong> 2010<br />
Defined benefit obligation—fully or partially funded by plan assets 14,128 16,080<br />
Fair value of plan assets -11,359 -13,263<br />
Defined benefit obligation—unfunded plans 479 434<br />
Funded status 3,248 3,251<br />
Unrecognized past service cost -9 -11<br />
Net amount recognized 3,239 3,240<br />
Operating receivables -6 -10<br />
Provisions for pensions and similar obligations 3,245 3,250
Taking into account periodic additions and pension payments,<br />
as well as the net actuarial losses in the present value of all<br />
defined benefit obligations and in the fair value of plan assets,<br />
including the provisions for pensions eliminated mainly through<br />
the disposal of Central Networks, the recognized net obligation<br />
remains virtually unchanged from its level on December 31, 2010.<br />
Contributions and Pension Payments<br />
In <strong>2011</strong>, E.ON made employer contributions to plan assets<br />
totaling €631 million (2010: €294 million) to fund existing<br />
defined benefit obligations.<br />
For 2012, it is expected that overall employer contributions<br />
to plan assets will amount to a total of €593 million and<br />
primarily involve the funding of new and existing benefit<br />
obligations, with an amount of €216 million attributable to<br />
foreign <strong>com</strong>panies.<br />
CEO Letter<br />
E.ON Stock<br />
Combined Group Management <strong>Report</strong><br />
Consolidated Financial Statements<br />
Corporate Governance <strong>Report</strong><br />
Supervisory Board and Board of Management<br />
Tables and Explanations<br />
Pension payments to cover defined benefit obligations totaled<br />
€749 million in <strong>2011</strong> (2010: €838 million). Prospective pension<br />
payments under the defined benefit plans existing as of<br />
December 31, <strong>2011</strong>, for the next ten years are shown in the<br />
following table:<br />
Prospective Pension Payments<br />
€ in millions Total Domestic Foreign<br />
2012 727 494 233<br />
2013 741 505 236<br />
2014 755 513 242<br />
2015 770 519 251<br />
2016 785 533 252<br />
2017–2021 4,179 2,885 1,294<br />
Total 7,957 5,449 2,508<br />
Pension Cost<br />
The net periodic pension cost for defined benefit pension<br />
plans included in the provisions for pensions and similar obligations<br />
as well as in operating receivables is shown in the<br />
table below:<br />
Net Periodic Pension Cost<br />
<strong>2011</strong> 2010<br />
€ in millions<br />
Total Domestic Foreign Total Domestic Foreign<br />
Employer service cost 239 157 82 241 147 94<br />
Interest cost 724 440 284 840 446 394<br />
Expected return on plan assets -581 -314 -267 -673 -313 -360<br />
Recognized past service cost 21 16 5 29 16 13<br />
Total 403 299 104 437 296 141<br />
123
124 Notes<br />
Actuarial gains and losses are accrued and recognized in full.<br />
They are reported outside of the in<strong>com</strong>e statement as part of<br />
equity in the Statements of Recognized In<strong>com</strong>e and Expenses.<br />
The actual return on plan assets was a gain of €653 million<br />
in <strong>2011</strong> (2010: €894 million gain).<br />
In addition to the total net periodic pension cost, an amount<br />
of €71 million in fixed contributions to external insurers or<br />
similar institutions was paid in <strong>2011</strong> (2010: €74 million) for<br />
pure defined contribution pension plans.<br />
The total net periodic pension cost shown includes an amount<br />
of €0.8 million in <strong>2011</strong> (2010: €0.9 million) for health care<br />
benefits. A one-percentage-point increase or decrease in the<br />
assumed health care cost trend rate would affect the interest<br />
and service <strong>com</strong>ponents and result in a change in net periodic<br />
pension cost of +€0.2 million or -€0.1 million (2010: +€0.2 million<br />
or -€0.1 million), respectively. The corresponding accumulated<br />
post-employment benefit obligation would change by<br />
+€2.4 million or -€1.9 million (2010: +€2.3 million or -€1.9 million),<br />
respectively.<br />
The experience adjustments reflect the effects on the benefit<br />
obligations and plan assets at the E.ON Group that result<br />
from differences between the actual changes in these amounts<br />
from the assumptions made with respect to these changes<br />
at the beginning of the fiscal year. In the measurement of the<br />
benefit obligations, these include in particular increases in<br />
salaries and pensions, employee fluctuation and biometric data<br />
such as death and disability.<br />
The changes in actuarial gains and losses from defined benefit<br />
obligations and corresponding plan assets recognized in<br />
equity are shown in the following table:<br />
Accumulated Actuarial Gains and<br />
Losses Recognized in Equity<br />
€ in millions<br />
Accumulated actuarial gains (+)<br />
and losses (-) recognized in equity<br />
<strong>2011</strong> 2010<br />
as of January 1<br />
Recognition in equity of current-year<br />
-584 138<br />
actuarial gains (+) and losses (-)<br />
Accumulated actuarial gains (+)<br />
and losses (-) recognized in equity<br />
-370 -722<br />
as of December 31 -954 -584<br />
In the years 2007 through <strong>2011</strong>, the following experience<br />
adjustments were made to the present value of all defined<br />
benefit obligations and to the fair value of plan assets:<br />
Experience Adjustments<br />
Percentages<br />
<strong>2011</strong> 2010<br />
December 31<br />
2009 2008 2007<br />
Experience adjustments to the amount of the benefit obligation 0.17 -0.16 0.26 1.61 1.22<br />
Experience adjustments to the value of plan assets 0.72 1.66 0.23 -9.01 -0.50
(25) Miscellaneous Provisions<br />
The following table lists the miscellaneous provisions as of<br />
the dates indicated:<br />
The changes in the miscellaneous provisions are shown in<br />
the table below:<br />
CEO Letter<br />
E.ON Stock<br />
Combined Group Management <strong>Report</strong><br />
Consolidated Financial Statements<br />
Corporate Governance <strong>Report</strong><br />
Supervisory Board and Board of Management<br />
Tables and Explanations<br />
Miscellaneous Provisions<br />
December 31, <strong>2011</strong> December 31, 2010<br />
NonNon-<br />
€ in millions<br />
Current current Current current<br />
Non-contractual nuclear waste management obligations 220 8,972 99 8,855<br />
Contractual nuclear waste management obligations 404 5,669 365 4,959<br />
Personnel obligations 779 1,479 633 780<br />
Other asset retirement obligations 367 1,637 315 1,374<br />
Supplier-related obligations 393 285 504 409<br />
Customer-related obligations 699 280 656 327<br />
Environmental remediation and similar obligations 42 924 76 797<br />
Other 2,081 3,181 2,302 2,880<br />
Total 4,985 22,427 4,950 20,381<br />
Changes in Miscellaneous Provisions<br />
€ in millions<br />
Jan. 1,<br />
<strong>2011</strong><br />
Exchange<br />
rate differences<br />
Changes<br />
in scope<br />
of consolidation<br />
Accretion Additions Utilization<br />
Reclassifications<br />
Reversals<br />
Changes<br />
in<br />
estimates<br />
125<br />
Dec. 31,<br />
<strong>2011</strong><br />
Non-contractual nuclear<br />
waste management<br />
obligations<br />
Contractual nuclear waste<br />
8,954 6 – 442 29 -45 -302 – 108 9,192<br />
management obligations 5,324 6 – 255 69 -276 302 – 393 6,073<br />
Personnel obligations<br />
Other asset retirement<br />
1,413 – -2 3 1,607 -681 – -82 – 2,258<br />
obligations<br />
Supplier-related<br />
1,689 11 -3 51 131 -18 2 -1 142 2,004<br />
obligations<br />
Customer-related<br />
913 -17 – 13 315 -339 – –207 – 678<br />
obligations<br />
Environmental remediation<br />
983 5 – 20 275 -213 9 -100 – 979<br />
and similar obligations 873 – – 14 185 -51 – -55 – 966<br />
Other 5,182 6 45 31 1,907 -1,254 -15 -640 – 5,262<br />
Total 25,331 17 40 829 4,518 -2,877 -4 -1,085 643 27,412
126 Notes<br />
The accretion expense resulting from the changes in provisions<br />
is shown in the financial results (see Note 9).<br />
As of December 31, <strong>2011</strong>, the interest rates applied for the<br />
nuclear power segment, calculated on a country-specific basis,<br />
were 5.2 percent (2010: 5.2 percent) in Germany and 3.0 percent<br />
(2010: 3.0 percent) in Sweden. For the other provision items,<br />
the interest rates used ranged from 0.3 percent to 3.7 percent,<br />
depending on maturity (2010: 0.7 percent to 4.4 percent).<br />
Provisions for Non-Contractual Nuclear Waste<br />
Management Obligations<br />
Of the total of €9.2 billion in provisions based on German and<br />
Swedish nuclear power legislation, €8.1 billion is attributable<br />
to the operations in Germany and €1.1 billion is attributable<br />
to the Swedish operations. The provisions <strong>com</strong>prise all those<br />
nuclear obligations relating to the disposal of spent nuclear<br />
fuel rods and low-level nuclear waste and to the retirement and<br />
de<strong>com</strong>missioning of nuclear power plant <strong>com</strong>ponents that are<br />
determined on the basis of external studies and cost estimates.<br />
The provisions are classified primarily as non-current provisions<br />
and measured at their settlement amounts, discounted to<br />
the balance sheet date.<br />
The asset retirement obligations recognized for non-contractual<br />
nuclear obligations include the anticipated costs of runout<br />
operation of the facility, dismantling costs, and the cost of<br />
removal and disposal of the nuclear <strong>com</strong>ponents of the<br />
nuclear power plant.<br />
Provisions for Contractual Nuclear Waste Management<br />
Obligations<br />
Of the total of €6.1 billion in provisions based on German and<br />
Swedish nuclear power legislation, €5.1 billion is attributable<br />
to the operations in Germany and €1.0 billion is attributable<br />
to the Swedish operations. The provisions <strong>com</strong>prise all those<br />
contractual nuclear obligations relating to the disposal of<br />
Additionally included in the disposal of spent nuclear fuel rods<br />
are costs for transports to the final storage facility and the<br />
cost of proper conditioning prior to final storage, including<br />
the necessary containers.<br />
The de<strong>com</strong>missioning costs and the cost of disposal of spent<br />
nuclear fuel rods and low-level nuclear waste also respectively<br />
include the actual final storage costs. Final storage costs consist<br />
mainly of investment and operating costs for the planned<br />
final storage facilities Gorleben and Konrad based on Germany’s<br />
ordinance on advance payments for the establishment of<br />
facilities for the safe custody and final storage of radioactive<br />
wastes in the country (“Endlager voraus leistungs verordnung”)<br />
and on data from the German Federal Office for Radiation Protection<br />
(“Bundes amt für Strahlen schutz”). Advance payments<br />
remitted to the Bundes amt für Strahlen schutz in the amount<br />
of €884 million (2010: €839 million) have been deducted from<br />
the provisions. These payments are made each year based on<br />
the amount spent by the Bundes amt für Strahlen schutz on the<br />
construction of the final storage facilities Gorleben and Konrad.<br />
The cost estimates used to determine the provision amounts<br />
are all based on studies performed by external specialists and<br />
are updated annually. The amendments to the German Nuclear<br />
Energy Act of August 6, <strong>2011</strong>, were taken into account in the<br />
measurement of the provisions in Germany.<br />
Changes in estimates increased provisions in <strong>2011</strong> by €108 million,<br />
and reclassifications to provisions for contractual waste<br />
management obligations reduced provisions by €302 million, at<br />
the German operations. There were no changes in estimates<br />
affecting provisions at the Swedish operations in <strong>2011</strong>.<br />
The following table lists the provisions by technical specification<br />
as of the dates indicated:<br />
Provisions for Non-Contractual Nuclear Waste Management Obligations<br />
December 31, <strong>2011</strong> December 31, 2010<br />
€ in millions<br />
Germany Sweden Germany Sweden<br />
De<strong>com</strong>missioning 6,483 374 6,055 347<br />
Disposal of nuclear fuel rods and operational waste 2,491 728 2,674 717<br />
Advance payments 884 – 839 –<br />
Total 8,090 1,102 7,890 1,064<br />
spent nuclear fuel rods and low-level nuclear waste and to<br />
the retirement and de<strong>com</strong>missioning of nuclear power plant<br />
<strong>com</strong>ponents that are measured at amounts firmly specified<br />
in legally binding civil agreements.<br />
The provisions are classified primarily as non-current provisions<br />
and measured at their settlement amounts, discounted to the<br />
balance sheet date.
Advance payments made to other waste management <strong>com</strong>panies<br />
in the amount of €44 million (2010: €21 million) have<br />
been deducted from the provisions attributed to Germany.<br />
The advance payments relate to the delivery of interim storage<br />
containers.<br />
Concerning the disposal of spent nuclear fuel rods, the obligations<br />
recognized in the provisions <strong>com</strong>prise the contractual<br />
costs of finalizing reprocessing and the associated return<br />
of waste with subsequent interim storage at Gorleben and<br />
Ahaus, as well as costs incurred for interim on-site storage,<br />
including the necessary interim storage containers, arising<br />
from the “direct permanent storage” path. The provisions also<br />
Personnel Obligations<br />
Provisions for personnel costs primarily cover provisions for<br />
early retirement benefits, performance-based <strong>com</strong>pensation<br />
<strong>com</strong>ponents, in-kind obligations and other deferred personnel<br />
costs. Since <strong>2011</strong>, this item also includes provisions for restructuring<br />
in the context of the E.ON 2.0 program. These relate<br />
primarily to obligations under early-retirement agreements<br />
and severance payments.<br />
Provisions for Other Asset Retirement Obligations<br />
The provisions for other asset retirement obligations consist<br />
of obligations for conventional and renewable-energy power<br />
plants, including the conventional plant <strong>com</strong>ponents in the<br />
nuclear power segment, that are based on legally binding civil<br />
agreements and public regulations. Also reported here are<br />
provisions for environmental improvements at opencast mining<br />
and gas storage facilities and the dismantling of installed<br />
infrastructure.<br />
Supplier-Related Obligations<br />
Provisions for supplier-related obligations consist of provisions<br />
for potential losses on open purchase contracts, among others.<br />
Customer-Related Obligations<br />
CEO Letter<br />
E.ON Stock<br />
Combined Group Management <strong>Report</strong><br />
Consolidated Financial Statements<br />
Corporate Governance <strong>Report</strong><br />
Supervisory Board and Board of Management<br />
Tables and Explanations<br />
include the contractual costs of de<strong>com</strong>missioning and the<br />
conditioning of low-level radioactive waste.<br />
Changes in estimates increased provisions in <strong>2011</strong> by €353 million,<br />
and reclassifications to provisions for non-contractual<br />
waste management obligations increased provisions by<br />
€302 million, at the German operations. The Swedish operations<br />
recorded an increase in provisions of €40 million as a<br />
result of changes in estimates.<br />
The following table lists the provisions by technical specification<br />
as of the dates indicated:<br />
Provisions for Contractual Nuclear Waste Management Obligations<br />
December 31, <strong>2011</strong> December 31, 2010<br />
€ in millions<br />
Germany Sweden Germany Sweden<br />
De<strong>com</strong>missioning 2,995 342 2,365 317<br />
Disposal of nuclear fuel rods and operational waste 2,104 676 1,997 666<br />
Advance payments 44 – 21 –<br />
Total 5,055 1,018 4,341 983<br />
Provisions for customer-related obligations consist primarily<br />
of potential losses on open sales contracts and of provisions<br />
for rebates.<br />
Environmental Remediation and Similar<br />
Obligations<br />
Provisions for environmental remediation refer primarily to<br />
redevelopment and water protection measures and to the<br />
rehabilitation of contaminated sites. Also included here are<br />
provisions for other environmental improvement measures<br />
and for land reclamation obligations at mining sites.<br />
Other<br />
The other miscellaneous provisions consist primarily of provisions<br />
from the electricity and gas business. Further included<br />
here are provisions for potential obligations arising from taxrelated<br />
interest expenses and from taxes other than in<strong>com</strong>e<br />
taxes, as well as for a variety of potential settlement obligations.<br />
127
128 Notes<br />
(26) Liabilities<br />
The following table provides a breakdown of liabilities as of<br />
the dates indicated:<br />
Liabilities<br />
December 31, <strong>2011</strong> December 31, 2010<br />
NonNon-<br />
€ in millions<br />
Current current Total Current current Total<br />
Financial liabilities 5,885 24,029 29,914 3,611 28,880 32,491<br />
Trade payables 4,871 – 4,871 5,016 – 5,016<br />
Capital expenditure grants 469 241 710 486 253 739<br />
Construction grants from energy consumers 419 2,438 2,857 337 2,603 2,940<br />
Liabilities from derivatives 9,140 2,417 11,557 7,214 1,647 8,861<br />
Advance payments 363 371 734 469 417 886<br />
Other operating liabilities 15,467 1,590 17,057 12,835 1,586 14,421<br />
Trade payables and other operating liabilities 30,729 7,057 37,786 26,357 6,506 32,863<br />
Total 36,614 31,086 67,700 29,968 35,386 65,354<br />
Financial Liabilities<br />
The following is a description of the E.ON Group’s significant<br />
credit arrangements and debt issuance programs. Included<br />
under “Bonds” are the bonds currently outstanding, including<br />
those issued under the Debt Issuance Program.<br />
Group Management<br />
Covenants<br />
The financing activities of E.ON AG and E.ON International<br />
Finance B.V. (“EIF”), Rotterdam, The Netherlands, involve the<br />
use of covenants consisting primarily of change-of-control<br />
clauses, negative pledges, pari-passu clauses and cross-default<br />
clauses, each referring to a restricted set of significant circumstances.<br />
Financial covenants (that is, covenants linked to<br />
financial ratios) are not employed.<br />
€35 Billion Debt Issuance Program<br />
E.ON AG and EIF have in place a Debt Issuance Program<br />
enabling the issuance from time to time of debt instruments<br />
through public and private placements to investors. The total<br />
amount available under the program is €35 billion. The program<br />
was extended in April <strong>2011</strong> for another year as planned.
At year-end <strong>2011</strong>, the following EIF bonds were outstanding:<br />
Major Bond Issues of E.ON International Finance B.V. 1<br />
Additionally outstanding as of December 31, <strong>2011</strong>, were private<br />
placements with a total volume of approximately €1.6 billion,<br />
as well as promissory notes with a total volume of approximately<br />
€0.8 billion.<br />
€10 Billion and $10 Billion Commercial Paper Programs<br />
The euro <strong>com</strong>mercial paper program in the amount of €10 billion<br />
allows E.ON AG and EIF (under the unconditional guarantee<br />
of E.ON AG) to issue from time to time <strong>com</strong>mercial paper<br />
with maturities of up to two years less one day to investors.<br />
CEO Letter<br />
E.ON Stock<br />
Combined Group Management <strong>Report</strong><br />
Consolidated Financial Statements<br />
Corporate Governance <strong>Report</strong><br />
Supervisory Board and Board of Management<br />
Tables and Explanations<br />
Volume in the<br />
respective currency Initial term Repayment Coupon<br />
GBP 500 million 10 years May 2012 6.375%<br />
USD 300 million 3 years June 2012 3.125%<br />
CHF 250 million 2 4 years Sep 2012 3.250%<br />
EUR 1,200 million 3 5 years Oct 2012 5.125%<br />
CHF 250 million 4 years Dec 2012 3.875%<br />
EUR 565 million 4 4 years Mar 2013 4.125%<br />
EUR 1,080 million 5 5 years May 2013 5.125%<br />
CHF 300 million 5 years May 2013 3.625%<br />
GBP 250 million 6 5 years Jan 2014 5.125%<br />
EUR 1,426 million 7 5 years Jan 2014 4.875%<br />
CHF 525 million 8 5 years Feb 2014 3.375%<br />
EUR 786 million 9 6 years June 2014 5.250%<br />
CHF 225 million 7 years Dec 2014 3.250%<br />
EUR 1,250 million 7 years Sep 2015 5.250%<br />
EUR 1,500 million 7 years Jan 2016 5.500%<br />
EUR 900 million 15 years May 2017 6.375%<br />
EUR 2,375 million 10 10 years Oct 2017 5.500%<br />
USD 2,000 million 11 10 years Apr 2018 5.800%<br />
GBP 850 million 12 12 years Oct 2019 6.000%<br />
EUR 1,400 million 13 12 years May 2020 5.750%<br />
GBP 975 million 14 30 years June 2032 6.375%<br />
GBP 900 million 30 years Oct 2037 5.875%<br />
USD 1,000 million11 30 years Apr 2038 6.650%<br />
GBP 700 million 30 years Jan 2039 6.750%<br />
1 Listing: All bonds are listed in Luxembourg with the exception of the CHF-denominated bonds, which are listed on the SWX Swiss Exchange, and the two Rule 144A/Regulation S<br />
USD bonds, which are unlisted.<br />
2 The volume of this issue was raised from originally CHF 200 million to CHF 250 million.<br />
3 After early redemption, the volume of this issue was lowered from originally EUR 1,750 million to approx. EUR 1,200 million.<br />
4 After early redemption, the volume of this issue was lowered from originally EUR 750 million to approx. EUR 565 million.<br />
5 After early redemption, the volume of this issue was lowered from originally EUR 1,500 million to approx. EUR 1,080 million.<br />
6 After early redemption, the volume of this issue was lowered from originally GBP 350 million to approx. GBP 250 million.<br />
7 After early redemption, the volume of this issue was lowered from originally EUR 1,750 million to approx. EUR 1,426 million.<br />
8 The volume of this issue was raised from originally CHF 400 million to CHF 525 million.<br />
9 After early redemption, the volume of this issue was lowered from originally EUR 1,000 million to approx. EUR 786 million.<br />
10 The volume of this issue was raised in two steps from originally EUR 1,750 million to EUR 2,375 million.<br />
11 Rule 144A/Regulation S bond.<br />
12 The volume of this issue was raised from originally GBP 600 million to GBP 850 million.<br />
13 The volume of this issue was raised from originally EUR 1,000 million to EUR 1,400 million.<br />
14 The volume of this issue was raised from originally GBP 850 million to GBP 975 million.<br />
The U.S. <strong>com</strong>mercial paper program in the amount of $10 billion<br />
allows E.ON AG and E.ON N.A. Funding LLC, a wholly owned<br />
U.S. subsidiary, (under the unconditional guarantee of E.ON AG)<br />
to issue from time to time <strong>com</strong>mercial paper with matur ities<br />
of up to 366 days and extendible notes with original maturities<br />
of up to 397 days (and a subsequent extension option for the<br />
investor) to investors. As of December 31, <strong>2011</strong>, €869 million<br />
(2010: €0 million) was outstanding under the euro <strong>com</strong>mercial<br />
paper program. No <strong>com</strong>mercial paper was outstanding under<br />
the U.S. <strong>com</strong>mercial paper program, as in the previous year.<br />
129
130 Notes<br />
€6 Billion Syndicated Revolving Credit Facility<br />
Effective November 25, 2010, E.ON has arranged a syndicated<br />
revolving credit facility of €6 billion over a term of five years. The<br />
facility has not been drawn on; rather, it serves as the Group’s<br />
long-term liquidity reserve, one purpose of which is to function<br />
as a backup facility for the <strong>com</strong>mercial paper programs.<br />
Financial Liabilities by Segment<br />
The following table breaks down the financial liabilities by<br />
segment:<br />
Among other things, financial liabilities to financial institutions<br />
include collateral received, measured at a fair value of<br />
€435 million (2010: €313 million). This collateral relates to<br />
amounts pledged by banks to limit the utilization of credit lines<br />
in connection with the fair value measurement of derivative<br />
trans actions. The other financial liabilities include promissory<br />
notes in the amount of €839 million (2010: €1,406 million).<br />
Additionally included in this line item are margin deposits<br />
received in connection with forward transactions on futures<br />
exchanges in the amount of €51 million (2010: €21 million), as<br />
well as collateral received in connection with goods and<br />
services in the amount of €20 million (2010: €7 million). E.ON<br />
can use this collateral without restriction.<br />
As of December 31, <strong>2011</strong>, the bonds issued by E.ON AG and<br />
EIF had the maturities shown in the table below. The figures<br />
presented are based on internal liquidity-management data.<br />
Bonds Issued by E.ON AG and E.ON International Finance B.V.<br />
Due Due Due Due Due<br />
Due<br />
between<br />
2016 and Due<br />
€ in millions Total in <strong>2011</strong> in 2012 in 2013 in 2014 in 2015 2022 after 2022<br />
December 31, <strong>2011</strong> 23,154 – 2,554 2,255 3,343 1,250 9,146 4,606<br />
December 31, 2010 26,750 2,113 3,067 2,833 3,954 1,250 9,060 4,473<br />
Financial Liabilities by Segment as of December 31<br />
Generation Renewables Gas<br />
€ in millions<br />
<strong>2011</strong> 2010 <strong>2011</strong> 2010 <strong>2011</strong> 2010<br />
Bonds – – – – – –<br />
Commercial paper – – – – – –<br />
Bank loans/Liabilities to banks 109 123 6 23 – –<br />
Liabilities from finance leases 43 44 – – 573 339<br />
Other financial liabilities 1,125 1,082 354 273 119 117<br />
Financial liabilities 1,277 1,249 360 296 692 456<br />
Trade Payables and Other Operating Liabilities<br />
Trade payables totaled €4,871 million as of December 31, <strong>2011</strong><br />
(2010: €5,016 million).<br />
Capital expenditure grants of €710 million (2010: €739 million)<br />
were paid primarily by customers for capital expenditures<br />
made on their behalf, while E.ON retains ownership of the<br />
assets. The grants are non-refundable and are recognized<br />
in other operating in<strong>com</strong>e over the period of the depreciable<br />
lives of the related assets.
Construction grants of €2,857 million (2010: €2,940 million)<br />
were paid by customers for the cost of new gas and electricity<br />
connections in accordance with the generally binding terms<br />
governing such new connections. These grants are customary<br />
in the industry, generally non-refundable and recognized<br />
as revenue according to the useful lives of the related assets.<br />
Other operating liabilities consist primarily of accruals in the<br />
amount of €12,166 million (2010: €9,080 million) and interest<br />
payable in the amount of €991 million (2010: €1,045 million).<br />
Also included in other operating liabilities are the counterparty<br />
CEO Letter<br />
E.ON Stock<br />
Combined Group Management <strong>Report</strong><br />
Consolidated Financial Statements<br />
Corporate Governance <strong>Report</strong><br />
Supervisory Board and Board of Management<br />
Tables and Explanations<br />
Trading Germany Other EU Countries<br />
Group Management/<br />
Consolidation E.ON Group<br />
<strong>2011</strong> 2010 <strong>2011</strong> 2010 <strong>2011</strong> 2010 <strong>2011</strong> 2010 <strong>2011</strong> 2010<br />
– – – – 281 850 23,075 26,650 23,356 27,500<br />
– – – – – – 869 – 869 –<br />
6 – 263 310 359 222 446 363 1,189 1,041<br />
– – 69 63 – 2 93 – 778 448<br />
51 4 171 195 67 65 1,835 1,766 3,722 3,502<br />
57 4 503 568 707 1,139 26,318 28,779 29,914 32,491<br />
obligations to acquire additional shares in already consolidated<br />
subsidiaries and non-controlling interests in fully consolidated<br />
partnerships totaling €821 million (2010: €829 million), which<br />
are carried forward.<br />
Exploration activities accounted for €11 million (2010:<br />
€17 million) of the trade payables and other operating liabilities<br />
reported.<br />
131
132 Notes<br />
(27) Contingencies and Other Financial Obligations<br />
As part of its business activities, E.ON is subject to contingencies<br />
and other financial obligations involving a variety of<br />
underlying matters. These primarily include guarantees, obligations<br />
from litigation and claims (as discussed in more<br />
detail in Note 28), short- and long-term contractual, legal and<br />
other obligations and <strong>com</strong>mitments.<br />
Contingencies<br />
The fair value of the E.ON Group’s contingent liabilities arising<br />
from existing contingencies was €195 million as of December<br />
31, <strong>2011</strong> (2010: €252 million). E.ON currently does not have<br />
reimbursement rights relating to the contingent liabilities<br />
disclosed.<br />
E.ON has issued direct and indirect guarantees to third parties,<br />
which require E.ON to make contingent payments based on<br />
the occurrence of certain events or changes in an underlying<br />
instrument that is related to an asset, a liability or an equity<br />
instrument of the guaranteed party, on behalf of both related<br />
parties and external entities. These consist primarily of financial<br />
guarantees and warranties.<br />
In addition, E.ON has also entered into indemnification agreements.<br />
Along with other guarantees, these indemnification<br />
agreements are incorporated in agreements entered into by<br />
Group <strong>com</strong>panies concerning the disposal of shareholdings<br />
and, above all, cover the customary representations and warranties,<br />
as well as environmental damage and tax contingencies.<br />
In some cases, obligations are covered in the first instance<br />
by provisions of the disposed <strong>com</strong>panies before E.ON itself is<br />
required to make any payments. Guarantees issued by <strong>com</strong>panies<br />
that were later sold by E.ON AG (or VEBA AG and VIAG AG<br />
before their merger) are usually included in the respective<br />
final sales contracts in the form of indemnities.<br />
Moreover, E.ON has <strong>com</strong>mitments under which it assumes<br />
joint and several liability arising from its interests in civil-law<br />
<strong>com</strong>panies (“GbR”), non-corporate <strong>com</strong>mercial partnerships<br />
and consortia in which it participates.<br />
The guarantees of E.ON also include items related to the operation<br />
of nuclear power plants. With the entry into force of<br />
the German Nuclear Energy Act (“Atomgesetz” or “AtG”), as<br />
amended, and of the ordinance regulating the provision for<br />
coverage under the Atomgesetz (“Atomrecht liche Deckungsvorsorge-Verordnung”<br />
or “AtDeckV”) of April 27, 2002, as<br />
amended, German nuclear power plant operators are required<br />
to provide nuclear accident liability coverage of up to €2.5 billion<br />
per incident.<br />
The coverage requirement is satisfied in part by a standardized<br />
insurance facility in the amount of €255.6 million. The institution<br />
Nuklear Haftpflicht Gesellschaft bürgerlichen Rechts<br />
(“Nuklear Haftpflicht GbR”) now only covers costs between<br />
€0.5 million and €15 million for claims related to officially<br />
ordered evacuation measures. Group <strong>com</strong>panies have agreed<br />
to place their subsidiaries operating nuclear power plants<br />
in a position to maintain a level of liquidity that will enable<br />
them at all times to meet their obligations as members of<br />
the Nuklear Haftpflicht GbR, in proportion to their shareholdings<br />
in nuclear power plants.<br />
To provide liability coverage for the additional €2,244.4 million<br />
per incident required by the above-mentioned amendments,<br />
E.ON Energie AG (“E.ON Energie”) and the other parent <strong>com</strong>panies<br />
of German nuclear power plant operators reached a<br />
Solidarity Agreement (“Solidarvereinbarung”) on July 11, July 27,<br />
August 21, and August 28, 2001, extended by agreement dated<br />
March 25, April 18, April 28, and June 1, <strong>2011</strong>. If an accident<br />
occurs, the Solidarity Agreement calls for the nuclear power<br />
plant operator liable for the damages to receive—after the<br />
operator’s own resources and those of its parent <strong>com</strong>panies<br />
are exhausted—financing sufficient for the operator to meet<br />
its financial obligations. Under the Solidarity Agreement,<br />
E. ON Energie’s share of the liability coverage on December 31,<br />
<strong>2011</strong>, remained unchanged from 2010 at 42.0 percent plus<br />
an additional 5.0 percent charge for the administrative costs<br />
of processing damage claims. Sufficient liquidity has been<br />
provided for within the liquidity plan.<br />
In accordance with Swedish law, the <strong>com</strong>panies of the Swedish<br />
generation unit and their parent <strong>com</strong>pany have issued guarantees<br />
to governmental authorities. The guarantees were issued<br />
to cover possible additional costs related to the disposal of<br />
high-level radioactive waste and to the de<strong>com</strong>missioning of<br />
nuclear power plants. These costs could arise if actual costs<br />
exceed accumulated funds. In addition, the <strong>com</strong>panies of the<br />
Swedish generation unit and their parent <strong>com</strong>pany are also<br />
responsible for any costs related to the disposal of low-level<br />
radioactive waste.
In Sweden, owners of nuclear facilities are liable for damages<br />
resulting from accidents occurring in those nuclear facilities<br />
and for accidents involving any radioactive substances connected<br />
to the operation of those facilities. The liability per<br />
incident as of December 31, <strong>2011</strong>, was limited to SEK 3,189 million,<br />
or €358 million (2010: SEK 3,143 million, or €351 million).<br />
This amount must be insured according to the Law Concerning<br />
Nuclear Liability. The necessary insurance for the affected<br />
nuclear power plants has been purchased. On July 1, 2010, the<br />
Swedish Parliament passed a law that requires the operator<br />
of a nuclear power plant in operation to have liability insurance<br />
or other financial security in an amount equivalent to<br />
€1.2 billion per facility. As of December 31, <strong>2011</strong>, the conditions<br />
enabling this law to take effect were not yet in place.<br />
The Generation global unit operates nuclear power plants<br />
only in Germany and Sweden. Accordingly, there are no additional<br />
contingencies <strong>com</strong>parable to those mentioned above.<br />
Other Financial Obligations<br />
In addition to provisions and liabilities carried on the balance<br />
sheet and to the reported contingent liabilities, there also<br />
are other mostly long-term financial obligations arising mainly<br />
from contracts entered into with third parties and related<br />
parties, or on the basis of legal requirements.<br />
As of December 31, <strong>2011</strong>, purchase <strong>com</strong>mitments for investments<br />
in intangible assets and in property, plant and equipment<br />
amounted to €8.3 billion (2010: €7.4 billion). Of these <strong>com</strong>mitments,<br />
€3.2 billion are due within one year. This total mainly<br />
includes financial obligations for as yet outstanding investments<br />
in connection with new power plant construction pro jects<br />
and modernizations of existing generation assets, as well as<br />
with ex ploration and gas infrastructure projects, particularly<br />
at the Generation, Renewables, Gas, Germany, Russia and<br />
Sweden units. On December 31, <strong>2011</strong>, the obligations for new<br />
power plant construction reported under these purchase<br />
<strong>com</strong>mitments totaled €4.0 billion. They also include the obligations<br />
relating to the construction of wind power plants.<br />
CEO Letter<br />
E.ON Stock<br />
Combined Group Management <strong>Report</strong><br />
Consolidated Financial Statements<br />
Corporate Governance <strong>Report</strong><br />
Supervisory Board and Board of Management<br />
Tables and Explanations<br />
Additional financial obligations arose from rental and tenancy<br />
agreements and from operating leases. The corresponding<br />
minimum lease payments are due as broken down in the<br />
table below:<br />
E.ON as Lessee—Operating Leases<br />
Minimum lease payments<br />
€ in millions<br />
<strong>2011</strong> 2010<br />
Due within 1 year 264 243<br />
Due in 1 to 5 years 818 579<br />
Due in more than 5 years 1,093 940<br />
Total 2,175 1,762<br />
The expenses reported in the in<strong>com</strong>e statement for such<br />
contracts amounted to €273 million (2010: €263 million). Furthermore,<br />
a lease-leaseback arrangement for power plants<br />
has resulted in cash flows, which are financed by restricted,<br />
offsetting investments totaling approximately €0.5 billion<br />
(2010: €0.4 billion) that are congruent in terms of amounts,<br />
maturities and currencies. The arrangement expires in 2030.<br />
Additional long-term contractual obligations in place at the<br />
E.ON Group as of December 31, <strong>2011</strong>, relate primarily to the<br />
purchase of fossil fuels such as natural gas, lignite and hard<br />
coal. Financial obligations under these purchase contracts<br />
amounted to approximately €325.6 billion on December 31, <strong>2011</strong><br />
(€22.7 billion due within one year).<br />
Gas is usually procured on the basis of long-term purchase<br />
contracts with large international producers of natural gas.<br />
Such contracts are generally of a “take-or-pay” nature. The<br />
prices paid for natural gas are normally tied to the prices of<br />
<strong>com</strong>peting energy sources, as dictated by market conditions.<br />
The conditions of these long-term contracts are reviewed at<br />
certain specific intervals (usually every three years) as part<br />
of contract negotiations and may thus change accordingly. In<br />
the absence of an agreement on a pricing review, a neutral<br />
board of arbitration makes a final binding decision. Financial<br />
obligations arising from these contracts are calculated based<br />
on the same principles that govern internal budgeting. Furthermore,<br />
the take-or-pay conditions in the individual contracts<br />
are also considered in the calculations.<br />
133
134 Notes<br />
As of December 31, <strong>2011</strong>, €7.7 billion in contractual obligations<br />
(€3.4 billion due within one year) are in place for the purchase<br />
of electricity; these relate in part to purchases from jointly<br />
operated power plants in the Generation unit. The purchase<br />
price of electricity from jointly operated power plants is generally<br />
based on the supplier’s production cost plus a profit<br />
margin that is generally calculated on the basis of an agreed<br />
return on capital. The decrease in contractual obligations for<br />
the purchase of electricity <strong>com</strong>pared with December 31, 2010,<br />
is primarily the result of the shutdown of several jointly operated<br />
power plants.<br />
Other purchase <strong>com</strong>mitments as of December 31, <strong>2011</strong>,<br />
amounted to approximately €3.2 billion (€0.3 billion due within<br />
one year). In addition to purchase <strong>com</strong>mitments primarily<br />
for heat and alternative fuels, there are long-term contractual<br />
obligations in place at the Generation unit for the purchase<br />
of nuclear fuel elements and of services relating to the interim<br />
and final storage of nuclear fuel elements.<br />
Payment obligations had also arisen from the eleventh amendment<br />
of the Atomgesetz, which took effect on December 14,<br />
2010, and provided for the allocation of additional output for<br />
nuclear power plants. The law as amended was to have the<br />
effect of prolonging the lives of these nuclear installations.<br />
In that context, the operators of nuclear power plants had<br />
(28) Litigation and Claims<br />
A number of different court actions (including product liability<br />
claims and allegations of price fixing), governmental investigations<br />
and proceedings, and other claims are currently pending<br />
or may be instituted or asserted in the future against <strong>com</strong>panies<br />
of the E.ON Group. This in particular includes legal actions<br />
and proceedings concerning alleged price-fixing agreements<br />
and anti<strong>com</strong>petitive practices. In addition, there are lawsuits<br />
pending against E.ON AG and U.S. subsidiaries in connection<br />
with the disposal of VEBA Electronics in 2000.<br />
The entire sector is involved in a multitude of court proceedings<br />
throughout Germany in the matter of price-adjustment<br />
clauses in the retail electricity and gas supply business with<br />
high-volume customers. These proceedings include actions<br />
for the restitution of amounts collected through price increases<br />
imposed using price-adjustment clauses determined to be<br />
invalid. The legal issues involved have not yet been definitively<br />
addressed at the highest judicial level. Companies of the<br />
E.ON Group are also involved in legal proceedings in this area.<br />
made an undertaking to contribute to a fund that would have<br />
been used to finance measures to implement the German<br />
federal government’s energy concept. The underlying agreement<br />
with the Federal Republic of Germany was signed on<br />
January 10, <strong>2011</strong>. Once the thirteenth amendment of the Atomgesetz<br />
takes effect, the support fund agreement will no longer<br />
constitute a basis for additional payments.<br />
Further financial obligations in place as of December 31, <strong>2011</strong>,<br />
totaled approximately €4.6 billion (€1.7 billion due within<br />
one year). Among others, they include financial obligations<br />
from services to be procured, obligations concerning the<br />
acquisition of shares and the acquisition of real estate funds<br />
held as financial assets, as well as corporate actions.<br />
The courts have shown a noticeable sector-wide tendency to<br />
rule against the utilities. This is illustrated by a judgment of the<br />
Federal Court of Justice (“Bundesgerichtshof”) against EWE AG<br />
in July 2010 concerning the validity of gas price adjustments<br />
and the legal status of unconditional remittances. The potential<br />
effect of this ruling on the <strong>com</strong>panies of the E.ON Group<br />
cannot yet be evaluated definitively. It remains to be seen how<br />
case law will develop in other respects.<br />
On July 8, 2009, the European Commission imposed a fine of<br />
€553 million on E.ON Ruhrgas for joint liability in alleged<br />
market-sharing activities with GdF Suez. E.ON Ruhrgas and<br />
E.ON filed an appeal against the Commission’s decision<br />
with the General Court of the European Union in September<br />
2009. The appeal does not have suspensory effect, and the<br />
fine was thus paid when due in October 2009. Further proceedings<br />
in this matter cannot be ruled out.
Competition in the gas market and increasing trading volumes<br />
at virtual trading points and on gas exchanges could result<br />
in considerable risks for gas quantities purchased under longterm<br />
take-or-pay contracts. In addition, substantial price risks<br />
result from the fact that gas procurement prices are predominantly<br />
linked to the price of oil, whereas sales prices are<br />
guided by wholesale prices. In general, contracts between producers<br />
and importers are subject to periodic adjustments in<br />
line with current market conditions. E. ON Ruhrgas conducts<br />
intensive negotiations with producers. The negotiations with<br />
Gazprom have been unsuccessful thus far, and E.ON Ruhrgas<br />
has availed of its right under the existing contracts to initiate<br />
arbitration proceedings against Gazprom.<br />
(29) Supplemental Disclosures of Cash Flow<br />
Information<br />
Supplemental Disclosures of<br />
Cash Flow Information<br />
€ in millions<br />
Non-cash investing and financing activities<br />
<strong>2011</strong> 2010<br />
Exchanges in corporate transactions<br />
Funding of external fund assets for<br />
pension obligations through transfer of<br />
35 172<br />
fixed-term deposits and securities 164 –<br />
The total consideration received by E.ON in <strong>2011</strong> for the disposal<br />
of consolidated equity interests and activities generated<br />
cash inflows of €4,597 million (2010: €6,225 million). Cash<br />
and cash equivalents divested in connection with the disposals<br />
amounted to €25 million (2010: €461 million). The sale<br />
of these activities led to reductions of €6,139 million (2010:<br />
€9,397 million) in assets and €2,279 million (2010: €3,401 million)<br />
in provisions and liabilities.<br />
The purchase prices paid for subsidiaries totaled €16 million.<br />
The acquisitions included cash in the amount of €4 million.<br />
Aside from the cash there were no significant acquisitions of<br />
assets, provisions or liabilities. No significant cash acquisitions<br />
of consolidated equity investments and activities took place<br />
in 2010.<br />
Cash provided by operating activities of the E.ON Group was<br />
38 percent lower in <strong>2011</strong> than in 2010. The decrease is primarily<br />
due to cash effects associated with the reduction in EBITDA,<br />
a negative non-recurring effect due to the supplemental funding<br />
of pension plan assets, especially in the United Kingdom,<br />
CEO Letter<br />
E.ON Stock<br />
Combined Group Management <strong>Report</strong><br />
Consolidated Financial Statements<br />
Corporate Governance <strong>Report</strong><br />
Supervisory Board and Board of Management<br />
Tables and Explanations<br />
In September <strong>2011</strong>, the European Commission conducted additional<br />
inspections at several gas utilities in Central and Eastern<br />
Europe, some of which are E. ON Group <strong>com</strong>panies. The Commission<br />
is investigating potential anti<strong>com</strong>petitive practices by<br />
Gazprom, possibly acting in concert with other <strong>com</strong>panies. The<br />
Commission makes note that such inspections do not indicate<br />
the existence of definitive proof of anti<strong>com</strong>petitive behavior.<br />
Because litigation and claims are subject to numerous uncertainties,<br />
their out<strong>com</strong>e cannot be ascertained; however, in the opinion<br />
of management, any potential obligations arising from these<br />
matters will not have a material adverse effect on the financial<br />
condition, results of operations or cash flows of the Company.<br />
higher interest payments and negative effects in working capital.<br />
Working capital was diminished in particular by reduced<br />
subsidies for new wind farms in the United States as a consequence<br />
of fewer <strong>com</strong>missions, by portfolio effects and by<br />
changes in working capital at the Trading and Gas global<br />
units and in the regional businesses. The effects were partly<br />
offset by lower tax payments.<br />
Spending on intangible assets, on property, plant and equipment<br />
and on equity investments was approximately 21 percent<br />
lower than in the previous year. The amount of cash received<br />
from the disposal of equity investments was about 39 percent<br />
below the extremely high proceeds obtained in 2010. Cash<br />
provided by investing activities in <strong>2011</strong> came primarily from the<br />
disposal of Central Networks in the United Kingdom and from<br />
the sale of the Gazprom shares. The <strong>com</strong>mitments of funds for<br />
securities, financial receivables and fixed-term deposits were<br />
also substantially higher than in 2010. Aside from the dividend<br />
payments, the cash flows from financing activities primarily<br />
reflect the net repayment of borrowings.<br />
Exploration activity resulted in operating cash flow of<br />
-€5 million (2010: -€70 million) and in cash flow from investing<br />
activities of -€50 million (2010: -€114 million).<br />
135
136 Notes<br />
(30) Derivative Financial Instruments and Hedging<br />
Transactions<br />
Strategy and Objectives<br />
The Company’s policy generally permits the use of derivatives<br />
if they are associated with underlying assets or liabilities,<br />
planned transactions, or legally binding rights or obligations.<br />
Proprietary trading activities are concentrated on E.ON Energy<br />
Trading and are conducted within the confines of the risk<br />
management guidelines described below.<br />
Hedge accounting in accordance with IAS 39 is employed primarily<br />
for interest rate derivatives used to hedge long-term<br />
debts, as well as for currency derivatives used to hedge net<br />
investments in foreign operations, long-term receivables and<br />
debts denominated in foreign currency, as well as planned<br />
capital investments. In <strong>com</strong>modities, potentially volatile future<br />
cash flows resulting primarily from planned purchases and<br />
sales of electricity within and outside of the Group, as well as<br />
from anticipated fuel purchases and purchases and sales<br />
of gas, are hedged.<br />
Fair Value Hedges<br />
Fair value hedges are used to protect against the risk from<br />
changes in market values. Gains and losses on these hedges<br />
are generally reported in that line item of the in<strong>com</strong>e statement<br />
which also includes the respective hedged items. In<br />
2010, an equity interest was hedged against fluctuating market<br />
prices using forward transactions. The unrealized loss on<br />
the forwards used to hedge the value of this equity interest<br />
amounted to €115 million in 2010. This corresponded to the<br />
fair value of the forwards. The gain on the hedged shares as<br />
regards market price fluctuations amounted to €107 million.<br />
The aforementioned fair value hedge expired in 2010.<br />
Cash Flow Hedges<br />
Cash flow hedges are used to protect against the risk arising<br />
from variable cash flows. Interest rate swaps, cross-currency<br />
interest rate swaps and interest rate options are the principal<br />
instruments used to limit interest rate and currency risks. The<br />
purpose of these swaps is to maintain the level of payments<br />
arising from long-term interest-bearing receivables and liabilities<br />
and from capital investments denominated in foreign<br />
currency and euro by using cash flow hedge accounting in the<br />
functional currency of the respective E.ON <strong>com</strong>pany.<br />
In order to reduce future cash flow fluctuations arising from<br />
electricity transactions effected at variable spot prices, futures<br />
contracts are concluded and also accounted for using cash<br />
flow hedge accounting.<br />
As of December 31, <strong>2011</strong>, the hedged transactions in place<br />
included foreign currency cash flow hedges with maturities<br />
of up to 27 years (2010: up to 28 years) and up to five years<br />
(2010: up to six years) for interest cash flow hedges. Commodity<br />
cash flow hedges have maturities of up to three years (2010:<br />
up to three years).<br />
The amount of ineffectiveness for cash flow hedges recorded<br />
for the year ended December 31, <strong>2011</strong>, produced a gain of<br />
€4 million (2010: €6 million loss).
Pursuant to the information available as of the balance sheet<br />
date, the following effects will ac<strong>com</strong>pany the reclassifications<br />
from accumulated other <strong>com</strong>prehensive in<strong>com</strong>e to the in<strong>com</strong>e<br />
statement in subsequent periods:<br />
Gains and losses from reclassification are generally reported in<br />
that line item of the in<strong>com</strong>e statement which also includes<br />
the respective hedged transaction. Gains and losses from the<br />
ineffective portions of cash flow hedges are classified as<br />
other operating in<strong>com</strong>e or other operating expenses. Interest<br />
cash flow hedges are reported under “Interest and similar<br />
expenses.” The fair values of the derivatives used in cash flow<br />
hedges totaled €134 million (2010: €242 million).<br />
A loss of €63 million (2010: €204 million loss) was posted to<br />
other <strong>com</strong>prehensive in<strong>com</strong>e in <strong>2011</strong>. In the same period, a<br />
gain of €108 million (2010: €203 million gain) was reclassified<br />
from OCI to the in<strong>com</strong>e statement.<br />
Net Investment Hedges<br />
CEO Letter<br />
E.ON Stock<br />
Combined Group Management <strong>Report</strong><br />
Consolidated Financial Statements<br />
Corporate Governance <strong>Report</strong><br />
Supervisory Board and Board of Management<br />
Tables and Explanations<br />
Timing of Reclassifications from OCI1 to the In<strong>com</strong>e Statement—<strong>2011</strong><br />
Carrying<br />
Expected gains/losses<br />
€ in millions<br />
amount 2012 2013 2014–2016 >2016<br />
OCI—Currency cash flow hedges 157 1 5 8 -171<br />
OCI—Interest cash flow hedges -71 1 – 9 61<br />
OCI—Commodity cash flow hedges -23 11 1 11 –<br />
1 OCI = Other <strong>com</strong>prehensive in<strong>com</strong>e. Figures are pre-tax.<br />
Timing of Reclassifications from OCI1 to the In<strong>com</strong>e Statement—2010<br />
Carrying<br />
Expected gains/losses<br />
€ in millions<br />
amount <strong>2011</strong> 2012 2013–2015 >2015<br />
OCI—Currency cash flow hedges -133 8 8 20 97<br />
OCI—Interest cash flow hedges 40 -2 1 17 -56<br />
OCI—Commodity cash flow hedges -12 5 7 – –<br />
1 OCI = Other <strong>com</strong>prehensive in<strong>com</strong>e. Figures are pre-tax.<br />
The Company uses foreign currency loans, foreign currency<br />
forwards and foreign currency swaps to protect the value of<br />
its net investments in its foreign operations denominated<br />
in foreign currency. For the year ended December 31, <strong>2011</strong>, the<br />
Company recorded an amount of -€63 million (2010: €558 million)<br />
in accumulated other <strong>com</strong>prehensive in<strong>com</strong>e due to<br />
changes in fair value of derivatives and to currency translation<br />
results of non-derivative hedging instruments. As in 2010, no<br />
ineffectiveness resulted from net investment hedges in <strong>2011</strong>.<br />
137
138 Notes<br />
Valuation of Derivative Instruments<br />
The fair value of derivative instruments is sensitive to movements<br />
in underlying market rates and other relevant variables.<br />
The Company assesses and monitors the fair value of<br />
deri vative instruments on a periodic basis. Fair values for<br />
each derivative financial instrument are determined as being<br />
equal to the price at which one party would assume the<br />
rights and duties of another party, and calculated using <strong>com</strong>mon<br />
market valuation methods with reference to available<br />
market data as of the balance sheet date.<br />
The following is a summary of the methods and assumptions<br />
for the valuation of utilized derivative financial instruments<br />
in the Consolidated Financial Statements.<br />
• Currency, electricity, gas, oil and coal forward contracts,<br />
swaps, and emissions-related derivatives are valued separately<br />
at their forward rates and prices as of the balance<br />
sheet date. Whenever possible, forward rates and prices<br />
are based on market quotations, with any applicable forward<br />
premiums and discounts taken into consideration.<br />
• Market prices for interest rate, electricity and gas options<br />
are valued using standard option pricing models <strong>com</strong>monly<br />
used in the market. The fair values of caps, floors<br />
and collars are determined on the basis of quoted market<br />
prices or on calculations based on option pricing models.<br />
• The fair values of existing instruments to hedge interest<br />
risk are determined by discounting future cash flows using<br />
market interest rates over the remaining term of the<br />
instrument. Discounted cash values are determined for<br />
interest rate, cross-currency and cross-currency interest<br />
rate swaps for each individual transaction as of the balance<br />
sheet date. Interest in<strong>com</strong>e is recognized in in<strong>com</strong>e<br />
at the date of payment or accrual.<br />
• Equity forwards are valued on the basis of the stock prices<br />
of the underlying equities, taking into consideration any<br />
timing <strong>com</strong>ponents.<br />
• Exchange-traded futures and option contracts are valued<br />
individually at daily settlement prices determined on the<br />
futures markets that are published by their respective<br />
clearing houses. Paid initial margins are disclosed under<br />
other assets. Variation margins received or paid during<br />
the term of such contracts are stated under other liabilities<br />
or other assets, respectively.<br />
• Certain long-term energy contracts are valued with the<br />
aid of valuation models that use internal data if market<br />
prices are not available. A hypothetical ten-percent<br />
increase or decrease in these internal valuation parameters<br />
as of the balance sheet date would lead to a theo retical<br />
decrease in market values of €212 million or an increase<br />
of €44 million, respectively.<br />
At the beginning of <strong>2011</strong>, a gain of €112 million from the initial<br />
measurement of derivatives was deferred. After the realization<br />
of €7 million in deferred gains and new additions of €3 million,<br />
the remainder is a deferred gain of €122 million at year-end,<br />
which will be recognized in in<strong>com</strong>e during subsequent periods<br />
as the contracts are settled.<br />
The following two tables include both derivatives that qualify<br />
for IAS 39 hedge accounting treatment and those for which<br />
it is not used.
CEO Letter<br />
E.ON Stock<br />
Combined Group Management <strong>Report</strong><br />
Consolidated Financial Statements<br />
Corporate Governance <strong>Report</strong><br />
Supervisory Board and Board of Management<br />
Tables and Explanations<br />
Total Volume of Foreign Currency, Interest Rate and Equity-Based Derivatives<br />
December 31, <strong>2011</strong> December 31, 2010<br />
Nominal<br />
Nominal<br />
€ in millions<br />
value Fair value value Fair value<br />
FX forward transactions 25,865.2 366.7 31,116.2 -87.4<br />
Subtotal 25,865.2 366.7 31,116.2 -87.4<br />
Cross-currency swaps 15,344.5 489.2 17,924.1 274.4<br />
Cross-currency interest rate swaps 211.4 99.2 211.4 75.8<br />
Subtotal 15,555.9 588.4 18,135.5 350.2<br />
Interest rate swaps<br />
Fixed-rate payer 2,318.1 -359.7 2,468.0 -128.9<br />
Fixed-rate receiver 1,284.8 153.9 1,115.8 110.8<br />
Interest rate future 34.5 -0.6 133.8 1.4<br />
Interest rate options 2,000.0 -61.5 2,000.0 71.3<br />
Subtotal 5,637.4 -267.9 5,717.6 54.6<br />
Other derivatives 9.1 2.2 1,083.0 -180.0<br />
Subtotal 9.1 2.2 1,083.0 -180.0<br />
Total 47,067.6 689.4 56,052.3 137.4<br />
Total Volume of Electricity, Gas, Coal, Oil and Emissions-Related Derivatives<br />
December 31, <strong>2011</strong> December 31, 2010<br />
Nominal<br />
Nominal<br />
€ in millions<br />
value Fair value value Fair value<br />
Electricity forwards 77,818.5 -301.4 65,052.8 763.6<br />
Exchange-traded electricity forwards 9,700.3 -5.6 11,411.0 -681.9<br />
Electricity swaps 3,333.1 32.7 5,853.4 -52.9<br />
Exchange-traded electricity options 270.4 27.8 44.7 18.9<br />
Coal forwards and swaps 10,930.3 -18.5 8,316.2 300.7<br />
Exchange-traded coal forwards 11,589.6 -63.8 8,830.7 36.0<br />
Oil derivatives 11,203.0 13.3 13,700.9 175.2<br />
Exchange-traded oil derivatives – – 40.8 35.7<br />
Gas forwards 45,231.1 125.1 28,070.8 938.5<br />
Gas swaps 601.5 25.4 5,074.0 11.4<br />
Gas options 199.3 13.9 864.1 31.4<br />
Exchange-traded gas forwards 21,948.2 57.4 1,585.2 51.0<br />
Emissions-related derivatives 147.8 0.3 424.4 -0.4<br />
Exchange-traded emissions-related derivatives 6,121.9 -451.7 4,811.9 2.4<br />
Other derivatives 59.9 63.5 68.8 7.4<br />
Other exchange-traded derivatives – – 46.6 -0.4<br />
Total 199,154.9 -481.6 154,196.3 1,636.6<br />
139
140 Notes<br />
(31) Additional Disclosures on Financial<br />
Instruments<br />
The carrying amounts of the financial instruments, their<br />
grouping into IAS 39 measurement categories, their fair values<br />
and their measurement sources by class are presented in the<br />
following table:<br />
Carrying Amounts, Fair Values and Measurement Categories by Class<br />
within the Scope of IFRS 7 as of December 31, <strong>2011</strong><br />
Total<br />
carrying<br />
amounts IAS 39<br />
within the measure-<br />
Carrying scope of ment<br />
€ in millions<br />
amounts IFRS 7 category1 Determined Derived<br />
using from active<br />
market market<br />
Fair value prices prices<br />
Equity investments 1,908 1,908 AfS 1,908 159 188<br />
Financial receivables and other financial assets 5,408 5,382 5,667 – –<br />
Receivables from finance leases 1,051 1,051 n/a 1,051 – –<br />
Other financial receivables and financial assets 4,357 4,331 LaR 4,616 – –<br />
Trade receivables and other operating assets 34,556 31,584 31,584 2,946 8,564<br />
Trade receivables 18,065 18,065 LaR 18,065<br />
Derivatives with no hedging relationships 10,874 10,874 HfT 10,874 2,946 7,674<br />
Derivatives with hedging relationships 890 890 n/a 890 – 890<br />
Other operating assets 4,727 1,755 LaR 1,755 – –<br />
Securities and fixed-term deposits 7,983 7,983 AfS 7,983 6,438 1,545<br />
Cash and cash equivalents 3,852 3,852 AfS 3,852 3,747 105<br />
Restricted cash 89 89 AfS 89 82 7<br />
Assets held for sale 620 308 AfS 308 30 278<br />
Total assets 54,416 51,106 51,391 13,402 10,687<br />
Financial liabilities 29,914 29,854 34,736 – –<br />
Bonds 23,356 23,356 AmC 28,026 – –<br />
Commercial paper 869 869 AmC 869 – –<br />
Bank loans/Liabilities to banks 1,189 1,189 AmC 1,189 – –<br />
Liabilities from finance leases 778 778 n/a 979 – –<br />
Other financial liabilities 3,722 3,662 AmC 3,673 – –<br />
Trade payables and other operating liabilities 37,786 31,477 31,477 3,592 7,361<br />
Trade payables 4,871 4,871 AmC 4,871 – –<br />
Derivatives with no hedging relationships 10,841 10,841 HfT 10,841 3,592 6,645<br />
Derivatives with hedging relationships 716 716 n/a 716 – 716<br />
Put option liabilities under IAS 32 821 821 AmC 821 – –<br />
Other operating liabilities 20,537 14,228 AmC 14,228 – –<br />
Total liabilities 67,700 61,331 66,213 3,592 7,361<br />
1 AfS: Available for sale; LaR: Loans and receivables; HfT: Held for trading; AmC: Amortized cost. The categories are described in detail in Note 1. The values of financial instruments<br />
measured at fair value (AfS, HfT, n/a) using valuation techniques with unobservable inputs (Level 3 of the fair value hierarchy) can be derived from the difference between the<br />
fair values of the two disclosed fair value hierarchies and the total fair value of the listed categories.<br />
The carrying amounts of cash and cash equivalents and of<br />
trade receivables are considered reasonable estimates of their<br />
fair values because of their short maturity.<br />
Where the value of a financial instrument can be derived from<br />
an active market without the need for an adjustment, that<br />
value is used as the fair value. This applies in particular to<br />
equities held and to bonds held and issued.
The fair value of shareholdings in unlisted <strong>com</strong>panies and<br />
of debt instruments that are not actively traded, such as<br />
loans received, loans granted and financial liabilities, is determined<br />
by discounting future cash flows. Any necessary<br />
discounting takes place using current market interest rates<br />
over the remaining terms of the financial instruments. Fair<br />
CEO Letter<br />
E.ON Stock<br />
Combined Group Management <strong>Report</strong><br />
Consolidated Financial Statements<br />
Corporate Governance <strong>Report</strong><br />
Supervisory Board and Board of Management<br />
Tables and Explanations<br />
Carrying Amounts, Fair Values and Measurement Categories by Class<br />
within the Scope of IFRS 7 as of December 31, 2010<br />
Total<br />
carrying<br />
amounts IAS 39<br />
within the measure-<br />
Carrying scope of ment<br />
€ in millions<br />
amounts IFRS 7 category1 Determined Derived<br />
using from active<br />
market market<br />
Fair value prices prices<br />
Equity investments 2,201 2,201 AfS 2,201 182 239<br />
Financial receivables and other financial assets 5,031 5,008 5,262 – –<br />
Receivables from finance leases 958 958 n/a 962 – –<br />
Other financial receivables and financial assets 4,073 4,050 LaR 4,300 – –<br />
Trade receivables and other operating assets 31,514 28,451 28,451 602 9,127<br />
Trade receivables 15,819 15,819 LaR 15,819 – –<br />
Derivatives with no hedging relationships 9,524 9,524 HfT 9,524 602 8,016<br />
Derivatives with hedging relationships 1,111 1,111 n/a 1,111 – 1,111<br />
Other operating assets 5,060 1,997 LaR 1,997 – –<br />
Securities and fixed-term deposits 5,600 5,600 AfS 5,600 4,967 633<br />
Cash and cash equivalents 6,143 6,143 AfS 6,143 6,108 35<br />
Restricted cash 433 433 AfS 433 392 41<br />
Assets held for sale 2,043 1,582 AfS 1,582 895 687<br />
Total assets 52,965 49,418 49,672 13,146 10,762<br />
Financial liabilities 32,491 32,456 35,827 – –<br />
Bonds 27,500 27,500 AmC 30,768 – –<br />
Commercial paper – – AmC – – –<br />
Bank loans/Liabilities to banks 1,041 1,041 AmC 1,041 – –<br />
Liabilities from finance leases 448 448 n/a 530 – –<br />
Other financial liabilities 3,502 3,467 AmC 3,488 – –<br />
Trade payables and other operating liabilities 32,863 25,904 25,904 1,117 7,381<br />
Trade payables 5,016 5,016 AmC 5,016 – –<br />
Derivatives with no hedging relationships 8,075 8,075 HfT 8,075 1,117 6,595<br />
Derivatives with hedging relationships 786 786 n/a 786 – 786<br />
Put option liabilities under IAS 32 829 829 AmC 829 – –<br />
Other operating liabilities 18,157 11,198 AmC 11,198 – –<br />
Total liabilities 65,354 58,360 61,731 1,117 7,381<br />
1 AfS: Available for sale; LaR: Loans and receivables; HfT: Held for trading; AmC: Amortized cost. The categories are described in detail in Note 1. The values of financial instruments<br />
measured at fair value (AfS, HfT, n/a) using valuation techniques with unobservable inputs (Level 3 of the fair value hierarchy) can be derived from the difference between the<br />
fair values of the two disclosed fair value hierarchies and the total fair value of the listed categories.<br />
value measurement was not applied in the case of shareholdings<br />
with a carrying amount of €12 million (2010: €26 million)<br />
as cash flows could not be determined reliably for them.<br />
Fair values could not be derived on the basis of <strong>com</strong>parable<br />
transactions. The shareholdings are not material by <strong>com</strong>parison<br />
with the overall position of the Group.<br />
141
142 Notes<br />
The carrying amount of <strong>com</strong>mercial paper, borrowings under<br />
revolving short-term credit facilities and trade payables is used<br />
as the fair value due to the short maturities of these items.<br />
The determination of the fair value of derivative financial<br />
instruments is discussed in Note 30. Additional shareholdings<br />
in the amount of €29 million were reported within Level 3<br />
of the fair value hierarchy in <strong>2011</strong> as a result of new valuation<br />
techniques. At the same time, derivative financial instruments<br />
in the amount of €13 million were reclassified out of this level<br />
on the basis of reliable market data. The fair values determined<br />
using valuation techniques for financial instruments carried<br />
at fair value are reconciled as shown in the following table:<br />
Fair Value Hierarchy Level 3 Reconciliation (Values Determined Using Valuation Techniques)<br />
Gains/<br />
Purchases Sales<br />
Losses in<br />
in<strong>com</strong>e<br />
Transfers<br />
Gains/<br />
Jan. 1, (including (including Settlestate- into out of Losses in Dec. 31,<br />
€ in millions<br />
<strong>2011</strong> additions) disposals) mentsment Level 3 Level 3 OCI <strong>2011</strong><br />
Equity investments<br />
Derivative financial<br />
1,780 40 -19 -1 -44 29 – -224 1,561<br />
instruments 543 – -254 -15 -611 – -13 – -350<br />
Total 2,323 40 -273 -16 -655 29 -13 -224 1,211
The following two tables illustrate the contractually agreed<br />
(undiscounted) cash outflows arising from the liabilities<br />
included in the scope of IFRS 7:<br />
Financial guarantees with a total nominal volume of<br />
€1,542 million (2010: €1,219 million) were issued to <strong>com</strong>panies<br />
outside of the Group. This amount is the maximum amount<br />
that E.ON would have to pay in the event of claims on the guarantees;<br />
a book value of €64 million (2010: €59 million) has<br />
been recognized.<br />
CEO Letter<br />
E.ON Stock<br />
Combined Group Management <strong>Report</strong><br />
Consolidated Financial Statements<br />
Corporate Governance <strong>Report</strong><br />
Supervisory Board and Board of Management<br />
Tables and Explanations<br />
Cash Flow Analysis as of December 31, <strong>2011</strong><br />
Cash<br />
Cash<br />
Cash<br />
Cash<br />
outflows outflows outflows outflows<br />
€ in millions<br />
2012<br />
2013 2014–2016 from 2017<br />
Bonds 3,913 3,350 8,750 17,976<br />
Commercial paper 870 – – –<br />
Bank loans/Liabilities to banks 758 57 287 153<br />
Liabilities from finance leases 110 91 236 1,336<br />
Other financial liabilities 1,653 282 712 1,236<br />
Financial guarantees 1,542 – – –<br />
Cash outflows for financial liabilities 8,846 3,780 9,985 20,701<br />
Trade payables 4,748 – – –<br />
Derivatives (with/without hedging relationships) 44,822 13,104 3,214 240<br />
Put option liabilities under IAS 32 265 31 163 362<br />
Other operating liabilities 13,984 34 28 186<br />
Cash outflows for trade payables and other operating liabilities 63,819 13,169 3,405 788<br />
Cash outflows for liabilities within the scope of IFRS 7 72,665 16,949 13,390 21,489<br />
Cash Flow Analysis as of December 31, 2010<br />
Cash<br />
Cash<br />
Cash<br />
Cash<br />
outflows outflows outflows outflows<br />
€ in millions<br />
<strong>2011</strong><br />
2012 2013–2015 from 2016<br />
Bonds 3,722 4,540 10,983 21,662<br />
Commercial paper – – – –<br />
Bank loans/Liabilities to banks 537 59 242 287<br />
Liabilities from finance leases 48 48 135 655<br />
Other financial liabilities 1,040 132 1,386 1,409<br />
Financial guarantees 1,219 – – –<br />
Cash outflows for financial liabilities 6,566 4,779 12,746 24,013<br />
Trade payables 5,071 – – –<br />
Derivatives (with/without hedging relationships) 15,024 5,473 1,362 390<br />
Put option liabilities under IAS 32 332 18 77 402<br />
Other operating liabilities 11,029 198 4 26<br />
Cash outflows for trade payables and other operating liabilities 31,456 5,689 1,443 818<br />
Cash outflows for liabilities within the scope of IFRS 7 38,022 10,468 14,189 24,831<br />
143
144 Notes<br />
For financial liabilities that bear floating interest rates, the<br />
rates that were fixed on the balance sheet date are used to<br />
calculate future interest payments for subsequent periods<br />
as well. Financial liabilities that can be terminated at any time<br />
are assigned to the earliest maturity band in the same way<br />
as put options that are exercisable at any time. All covenants<br />
were <strong>com</strong>plied with during <strong>2011</strong>.<br />
In gross-settled derivatives (usually currency derivatives and<br />
<strong>com</strong>modity derivatives), outflows are ac<strong>com</strong>panied by related<br />
inflows of funds or <strong>com</strong>modities.<br />
The net gains and losses from financial instruments by IAS 39<br />
category are shown in the following table:<br />
Net Gains and Losses by Category1 € in millions <strong>2011</strong> 2010<br />
Loans and receivables -136 -141<br />
Available for sale 449 2,724<br />
Held for trading -1,230 2,635<br />
Amortized cost -1,292 -1,536<br />
Total -2,209 3,682<br />
1 The categories are described in detail in Notes 2 and 9.<br />
In addition to interest in<strong>com</strong>e and expenses from financial<br />
receivables, the net gains and losses in the loans and receivables<br />
category consist primarily of valuation allowances on<br />
trade receivables. Gains and losses on the disposal of available-for-sale<br />
securities and equity investments are reported<br />
under other operating in<strong>com</strong>e and other operating expenses,<br />
respectively.<br />
The net gains and losses in the amortized cost category are<br />
due primarily to interest on financial liabilities, adjusted for<br />
capitalized construction-period interest.<br />
The net gains and losses in the held-for-trading category<br />
en<strong>com</strong>pass both the changes in fair value of the derivative<br />
financial instruments and the gains and losses on realization.<br />
The fair value measurement of <strong>com</strong>modity derivatives is<br />
the most important factor in the net result for this category.
Risk Management<br />
Principles<br />
The prescribed processes, responsibilities and actions concerning<br />
financial and risk management are described in detail<br />
in internal risk management guidelines applicable throughout<br />
the Group. The units have developed additional guidelines of<br />
their own within the confines of the Group’s overall guidelines.<br />
To ensure efficient risk management at the E. ON Group, the<br />
Trading (Front Office), Financial Controlling (Middle Office) and<br />
Financial Settlement (Back Office) departments are organized<br />
as strictly separate units. Risk controlling and reporting in the<br />
areas of interest rates, currencies, credit and liquidity management<br />
is performed by the Financial Controlling department,<br />
while risk controlling and reporting in the area of <strong>com</strong>modities<br />
is performed at Group level by a separate department.<br />
E.ON uses a Group-wide treasury, risk management and<br />
reporting system. This system is a standard information technology<br />
solution that is fully integrated and is continuously<br />
updated. The system is designed to provide for the analysis<br />
and monitoring of the E.ON Group’s exposure to liquidity,<br />
foreign exchange and interest risks. The units employ established<br />
systems for <strong>com</strong>modities. Credit risks are monitored<br />
and controlled on a Group-wide basis by Financial Controlling,<br />
with the support of a standard software package. The <strong>com</strong>modity<br />
positions of most of the global and regional units are<br />
transferred to the Trading unit for risk management and optimization<br />
purposes, based on the transfer-pricing mechanism.<br />
Special risk management, coordinated with Group Management,<br />
applies in a small number of exceptional cases.<br />
Separate Risk Committees are responsible for the maintenance<br />
and further development of the strategy set by the Board of<br />
Management of E.ON AG with regard to <strong>com</strong>modity, treasury<br />
and credit risk management policies.<br />
1. Liquidity Management<br />
The primary objectives of liquidity management at E.ON consist<br />
of ensuring ability to pay at all times, the timely satisfaction<br />
of contractual payment obligations and the optimization<br />
of costs within the E.ON Group.<br />
CEO Letter<br />
E.ON Stock<br />
Combined Group Management <strong>Report</strong><br />
Consolidated Financial Statements<br />
Corporate Governance <strong>Report</strong><br />
Supervisory Board and Board of Management<br />
Tables and Explanations<br />
Cash pooling and external financing are largely centralized at<br />
E.ON AG and certain financing <strong>com</strong>panies. The funds are transferred<br />
internally to the other Group <strong>com</strong>panies as needed.<br />
E.ON AG determines the Group’s financing requirements on<br />
the basis of short- and medium-term liquidity planning. The<br />
financing of the Group is controlled and implemented on<br />
a forward-looking basis in accordance with planned liquidity<br />
requirements. Relevant planning factors taken into consideration<br />
include operating cash flow, capital expenditures, and the<br />
maturity of bonds and <strong>com</strong>mercial paper.<br />
2. Price Risks<br />
In the normal course of business, the E.ON Group is exposed<br />
to foreign exchange, interest and <strong>com</strong>modity price risks, and<br />
also to price risks in asset management. These risks create<br />
volatility in earnings, equity, debt and cash flows from period<br />
to period. E.ON has developed a variety of strategies to limit<br />
or eliminate these risks, including the use of derivative financial<br />
instruments.<br />
3. Credit Risks<br />
E.ON is exposed to credit risk in its operating activities and<br />
through the use of financial instruments. Credit risk results<br />
from non-delivery or partial delivery by a counterparty of the<br />
agreed consideration for services rendered, from total or partial<br />
failure to make payments owing on existing accounts receivable,<br />
and from replacement risks in open transactions. Uniform<br />
credit risk management procedures are in place throughout<br />
the Group to identify, measure and control credit risks.<br />
145
146 Notes<br />
The following discussion of E.ON’s risk management activities<br />
and the estimated amounts generated from profit-at-risk (“PaR”),<br />
value-at-risk (“VaR”) and sensitivity analyses are “forwardlooking<br />
statements” that involve risks and uncertainties. Actual<br />
results could differ materially from those projected due to<br />
actual, unforeseeable developments in the global financial<br />
markets. The methods used by the Company to analyze risks<br />
should not be considered forecasts of future events or losses,<br />
as E.ON also faces risks that are either non-financial or nonquantifiable.<br />
Such risks principally include country risk, operational<br />
risk and legal risk, which are not represented in the<br />
following analyses.<br />
Foreign Exchange Risk Management<br />
E.ON AG is responsible for controlling the currency risks to<br />
which the E.ON Group is exposed.<br />
Because it holds interests in businesses outside of the euro<br />
area, currency translation risks arise within the E.ON Group.<br />
Fluctuations in exchange rates produce accounting effects<br />
attributable to the translation of the balance sheet and in<strong>com</strong>e<br />
statement items of the foreign consolidated Group <strong>com</strong>panies<br />
included in the Consolidated Financial Statements. One method<br />
used to hedge translation risks is through borrowing in the<br />
corresponding local currency, which in particular also includes<br />
shareholder loans in foreign currency. In addition, derivative<br />
financial instruments are employed as needed. The hedges<br />
qualify for hedge accounting under IFRS as hedges of net<br />
investments in foreign operations. The Group’s translation risks<br />
are reviewed at regular intervals and the level of hedging<br />
is adjusted whenever necessary. The respective debt factor and<br />
the enterprise value denominated in the foreign currency are<br />
the principal criteria governing the level of hedging.<br />
The E.ON Group is also exposed to operating and financial<br />
transaction risks arising from transactions in foreign currency.<br />
Operating transaction risks for the Group <strong>com</strong>panies arise<br />
primarily from physical and financial trading in <strong>com</strong>modities,<br />
from intragroup relationships and from capital spending in<br />
foreign currency. The subsidiaries are respon sible for controlling<br />
their operating currency risks. E.ON AG coordinates hedging<br />
throughout the Group and makes use of external derivatives<br />
as needed.<br />
Financial transaction risks result from payments originating<br />
from financial receivables and payables. They are generated<br />
both by external financing in a variety of foreign currencies,<br />
and by shareholder loans from within the Group denominated<br />
in foreign currency. Financial transaction risks are generally<br />
fully hedged.<br />
The one-day value-at-risk (99 percent confidence) from the<br />
translation of deposits and borrowings denominated in foreign<br />
currency, plus foreign-exchange derivatives, was €132 million<br />
as of December 31, <strong>2011</strong> (2010: €149 million) and resulted primarily<br />
from the positions in British pounds, Swedish kronor<br />
and U.S. dollars.<br />
Interest Risk Management<br />
E.ON is exposed to profit risks arising from financial liabilities<br />
with floating interest rates, maturities and short-term borrowings,<br />
as well as interest rate derivatives that are based<br />
on floating interest rates. Positions based on fixed interest<br />
rates, on the other hand, are subject to changes in fair value<br />
resulting from the volatility of market rates. E.ON seeks a<br />
specific mix of fixed- and floating-rate debt over time. The<br />
long-term orientation of the business model in principle means<br />
fulfilling a high proportion of financing requirements at fixed<br />
rates, especially within the planning period. This also involves<br />
the use of interest rate swaps. With interest rate derivatives<br />
included, the share of financial liabilities with fixed interest<br />
rates was 94 percent as of December 31, <strong>2011</strong> (2010: 93 percent).<br />
Under otherwise unchanged circumstances, the volume of<br />
financial liabilities with fixed interest rates, which amounted to<br />
€21.7 billion at year-end <strong>2011</strong>, would decline to €19.2 billion<br />
in 2012 and to €15.6 billion in 2013. The effective interest rate<br />
duration of the financial liabilities, including interest rate derivatives,<br />
was 6.6 years as of December 31, <strong>2011</strong> (2010: 7.1 years).<br />
As of December 31, <strong>2011</strong>, the E.ON Group held interest rate<br />
derivatives with a nominal value of €5,637 million (2010:<br />
€5,718 million).
A sensitivity analysis was performed on the Group’s short-term<br />
floating-rate borrowings, including hedges of both foreign<br />
exchange risk and interest risk. This measure is used for internal<br />
risk controlling and reflects the economic position of<br />
the E.ON Group. A one-percentage-point upward or downward<br />
change in interest rates (across all currencies) would cause<br />
interest charges to respectively increase or decrease by €13 million<br />
in the subsequent fiscal year (2010: €30 million increase<br />
or decrease).<br />
Commodity Price Risk Management<br />
E.ON is exposed to substantial risks resulting from fluctuations<br />
in the prices of <strong>com</strong>modities, both on the supply and demand<br />
side. This risk is measured based on potential negative deviation<br />
from the target EBITDA.<br />
The maximum permissible risk is determined centrally by the<br />
Board of Management in its medium-term planning and translated<br />
into a decentralized limit structure in coordination with<br />
the units. Before fixing any limits, the investment plans and<br />
all other known obligations and quantifiable risks have been<br />
taken into account. Risk controlling and reporting, including<br />
portfolio optimization, is steered centrally for the Group by<br />
Group Management.<br />
E.ON conducts <strong>com</strong>modity transactions primarily within the<br />
system portfolio, which includes core operations, existing sales<br />
and procurement contracts and any <strong>com</strong>modity derivatives<br />
used for hedging purposes or for power plant optimi zation.<br />
The risk in the system portfolio thus arises from the open<br />
position between planned procurement and generation and<br />
planned sales volumes. The risk of these open positions is<br />
measured using the profit-at-risk number, which quantifies the<br />
risk by taking into account the size of the open position and<br />
the prices, the volatility and the liquidity of the under lying <strong>com</strong>modities.<br />
PaR is defined as the maximum potential negative<br />
change in the value of the open position at a probability of<br />
95 percent in the event that the open position is closed as<br />
quickly as possible.<br />
The principal derivative instruments used by E.ON to cover<br />
<strong>com</strong>modity price risk exposures are electricity, gas, coal and oil<br />
swaps and forwards, as well as emissions-related derivatives.<br />
Commodity derivatives are used by the units for the purposes<br />
CEO Letter<br />
E.ON Stock<br />
Combined Group Management <strong>Report</strong><br />
Consolidated Financial Statements<br />
Corporate Governance <strong>Report</strong><br />
Supervisory Board and Board of Management<br />
Tables and Explanations<br />
of price risk management, system optimization, equalization of<br />
burdens, and even for the improvement of margins. Proprietary<br />
trading is permitted only within very tightly defined limits.<br />
The risk measure used for the proprietary trading portfolio is<br />
a five-day value-at-risk with a 95- percent confidence interval.<br />
The trading limits for proprietary trading as well as for all other<br />
trading activities are established and monitored by bodies<br />
that are independent from trading operations. A three-year<br />
planning horizon, with defined limits, is applied for the system<br />
portfolio. Limits used on hedging and proprietary trading<br />
activities include five-day value-at-risk and profit-at-risk numbers,<br />
as well as stop-loss limits. Additional key elements of the<br />
risk management system are a set of Group-wide <strong>com</strong>modity risk<br />
guidelines, the clear division of duties between scheduling,<br />
trading, settlement and controlling, as well as a risk reporting<br />
system independent from trading operations. Commodity positions<br />
and associated risks throughout the Group are reported<br />
to the members of the Risk Committee on a monthly basis.<br />
As of December 31, <strong>2011</strong>, the E.ON Group has entered into<br />
electricity, gas, coal, oil and emissions-related derivatives with<br />
a nominal value of €199,155 million (2010: €154,196 million).<br />
The VaR for the proprietary trading portfolio amounted to<br />
€19 million as of December 31, <strong>2011</strong> (2010: €20 million). The PaR<br />
for the financial and physical <strong>com</strong>modity positions held in<br />
the system portfolio over a three-year planning horizon was<br />
€2,860 million as of December 31, <strong>2011</strong> (2010: €2,454 million).<br />
The calculation of the PaR reflects the economic position of the<br />
E.ON Group over a planning horizon of three years, and in<br />
addition to the financial instruments included in the scope of<br />
IFRS 7, also en<strong>com</strong>passes the remaining <strong>com</strong>modity positions.<br />
This economic position is also used for internal risk controlling.<br />
147
148 Notes<br />
Credit Risk Management<br />
In order to minimize credit risk arising from operating activities<br />
and from the use of financial instruments, the Company enters<br />
into transactions only with counterparties that satisfy the Company’s<br />
internally established minimum requirements. Maximum<br />
credit risk limits are set on the basis of internal and, where<br />
available, external credit ratings. The setting and monitoring of<br />
credit limits is subject to certain minimum requirements, which<br />
are based on Group-wide credit risk management guidelines.<br />
Long-term operating contracts and asset management transactions<br />
are not <strong>com</strong>prehensively included in this process. They<br />
are monitored separately at the level of the responsible units.<br />
In principle, each Group <strong>com</strong>pany is responsible for managing<br />
credit risk in its operating activities. Depending on the nature<br />
of the operating activities and the credit limit, additional credit<br />
risk monitoring and controls are performed both by the units<br />
and by Group Management. Monthly reports on credit limits,<br />
including their utilization, are submitted to the Risk Committee.<br />
Intensive, standardized monitoring of quantitative and<br />
qualitative early-warning indicators, as well as close monitoring<br />
of the credit quality of counterparties, enable E.ON to act early<br />
in order to minimize risk.<br />
To the extent possible, pledges of collateral are negotiated<br />
with counterparties for the purpose of reducing credit risk.<br />
Accepted as collateral are guarantees issued by the respective<br />
parent <strong>com</strong>panies or evidence of profit-and-loss-pooling<br />
agreements in <strong>com</strong>bination with letters of awareness. To a<br />
lesser extent, the Company also requires bank guarantees<br />
and deposits of cash and securities as collateral to reduce credit<br />
risk. Risk-management collateral was accepted in the amount<br />
of €5,969 million.<br />
The levels and backgrounds of financial assets received as collateral<br />
are described in more detail in Notes 18 and 26.<br />
Derivative transactions are generally executed on the basis of<br />
standard agreements that allow for the netting of all open<br />
transactions with individual counterparties. For currency and<br />
interest rate derivatives in the banking sector, this netting<br />
option is reflected in the accounting treatment. To further reduce<br />
credit risk, bilateral margining agreements are entered into<br />
with selected counterparties. Limits are imposed on the credit<br />
and liquidity risk resulting from bilateral margining agreements.<br />
Exchange-traded forward and option contracts as well as<br />
exchange-traded emissions-related derivatives having an<br />
aggregate nominal value of €49,360 million as of December 31,<br />
<strong>2011</strong>, (2010: €26,726 million) bear no credit risk. For the remaining<br />
financial instruments, the maximum risk of default is equal<br />
to their carrying amounts.
Virtually all of the investments in debt instruments have an<br />
external investment-grade rating.<br />
At E.ON, liquid funds are normally invested at banks with good<br />
credit ratings, in top-rated money market funds or in shortterm<br />
securities (for example, <strong>com</strong>mercial paper) of issuers<br />
with strong credit ratings. Bonds of public and private issuers<br />
are also selected for investment. Group <strong>com</strong>panies that for<br />
legal reasons are not included in the cash pool invest money<br />
at leading local banks. Standardized credit assessment and<br />
limit-setting is <strong>com</strong>plemented by daily monitoring of CDS levels<br />
at the banks and at other significant counterparties.<br />
Asset Management<br />
For the purpose of financing long-term payment obligations,<br />
including those relating to asset retirement obligations (see<br />
Note 25), financial investments totaling €4.9 billion (2010:<br />
€4.7 billion) were held by German E.ON Group <strong>com</strong>panies as<br />
of December 31, <strong>2011</strong>.<br />
These financial assets are invested on the basis of an accumulation<br />
strategy (total-return approach), with investments<br />
broadly diversified across the money market, bond, real estate<br />
and equity asset classes. Asset allocation studies are performed<br />
at regular intervals to determine the target portfolio<br />
structure. The majority of the assets is held in investment<br />
funds managed by external fund managers. Corporate Asset<br />
Management at E.ON AG, which is part of the Company’s<br />
Finance Department, is responsible for continuous monitoring<br />
of overall risks and those concerning individual fund managers.<br />
Risk management is based on a risk budget whose usage is<br />
monitored regularly. The three-month VaR with a 98-percent<br />
confidence interval for these financial assets totaled €158 million<br />
(2010: €107 million).<br />
CEO Letter<br />
E.ON Stock<br />
Combined Group Management <strong>Report</strong><br />
Consolidated Financial Statements<br />
Corporate Governance <strong>Report</strong><br />
Supervisory Board and Board of Management<br />
Tables and Explanations<br />
In addition, the mutual insurance fund Versorgungskasse<br />
Energie VVaG (“VKE”) manages financial assets that are for<br />
the most part dedicated to the coverage of employee retirement<br />
benefits at E.ON Group <strong>com</strong>panies in Germany; these<br />
assets totaled €0.6 billion at year-end <strong>2011</strong> (2010: €0.6 billion).<br />
The assets at VKE do not constitute plan assets under IAS 19<br />
(see Note 24) and are shown as non-current and current assets<br />
on the balance sheet. The majority of the diversified portfolio,<br />
consisting of money market instruments, bonds, real estate<br />
and equities, is held in investment funds managed by external<br />
fund managers. VKE is subject to the provisions of the Insurance<br />
Supervision Act (“Versicherungs aufsichts gesetz” or<br />
“VAG”) and its operations are supervised by the German Federal<br />
Financial Supervisory Authority (“Bundes anstalt für<br />
Finanzdienst leistungs aufsicht” or “BaFin”). Financial investments<br />
and continuous risk management are conducted within<br />
the regulatory confines set by BaFin. The three-month VaR<br />
with a 98-percent confidence interval for these financial assets<br />
was €18.7 million (2010: €18.4 million).<br />
149
150 Notes<br />
(32) Transactions with Related Parties<br />
E.ON exchanges goods and services with a large number of<br />
<strong>com</strong>panies as part of its continuing operations. Some of these<br />
<strong>com</strong>panies are related parties, the most significant of which<br />
are associated <strong>com</strong>panies accounted for under the equity<br />
method. Additionally reported as related parties are joint ventures,<br />
as well as equity interests carried at fair value and<br />
unconsolidated subsidiaries, which are of lesser importance<br />
as regards the extent of the transactions described in the<br />
following discussion. Transactions with related parties are<br />
summarized as follows:<br />
Related-Party Transactions<br />
€ in millions <strong>2011</strong> 2010<br />
In<strong>com</strong>e 2,473 2,845<br />
Associated <strong>com</strong>panies 2,191 2,155<br />
Joint ventures 154 579<br />
Other related parties 128 111<br />
Expenses 2,292 2,357<br />
Associated <strong>com</strong>panies 1,654 1,563<br />
Joint ventures 228 476<br />
Other related parties 410 318<br />
Receivables 1,798 1,827<br />
Associated <strong>com</strong>panies 1,297 1,102<br />
Joint ventures 302 522<br />
Other related parties 199 203<br />
Liabilities 2,909 737<br />
Associated <strong>com</strong>panies 2,123 424<br />
Joint ventures 81 58<br />
Other related parties 705 255<br />
In<strong>com</strong>e from transactions with related <strong>com</strong>panies is generated<br />
mainly through the delivery of gas and electricity to distributors<br />
and municipal entities, especially municipal utilities. The<br />
relationships with these entities do not generally differ from<br />
those that exist with municipal entities in which E.ON does not<br />
have an interest.<br />
Expenses from transactions with related <strong>com</strong>panies are<br />
generated mainly through the procurement of gas, coal and<br />
electricity.<br />
Receivables from related <strong>com</strong>panies consist mainly of trade<br />
receivables.<br />
Liabilities of E.ON payable to related <strong>com</strong>panies as of<br />
December 31, <strong>2011</strong>, include €859 million (2010: €132 million)<br />
in trade payables to operators of jointly-owned nuclear<br />
power plants. These payables bear interest at 1.0 percent or<br />
at one-month EURIBOR less 0.05 percent per annum (2010:<br />
1.0 percent) and have no fixed maturity. E.ON continues to have<br />
in place with these power plants a cost-transfer agreement<br />
and a cost-plus-fee agreement for the procurement of electricity.<br />
The settlement of such liabilities occurs mainly through<br />
clearing accounts. In addition, E.ON reported financial liabilities<br />
of €891 million on December 31, <strong>2011</strong>, (2010: €0 million) resulting<br />
from fixed-term deposits undertaken by the jointly-owned<br />
nuclear power plants at E.ON.
Under IAS 24, <strong>com</strong>pensation paid to key management personnel<br />
(members of the Board of Management and of the Supervisory<br />
Board of E.ON AG) must be disclosed. The total expense<br />
for <strong>2011</strong> amounted to €13.5 million (2010: €12.3 million) in<br />
short-term benefits and €0 million (2010: €12.3 million) in<br />
termination benefits, as well as €2.4 million (2010: €2.0 million)<br />
in post-employment benefits.<br />
The service cost of post-employment benefits is equal to the<br />
service cost of the provisions for pensions.<br />
The expense determined in accordance with IFRS 2 for the<br />
tranches of the E.ON Share Performance Plan in existence in<br />
<strong>2011</strong> was €0.6 million (2010: €1.7 million).<br />
(33) Segment Information<br />
Led by its Group Management in Düsseldorf, Germany, the<br />
E. ON Group (“E.ON” or the “Group”) is segmented into global<br />
and regional units, which are reported here in accordance<br />
with International Financial <strong>Report</strong>ing Standard (“IFRS”) 8,<br />
“Operating Segments” (“IFRS 8”). The new structure took<br />
effect at the beginning of <strong>2011</strong>. The prior-year <strong>com</strong>parative<br />
figures of the former market units have been reconciled to<br />
these new units:<br />
Global Units<br />
The global units are reported separately in accordance with<br />
IFRS 8.<br />
Generation<br />
This global unit consists of the Group’s conventional (fossil<br />
and nuclear) generation assets in Europe. It manages and<br />
optimizes these assets across national boundaries.<br />
Renewables<br />
E.ON also takes a global approach to managing its carbonsourcing<br />
and renewables businesses. The objective at this<br />
unit is to extend the Group’s leading position in the growing<br />
renewables market.<br />
Gas<br />
This global unit is responsible for gas procurement (including<br />
E.ON’s own gas production) and for project and product<br />
development in gas storage, gas transport, liquefied natural<br />
gas and technical asset support.<br />
CEO Letter<br />
E.ON Stock<br />
Combined Group Management <strong>Report</strong><br />
Consolidated Financial Statements<br />
Corporate Governance <strong>Report</strong><br />
Supervisory Board and Board of Management<br />
Tables and Explanations<br />
Members of the Supervisory Board received a total of<br />
€4.8 million for their activity in <strong>2011</strong> (2010: €4.9 million).<br />
Furthermore, no transactions with key management personnel<br />
at non-market terms have taken place.<br />
Detailed, individualized information on <strong>com</strong>pensation can be<br />
found in the Compensation <strong>Report</strong> on pages 180 through 189.<br />
Trading<br />
This unit is responsible for E.ON’s trading activities in power,<br />
gas, coal, oil and carbon allowances, and is active on all major<br />
European energy exchanges.<br />
Regional Units<br />
E.ON’s distribution and sales operations in Europe are managed<br />
by twelve regional units in total.<br />
For segment reporting purposes, the Germany, U.K., Sweden,<br />
Czechia and Hungary regional units are reported separately.<br />
E.ON’s power generation business in Russia is additionally<br />
reported as a special-focus region.<br />
151
152 Notes<br />
Those units not reported separately are instead reported<br />
collectively as “Other regional units.” They include the Italy,<br />
Spain, France, Netherlands, Slovakia, Romania and Bulgaria<br />
regional units.<br />
Group Management/Consolidation contains E.ON AG itself<br />
(“E.ON” or the “Company”), the interests held directly by E.ON AG,<br />
as well as the consolidation effects that take place at Group<br />
level.<br />
Since January 1, <strong>2011</strong>, EBITDA has been the key measure at<br />
E. ON for purposes of internal management control and as an<br />
indicator of a business’s long-term earnings power. EBITDA<br />
is derived from in<strong>com</strong>e/loss before interest, taxes, depreciation<br />
and amortization (including impairments and reversals) and<br />
adjusted to exclude extraordinary effects. The adjustments<br />
include economic net interest in<strong>com</strong>e, net book gains, costmanagement<br />
and restructuring expenses, as well as other nonoper<br />
ating in<strong>com</strong>e and expenses.<br />
Economic net interest in<strong>com</strong>e is calculated by taking the net<br />
interest in<strong>com</strong>e shown in the in<strong>com</strong>e statement and adjusting<br />
it using economic criteria and excluding extraordinary effects,<br />
namely, the portions of interest expense that are non-operating.<br />
Net book gains are equal to the sum of book gains and losses<br />
from disposals, which are included in other operating in<strong>com</strong>e<br />
and other operating expenses. Cost-management and restructuring<br />
expenses are non-recurring in nature. Other non-operating<br />
earnings en<strong>com</strong>pass other non-operating in<strong>com</strong>e and<br />
expenses that are unique or rare in nature. Depending on the<br />
case, such in<strong>com</strong>e and expenses may affect different line items<br />
in the in<strong>com</strong>e statement. For example, effects from the marking<br />
to market of derivatives are included in other operating<br />
in<strong>com</strong>e and expenses, while impairment charges on property,<br />
plant and equipment are included in depreciation, amortization<br />
and impairments.<br />
Due to the adjustments, the key figures by segment may<br />
differ from the corresponding IFRS figures reported in the<br />
Consolidated Financial Statements.<br />
The following table shows the reconciliation of our EBITDA to<br />
net in<strong>com</strong>e/loss as reported in the IFRS Consolidated Financial<br />
Statements:<br />
Net In<strong>com</strong>e/Loss<br />
€ in millions <strong>2011</strong> 2010<br />
EBITDA1 9,293 13,346<br />
Depreciation and amortization -3,689 -3,752<br />
Impairments (-)/Reversals (+) 2 -166 -140<br />
EBIT1 5,438 9,454<br />
Economic interest in<strong>com</strong>e (net) -1,776 -2,257<br />
Net book gains/losses<br />
Restructuring/cost-management<br />
1,221 2,873<br />
expenses -586 -621<br />
E.ON 2.0 restructuring expenses -801 –<br />
Impairment charges2 -3,004 -2,598<br />
Other non-operating earnings<br />
In<strong>com</strong>e/Loss (-) from continuing<br />
-3,403 2,212<br />
operations before taxes -2,911 9,063<br />
In<strong>com</strong>e taxes 1,036 -1,946<br />
In<strong>com</strong>e/Loss (-) from continuing operations -1,875 7,117<br />
In<strong>com</strong>e/Loss (-) from discontinued<br />
operations, net 14 -836<br />
Net in<strong>com</strong>e/loss (-) -1,861 6,281<br />
Attributable to shareholders of E.ON AG -2,219 5,853<br />
Attributable to non-controlling interests 358 428<br />
1 Adjusted for extraordinary effects (see glossary).<br />
2 Impairments differ from the amounts reported in accordance with IFRS due to<br />
impairments on <strong>com</strong>panies accounted for under the equity method and impairments<br />
on other financial assets, and also due to impairments recognized in nonoperating<br />
earnings.
Net book gains in <strong>2011</strong> decreased by €1,652 million, or 58 percent,<br />
from the previous year’s level. Book gains in <strong>2011</strong> were<br />
generated mainly through the disposal of the remaining Gazprom<br />
stake, the sale of the network operator in the United<br />
Kingdom, the disposal of the gas distribution network in Sweden<br />
and the sale of securities. The figure for 2010 consisted<br />
primarily of the book gain on the sale of Gazprom shares,<br />
the disposal of generating capacity and the sale of the ultrahigh-voltage<br />
transmission system (transpower) in the context<br />
of the <strong>com</strong> mitment made to the European Commission.<br />
Cost-management and restructuring expenses decreased by<br />
€35 million in the reporting period. As in 2010, the expenses<br />
related to structural measures at German regional utilities<br />
and at the regional units in the United Kingdom and in France.<br />
Further expenses were incurred in <strong>2011</strong> in connection with IT<br />
restructuring.<br />
Restructuring expenses in the context of the E.ON 2.0 program<br />
consisted in particular of obligations under early-retirement<br />
agreements and severance packages.<br />
In the fourth quarter of <strong>2011</strong>, impairment losses were recognized<br />
on non-current assets and goodwill in the amount of €3 billion.<br />
In Spain and Italy, a more pessimistic view on long-term power<br />
prices, regulatory interventions and reduced load hours for<br />
gas and coal power plants necessitated impairment charges in<br />
these countries totaling approximately €1.9 billion. €1.6 billion<br />
of this amount relates to conventional generation, €0.1 billion<br />
is attributable to generation from renewables and €0.2 billion<br />
relates to the regional business in Italy. In Hungary and in<br />
the Slovak Republic, generation volumes and margins have<br />
also failed to meet expectations, with the result that impairments<br />
of €0.3 billion had to be recognized on power generation<br />
assets and another €0.2 billion on the regional business in<br />
Hungary. The remaining impairments resulted in write-downs<br />
of €0.6 billion. Of this total, amounts of €0.2 billion were<br />
respectively attributable to generation assets and to the regional<br />
business in the Benelux countries. The principal reasons for<br />
this are the earlier than previously scheduled shutdowns of<br />
older generation assets and reduced revenues from heat-run<br />
power plants and the consumer heating business due to<br />
CEO Letter<br />
E.ON Stock<br />
Combined Group Management <strong>Report</strong><br />
Consolidated Financial Statements<br />
Corporate Governance <strong>Report</strong><br />
Supervisory Board and Board of Management<br />
Tables and Explanations<br />
adverse market developments. In 2010, this item consisted<br />
primarily of impairment charges of €2.6 billion on goodwill and<br />
on other non-current assets at the activities in Italy, Spain<br />
and France acquired from Enel/Acciona and Endesa (see also<br />
Note 14).<br />
Other non-operating earnings include, among other things, the<br />
marking to market of derivatives used to protect the operating<br />
businesses from fluctuations in prices. As of December 31,<br />
<strong>2011</strong>, this marking to market produced a negative effect of<br />
€1,805 million, <strong>com</strong>pared with a positive effect of €2,711 million<br />
in 2010. Aside from the impairments recognized in the<br />
fourth quarter, additional interim impairments were also identified.<br />
These relate primarily to write-downs on non-current<br />
assets in connection with the amendment of the Atomgesetz<br />
in Germany and on exploration licenses in the gas business.<br />
There were additional negative effects in <strong>2011</strong> from the reclassification<br />
from equity of currency translation effects in the<br />
course of simplifying E.ON’s corporate structure and from prepayment<br />
penalties, incurred as part of the announced intention<br />
to reduce debt, that are materially related to proceeds generated<br />
from sales of businesses.<br />
An additional adjustment to the internal profit analysis relates<br />
to net interest in<strong>com</strong>e, which is presented based on economic<br />
considerations. Economic net interest in<strong>com</strong>e is calculated by<br />
taking the net interest in<strong>com</strong>e from the in<strong>com</strong>e statement<br />
and adjusting it using economic criteria and excluding certain<br />
extraordinary (that is, non-operating) effects.<br />
Economic Net Interest In<strong>com</strong>e<br />
€ in millions<br />
Interest and similar expenses (net)<br />
as shown in the Consolidated<br />
<strong>2011</strong> 2010<br />
Statements of In<strong>com</strong>e<br />
Non-operating interest expense (+)/<br />
-2,094 -2,303<br />
in<strong>com</strong>e (-) 318 46<br />
Economic interest in<strong>com</strong>e (net) -1,776 -2,257<br />
At -€1,776 million, economic net interest in<strong>com</strong>e increased over<br />
its 2010 level of -€2,257 million. The reason for the increase<br />
was a reduced interest expense resulting from the lower level<br />
of net debt during the year and from the reversal of provisions<br />
recognized in 2010 for negative interest effects from advance<br />
payments into the renewable energy support fund.<br />
Transactions within the E.ON Group are generally effected at<br />
market prices.<br />
153
154 Notes<br />
Financial Information by Business Segment<br />
Generation Renewables Gas<br />
€ in millions<br />
<strong>2011</strong> 2010 <strong>2011</strong> 2010 <strong>2011</strong> 2010<br />
External sales 3,737 4,838 781 688 5,473 5,712<br />
Intersegment sales 11,242 9,903 1,658 1,255 17,539 15,636<br />
Sales 14,979 14,741 2,439 1,943 23,012 21,348<br />
EBITDA 1 2,114 3,757 1,459 1,207 1,533 1,975<br />
Earnings from <strong>com</strong>panies accounted for under the equity method 2 8 76 11 13 439 477<br />
Operating cash flow before interest and taxes 2,644 3,917 1,376 1,370 810 1,382<br />
Investments 1,711 2,592 1,114 1,260 1,204 1,244<br />
1 Adjusted for extraordinary effects (see glossary).<br />
2 Under IFRS, impairments on <strong>com</strong>panies accounted for under the equity method and impairments on other financial assets (and any reversals of such charges) are included<br />
in in<strong>com</strong>e/loss (-) from <strong>com</strong>panies accounted for under the equity method and financial results, respectively. These in<strong>com</strong>e effects are not part of EBITDA.<br />
Financial Information by Business Segment—Presentation of Other EU Countries<br />
U.K. Sweden Czechia<br />
€ in millions<br />
<strong>2011</strong> 2010 <strong>2011</strong> 2010 <strong>2011</strong> 2010<br />
External sales 8,467 8,598 2,716 2,942 2,629 2,172<br />
Intersegment sales 87 134 206 293 136 166<br />
Sales 8,554 8,732 2,922 3,235 2,765 2,338<br />
EBITDA 1,2 523 966 672 629 470 323<br />
Earnings from <strong>com</strong>panies accounted for under the equity method 3 – -20 5 14 41 45<br />
Operating cash flow before interest and taxes 154 1,016 622 595 230 349<br />
Investments 212 523 422 427 200 198<br />
1 Adjusted for extraordinary effects (see glossary).<br />
2 The <strong>2011</strong> EBITDA figure for the U.K. regional unit includes €173 million in earnings contributed by Central Networks, which was sold effective April 1, <strong>2011</strong>.<br />
3 Under IFRS, impairments on <strong>com</strong>panies accounted for under the equity method and impairments on other financial assets (and any reversals of such charges) are included<br />
in in<strong>com</strong>e/loss (-) from <strong>com</strong>panies accounted for under the equity method and financial results, respectively. These in<strong>com</strong>e effects are not part of EBITDA.<br />
The following table shows the reconciliation of operating<br />
cash flow before interest and taxes to operating cash flow:<br />
Operating Cash Flow<br />
€ in millions<br />
Operating cash flow before<br />
<strong>2011</strong> 2010<br />
Difference<br />
interest and taxes 7,859 12,425 -4,566<br />
Interest payments -1,200 -1,085 -115<br />
Tax payments -49 -726 677<br />
Operating cash flow 6,610 10,614 -4,004<br />
The investments presented here are the purchases of investments<br />
reported in the Consolidated Statements of Cash Flows.
CEO Letter<br />
E.ON Stock<br />
Combined Group Management <strong>Report</strong><br />
Consolidated Financial Statements<br />
Corporate Governance <strong>Report</strong><br />
Supervisory Board and Board of Management<br />
Tables and Explanations<br />
Trading Germany Other EU Countries Russia<br />
Group Management/<br />
Consolidation E.ON Group<br />
<strong>2011</strong> 2010 <strong>2011</strong> 2010 <strong>2011</strong> 2010 <strong>2011</strong> 2010 <strong>2011</strong> 2010 <strong>2011</strong> 2010<br />
44,695 25,225 34,776 33,546 21,788 21,523 1,615 1,252 89 79 112,954 92,863<br />
25,768 22,723 2,468 2,857 1,244 1,131 – – -59,919 -53,505 0 0<br />
70,463 47,948 37,244 36,403 23,032 22,654 1,615 1,252 -59,830 -53,426 112,954 92,863<br />
-631 1,205 2,421 2,463 2,259 2,583 553 377 -415 -221 9,293 13,346<br />
– – 78 106 117 129 – – – 7 653 808<br />
-327 1,300 1,672 1,731 1,575 2,419 610 389 -501 -83 7,859 12,425<br />
24 16 910 1,083 1,210 1,565 322 433 29 93 6,524 8,286<br />
Hungary Other regional units Other EU Countries<br />
<strong>2011</strong> 2010 <strong>2011</strong> 2010 <strong>2011</strong> 2010<br />
1,916 1,990 6,060 5,821 21,788 21,523<br />
32 42 783 496 1,244 1,131<br />
1,948 2,032 6,843 6,317 23,032 22,654<br />
223 250 371 415 2,259 2,583<br />
– – 71 90 117 129<br />
197 266 372 193 1,575 2,419<br />
147 158 229 259 1,210 1,565<br />
155
156 Notes<br />
Additional Entity-Level Disclosures<br />
External sales by product break down as follows:<br />
Segment Information by Product<br />
€ in millions <strong>2011</strong> 2010<br />
Electricity 59,946 55,167<br />
Gas 46,068 31,731<br />
Other 6,940 5,965<br />
Total 112,954 92,863<br />
The “Other” item consists in particular of revenues generated<br />
from services and from other trading activities.<br />
The following table breaks down external sales (by location of<br />
customers and by location of seller), as well as property, plant<br />
and equipment, by geographic area:<br />
Geographic Segment Information<br />
Germany United Kingdom Sweden Europe (other) Other Total<br />
€ in millions<br />
External sales by<br />
<strong>2011</strong> 2010 <strong>2011</strong> 2010 <strong>2011</strong> 2010 <strong>2011</strong> 2010 <strong>2011</strong> 2010 <strong>2011</strong> 2010<br />
location of customer<br />
External sales by<br />
47,519 49,824 31,924 12,969 4,511 4,844 28,308 24,832 692 394 112,954 92,863<br />
location of seller<br />
Property, plant and<br />
83,511 62,966 8,759 8,797 2,800 2,968 17,661 17,942 223 190 112,954 92,863<br />
equipment 20,900 20,562 5,307 9,266 9,097 8,856 17,627 19,576 2,938 2,610 55,869 60,870<br />
E.ON’s customer structure did not result in any major concentration<br />
in any given geographical region or business area. Due<br />
to the large number of customers the Company serves and<br />
the variety of its business activities, there are no indi vidual<br />
customers whose business volume is material <strong>com</strong>pared with<br />
the Company’s total business volume.<br />
Gas is procured primarily from Russia, Norway, Germany, the<br />
Netherlands and Denmark.
(34) Compensation of Supervisory Board and<br />
Board of Management<br />
Supervisory Board<br />
Total remuneration to members of the Supervisory Board in<br />
<strong>2011</strong> amounted to €4.8 million (2010: €4.9 million).<br />
As in 2010, there were no loans to members of the Supervisory<br />
Board in <strong>2011</strong>.<br />
The Supervisory Board’s <strong>com</strong>pensation structure and the<br />
amounts for each member of the Supervisory Board are presented<br />
on pages 180 and 181 in the Compensation <strong>Report</strong>,<br />
which is part of the Combined Group Management <strong>Report</strong>.<br />
Additional information about the members of the Supervisory<br />
Board is provided on pages 194 and 195.<br />
Board of Management<br />
CEO Letter<br />
E.ON Stock<br />
Combined Group Management <strong>Report</strong><br />
Consolidated Financial Statements<br />
Corporate Governance <strong>Report</strong><br />
Supervisory Board and Board of Management<br />
Tables and Explanations<br />
Total remuneration to members of the Board of Management<br />
in <strong>2011</strong> amounted to €17.6 million (2010: €15.4 million). This<br />
consisted of base salary, bonuses, other <strong>com</strong>pensation elements<br />
and share-based payments.<br />
Total payments to former members of the Board of Management<br />
and their beneficiaries amounted to €9.5 million (2010:<br />
€25.4 million). Provisions of €137.7 million (2010: €136.6 million)<br />
have been established for the pension obligations to former<br />
members of the Board of Management and their beneficiaries.<br />
As in 2010, there were no loans to members of the Board of<br />
Management in <strong>2011</strong>.<br />
The Board of Management’s <strong>com</strong>pensation structure and the<br />
amounts for each member of the Board of Management are<br />
presented on pages 182 through 189 in the Compensation<br />
<strong>Report</strong>, which is part of the Combined Group Management<br />
<strong>Report</strong>.<br />
Additional information about the members of the Board of<br />
Management is provided on page 203.<br />
157
158 Declaration of the Board of Management<br />
To the best of our knowledge, we declare that, in accordance<br />
with appli cable financial reporting principles, the Consolidated<br />
Financial Statements give a true and fair view of the assets,<br />
liabilities, financial position and profit or loss of the Group, and<br />
the Group Management <strong>Report</strong>, which is <strong>com</strong>bined with the<br />
management report of E.ON AG, provides a fair review of the<br />
development and performance of the business and the position<br />
of the E.ON Group, together with a description of the principal<br />
opportunities and risks associated with the expected<br />
development of the Group.<br />
Düsseldorf, February 28, 2012<br />
The Board of Management<br />
Teyssen<br />
Kildahl<br />
Maubach<br />
Reutersberg Schenck<br />
Stachelhaus
Notes<br />
(36) List of Shareholdings Pursuant to<br />
Section 313 (2) HGB<br />
CEO Letter<br />
E.ON Stock<br />
Combined Group Management <strong>Report</strong><br />
Consolidated Financial Statements<br />
Corporate Governance <strong>Report</strong><br />
Supervisory Board and Board of Management<br />
Tables and Explanations<br />
Name, location Stake (%)<br />
2PRCE Énergies SARL, FR, La Camp du Castellet2 100.0<br />
AB Lietūvos Dūjos, LT, Vilnius4 38.9<br />
AB Svafo, SE, Stockholm5 22.0<br />
Abfallwirtschaft Schleswig-Flensburg GmbH, DE, Schleswig5 49.0<br />
Abfallwirtschaft Südholstein GmbH (AWSH), DE,<br />
Elmenhorst5 49.0<br />
Abfallwirtschaftsgesellschaft Dithmarschen mbH, DE, Heide5 49.0<br />
Abfallwirtschaftsgesellschaft Höxter mbH, DE, Höxter5 49.0<br />
Abfallwirtschaftsgesellschaft Rendsburg-Eckernförde<br />
mbH, DE, Borgstedt5 Abwasser und Service Burg, Hochdonn GmbH, DE, Burg<br />
49.0<br />
5 Abwasser und Service Satrup GmbH (ASG), DE, Satrup<br />
44.0<br />
5 Abwasserbeseitigung Nortorf-Land GmbH, DE, Nortorf<br />
49.0<br />
5 Abwasserentsorgung Albersdorf GmbH, DE, Albersdorf<br />
49.0<br />
5 Abwasserentsorgung Amt Achterwehr GmbH, DE,<br />
Achterwehr<br />
49.0<br />
5 Abwasserentsorgung Bargteheide GmbH, DE, Bargteheide<br />
49.0<br />
5 Abwasserentsorgung Berkenthin GmbH, DE, Berkenthin<br />
29.0<br />
5 Abwasserentsorgung Bleckede GmbH, DE, Bleckede<br />
44.0<br />
5 Abwasserentsorgung Brunsbüttel GmbH (ABG), DE,<br />
Brunsbüttel<br />
49.0<br />
5 Abwasserentsorgung Friedrichskoog GmbH, DE,<br />
Friedrichskoog<br />
49.0<br />
5 49.0<br />
Abwasserentsorgung Kappeln GmbH, DE, Kappeln5 Abwasserentsorgung Kropp GmbH, DE, Kropp<br />
49.0<br />
5 Abwasserentsorgung Marne-Land GmbH, DE,<br />
Diekhusen-Fahrstedt<br />
49.0<br />
5 Abwasserentsorgung Schladen GmbH, DE, Schladen<br />
49.0<br />
5 Abwasserentsorgung Schöppenstedt GmbH, DE,<br />
Schöppenstedt<br />
49.0<br />
5 Abwasserentsorgung St. Michaelisdonn, Averlak, Dingen,<br />
Eddelak GmbH, DE, St. Michaelisdonn<br />
49.0<br />
5 Abwasserentsorgung Tellingstedt GmbH, DE, Tellingstedt<br />
25.1<br />
5 Abwasserentsorgung Uetersen GmbH, DE, Uetersen<br />
35.0<br />
5 Abwassergesellschaft Bardowick mbH & Co. KG, DE,<br />
Bardowick<br />
49.0<br />
5 Abwassergesellschaft Bardowick Verwaltungs-GmbH, DE,<br />
Bardowick<br />
49.0<br />
5 Abwassergesellschaft Ilmenau mbH, DE, Melbeck<br />
49.0<br />
5 Abwasserwirtschaft Fichtelberg GmbH, DE, Fichtelberg<br />
49.0<br />
5 Abwasserwirtschaft Kunstadt GmbH, DE, Burgkunstadt<br />
25.0<br />
5 Adria LNG d.o.o. za izradu studija, HR, Zagreb<br />
30.0<br />
5 Aerodis, S.A., FR, Rueil-Malmaison<br />
39.2<br />
1 Åliden Vind AB, SE, Malmö<br />
100.0<br />
2 AMGA – Azienda Multiservizi S.p.A., IT, Udine<br />
100.0<br />
4 Amrumbank-West GmbH, DE, Munich<br />
20.2<br />
1, 8 Anacacho Wind Farm, LLC, US, Wilmington<br />
100.0<br />
1 Name, location Stake (%)<br />
ANCO Sp. z o.o., PL, Jarocin<br />
100.0<br />
2 100.0<br />
Aquila Power Investments Limited, GB, Coventry1 100.0<br />
Aquila Sterling Limited, GB, Coventry1 100.0<br />
Arena One GmbH, DE, Munich1 100.0<br />
AS EESTI GAAS, EE, Tallinn5 33.7<br />
AS Latvijās Gāze, LV, Riga4 47.2<br />
AV Packaging GmbH, DE, Munich7 0.0<br />
AVA Velsen GmbH, DE, Saarbrücken5 49.0<br />
Avon Energy Partners Holdings, GB, Coventry1 AWE-Arkona-Windpark Entwicklungs-GmbH, DE, Stralsund<br />
100.0<br />
2 AWP GmbH, DE, Paderborn<br />
98.0<br />
2 B.V. NEA, NL, Dodewaard<br />
100.0<br />
2 Bad Driburg-Solar GmbH & Co. KG, DE, Bad Driburg<br />
25.0<br />
5 Bad Driburg-Solar-Verwaltungsgesellschaft mbH, DE,<br />
Bad Driburg<br />
48.9<br />
5 Badlantic Betriebsgesellschaft mbH, DE, Ahrensburg<br />
49.0<br />
5 Barras Eléctricas Galaico-Asturianas, S.A., ES, Lugo<br />
49.0<br />
1 Barras Eléctricas Generación, S.L., ES, Lugo<br />
54.9<br />
1 BauMineral GmbH, DE, Herten<br />
55.0<br />
1, 8 Bayernwerk AG, DE, Munich<br />
100.0<br />
2 BBL Company V.O.F., NL, Groningen<br />
100.0<br />
4 Bergeforsens Kraftaktiebolag, SE, Bispgården<br />
20.0<br />
4 40.0<br />
Beteiligungsgesellschaft der Energieversorgungsunternehmen<br />
an der Kerntechnische Hilfsdienst GmbH<br />
GbR, DE, Karlsruhe5 Beteiligungsgesellschaft e.disnatur mbH, DE, Potsdam<br />
44.0<br />
2 BEW Bayreuther Energie- und Wasserversorgungs-GmbH,<br />
DE, Bayreuth<br />
100.0<br />
4 BHL Biomasse Heizanlage Lichtenfels GmbH, DE,<br />
Lichtenfels<br />
24.9<br />
5 BHO Biomasse Heizanlage Obernsees GmbH, DE, Hollfeld<br />
25.1<br />
5 BHP Biomasse Heizwerk Pegnitz GmbH, DE, Pegnitz<br />
40.7<br />
5 Bietergemeinschaft Tönsmeier MVA BI-HF, DE,<br />
Porta Westfalica<br />
46.5<br />
5 Bio Flow AB OY, FI, Helsingfors<br />
50.0<br />
5 Bioenergie Bad Füssing GmbH & Co. KG, DE, Bad Füssing<br />
49.0<br />
5 Bioenergie Bad Füssing Verwaltungs-GmbH, DE,<br />
Bad Füssing<br />
25.0<br />
5 Bioenergie Merzig GmbH, DE, Merzig<br />
25.0<br />
2 Bioerdgas Hallertau GmbH, DE, Wolnzach<br />
51.0<br />
2 Bioerdgas Schwandorf GmbH, DE, Schwandorf<br />
64.9<br />
2 Biogas Ducherow GmbH, DE, Ducherow<br />
100.0<br />
2 Biogas Roggenhagen GmbH, DE, Potsdam<br />
80.0<br />
2 Biogas Steyerberg GmbH, DE, Steyerberg<br />
60.0<br />
2 Bioheizwerk Rötz GmbH, DE, Rötz<br />
100.0<br />
5 BioMass Nederland b.v., NL, Maasvlakte<br />
25.0<br />
1 Disclosures Pursuant to Section 313 (2) HGB of Companies in Which Equity<br />
Investments Are Held (as of December 31, <strong>2011</strong>)<br />
100.0<br />
1 Consolidated affiliated <strong>com</strong>pany. 2 Non-consolidated affiliated <strong>com</strong>pany for reasons of immateriality. 3 Joint venture pursuant to IAS 31 (valued using the equity method).<br />
4 Associated <strong>com</strong>pany (valued using the equity method). 5 Associated <strong>com</strong>pany (valued at cost for reasons of immateriality). 6 Other <strong>com</strong>panies in which share investments<br />
are held. 7 Included as consolidated associated <strong>com</strong>pany pursuant to SIC-12. 8 This <strong>com</strong>pany exercised its exemption option under Section 264, Paragraph 3 of the German<br />
Commercial Code or under Section 264b of the German Commercial Code. 9 IFRS figures. 10 Short fiscal year October 1, 2010 – September 30, <strong>2011</strong>.<br />
159
160 Notes<br />
Name, location Stake (%)<br />
Biomasseheizkraftwerk Emden GmbH, DE, Emden2 70.0<br />
Biomasseheizkraftwerk Landesbergen GmbH, DE,<br />
Landesbergen5 50.0<br />
Bioplyn Cetín, s.r.o., SK, Bratislava2 71.5<br />
Bioplyn Hont, s.r.o., SK, Bratislava2 89.1<br />
Bioplyn Horovce, s.r.o., SK, Bratislava2 95.5<br />
Bioplyn Ladzany, s.r.o., SK, Bratislava2 BIOPLYN Trebon spol. s r.o., CZ, Třeboň<br />
98.3<br />
5 Bio-Wärme Gräfelfing GmbH, DE, Gräfelfing<br />
24.7<br />
5 Biowärme Surheim GmbH, DE, Regensburg<br />
40.0<br />
2 Björn Kraft Oy, FI, Kotka<br />
100.0<br />
1 BKW Biokraftwerke Fürstenwalde GmbH, DE,<br />
Fürstenwalde/Spree<br />
100.0<br />
5 48.8<br />
Blåsjön Kraft AB, SE, Arbrå4 Blomberger Versorgungsbetriebe GmbH/E.ON Westfalen<br />
Weser AG-GbR, DE, Blomberg<br />
50.0<br />
5 50.0<br />
Brännälven Kraft AB, SE, Arbrå4 19.1<br />
Brattmyrliden Vind AB, SE, Malmö2 100.0<br />
Breitbandnetz GmbH & Co. KG, DE, Breklum5 25.1<br />
BTB Bayreuther Thermalbad GmbH, DE, Bayreuth5 Bursjöliden Vind AB, SE, Malmö<br />
33.3<br />
2 Bützower Wärme GmbH, DE, Bützow<br />
100.0<br />
5 caplog-x GmbH, DE, Leipzig<br />
20.0<br />
5 Carbiogas b.v., NL, Nuenen<br />
25.0<br />
5 CART Partecipazioni S.r.l., IT, Orio al Serio (BG)<br />
33.3<br />
2 CEC Energieconsulting GmbH, DE, Kirchlengern<br />
100.0<br />
2 Centrale Solare di Fiumesanto S.r.l., IT, Sassari<br />
62.5<br />
1 Centrale Solare di Santa Domenica S.r.l. in liquidazione,<br />
IT, Scandale<br />
100.0<br />
2 100.0<br />
Centro Energia Ferrara S.p.A, IT, Rome4 58.4<br />
Centro Energia Teverola S.p.A, IT, Rome4 58.4<br />
Champion WF Holdco, LLC, US, Wilmington1 100.0<br />
Champion Wind Farm, LLC, US, Wilmington1 CHN Contractors Limited, GB, Coventry<br />
100.0<br />
1 CHN Electrical Services Limited, GB, Coventry<br />
100.0<br />
1 CHN Group Ltd, GB, Coventry<br />
100.0<br />
1 CHN Special Projects Limited, GB, Coventry<br />
100.0<br />
1 Citigen (London) Limited, GB, Coventry<br />
100.0<br />
1 Colonia-Cluj-Napoca-Energie S.R.L., RO, Cluj<br />
100.0<br />
5 COMPAÑÍA EÓLICA ARAGONESA, S.A., ES, Zaragoza<br />
33.3<br />
4 Cordova Wind Farm, LLC, US, Wilmington<br />
50.0<br />
2 Cottam Development Centre Limited, GB, Coventry<br />
100.0<br />
1 Croplin d.o.o., HR, Zagreb<br />
100.0<br />
5 Csornai Kogenerációs Erőmű Kft., HU, Győr<br />
50.0<br />
5 CT Services Holdings Limited, GB, Coventry<br />
50.0<br />
1 Dampfversorgung Ostsee-Molkerei GmbH, DE, Wismar<br />
100.0<br />
5 Debreceni Kombinált Ciklusú Erőmű Kft., HU, Debrecen<br />
50.0<br />
1 Del<strong>com</strong>m Limited, GB, Coventry<br />
100.0<br />
1 Name, location Stake (%)<br />
DEUDAN-Deutsch/Dänische Erdgastransportgesellschaft<br />
mbH & Co. Kommanditgesellschaft, DE, Handewitt<br />
100.0<br />
5 25.0<br />
DEUDAN-HOLDING-GmbH, DE, Hanover5 49.0<br />
Deutsche Flüssigerdgas Terminal oHG, DE, Essen2 90.0<br />
Deutsche Gesellschaft für Wiederaufarbeitung von Kernbrennstoffen<br />
AG & Co. oHG, DE, Gorleben5 42.5<br />
DFTG—Deutsche Flüssigerdgas Terminal Gesellschaft mit<br />
beschränkter Haftung, DE, Wilhelmshaven2 Diamond Power Generation Limited, GB, Coventry<br />
90.0<br />
1 Distribuidora de Gas Cuyana S.A., AR, Mendoza<br />
100.0<br />
2 Distribuidora de Gas del Centro S.A., AR, Córdoba<br />
53.2<br />
1 Donaukraftwerk Jochenstein AG, DE, Passau<br />
58.7<br />
4 Donau-Wasserkraft Aktiengesellschaft, DE, Munich<br />
50.0<br />
1 100.0<br />
DOTI Deutsche-Offshore-Testfeld- und Infrastruktur-<br />
GmbH & Co. KG, DE, Oldenburg4 DOTI Management GmbH, DE, Oldenburg<br />
26.0<br />
5 26.0<br />
DOTTO MORCONE S.R.L., IT, Milan2 100.0<br />
Drachenfelssee 869. V V GmbH, DE, Bonn5 50.0<br />
Drachenfelssee 876. V V GmbH, DE, Bonn5 50.0<br />
Dunaújvárosi Szennyviztisztitó Szolgáltató Kft., HU,<br />
Dunaújváros5 Dutchdelta Finance SARL, LU, Luxemburg<br />
49.0<br />
1 E-Bio Kyjov s.r.o., CZ, Otrokovice<br />
100.0<br />
5 E WIE EINFACH Strom & Gas GmbH, DE, Cologne<br />
24.5<br />
1, 8 e.dialog GmbH, DE, Potsdam<br />
100.0<br />
2 e.dis<strong>com</strong> Telekommunikation GmbH, DE, Rostock<br />
100.0<br />
2 e.disnatur Erneuerbare Energien GmbH, DE, Potsdam<br />
100.0<br />
1 e.distherm Wärmedienstleistungen GmbH, DE, Potsdam<br />
100.0<br />
1 e.inkasso GmbH, DE, Potsdam<br />
100.0<br />
2 100.0<br />
E.ON Achtzehnte Verwaltungs GmbH, DE, Düsseldorf2 100.0<br />
E.ON Anlagenservice GmbH, DE, Gelsenkirchen1, 8 100.0<br />
E.ON Argentina S.A., AR, Buenos Aires1 100.0<br />
E.ON Asset Management GmbH & Co. EEA KG, DE,<br />
Grünwald1, 8 E.ON Austria GmbH, AT, Vienna<br />
100.0<br />
1 E.ON Avacon AG, DE, Helmstedt<br />
75.1<br />
1 E.ON Avacon Vertrieb GmbH, DE, Helmstedt<br />
68.7<br />
1 E.ON Avacon Wärme GmbH, DE, Sarstedt<br />
100.0<br />
1 E.ON Bayern AG, DE, Regensburg<br />
100.0<br />
1, 8 E.ON Bayern Vertrieb GmbH, DE, Regensburg<br />
100.0<br />
1, 8 E.ON Bayern Verwaltungs AG, DE, Munich<br />
100.0<br />
2 E.ON Bayern Wärme 1. Beteiligungs-GmbH, DE, Regensburg<br />
100.0<br />
2 E.ON Bayern Wärme GmbH, DE, Munich<br />
100.0<br />
1 E.ON Belgium N.V., BE, Brussels<br />
100.0<br />
1 E.ON Benelux CCS Project B.V., NL, Rotterdam<br />
100.0<br />
2 E.ON Benelux Holding b.v., NL, Rotterdam<br />
100.0<br />
1 E.ON Benelux Levering b.v., NL, Eindhoven/Noord-Brabant<br />
100.0<br />
1 E.ON Benelux N.V., NL, Rotterdam<br />
100.0<br />
1 E.ON Best Service GmbH, DE, Hamburg<br />
100.0<br />
1 Disclosures Pursuant to Section 313 (2) HGB of Companies in Which Equity<br />
Investments Are Held (as of December 31, <strong>2011</strong>)<br />
100.0<br />
1 Consolidated affiliated <strong>com</strong>pany. 2 Non-consolidated affiliated <strong>com</strong>pany for reasons of immateriality. 3 Joint venture pursuant to IAS 31 (valued using the equity method).<br />
4 Associated <strong>com</strong>pany (valued using the equity method). 5 Associated <strong>com</strong>pany (valued at cost for reasons of immateriality). 6 Other <strong>com</strong>panies in which share investments<br />
are held. 7 Included as consolidated associated <strong>com</strong>pany pursuant to SIC-12. 8 This <strong>com</strong>pany exercised its exemption option under Section 264, Paragraph 3 of the German<br />
Commercial Code or under Section 264b of the German Commercial Code. 9 IFRS figures. 10 Short fiscal year October 1, 2010 – September 30, <strong>2011</strong>.
CEO Letter<br />
E.ON Stock<br />
Combined Group Management <strong>Report</strong><br />
Consolidated Financial Statements<br />
Corporate Governance <strong>Report</strong><br />
Supervisory Board and Board of Management<br />
Tables and Explanations<br />
Name, location Stake (%)<br />
E.ON Beteiligungsverwaltungs GmbH, DE, Düsseldorf1, 8 100.0<br />
E.ON Bioerdgas GmbH, DE, Essen1, 8 100.0<br />
E.ON Biofor Sverige AB, SE, Malmö1 E.ON Biogas Sverige AB, SE, Malmö<br />
100.0<br />
1 E.ON Brasil Energia LTDA., BR, City of São Paulo, State of<br />
São Paulo<br />
100.0<br />
1 100.0<br />
E.ON Bulgaria EAD, BG, Sofia1 100.0<br />
E.ON Bulgaria Energy Services EOOD, BG, Varna2 100.0<br />
E.ON Bulgaria Grid AD, BG, Varna1 67.0<br />
E.ON Bulgaria Sales AD, BG, Varna1 67.0<br />
E.ON Carbon Sourcing GmbH, DE, Düsseldorf1, 8 100.0<br />
E.ON Carbon Sourcing North America LLC, US, Wilmington2 100.0<br />
E.ON Castilla La Mancha, S.L., ES, Albacete2 E.ON Casting Renovables, S.L., ES, Teruel<br />
100.0<br />
2 E.ON Česká republika, s.r.o., CZ, České Budějovice<br />
50.0<br />
1 E.ON Climate & Renewables Canada Ltd., CA, Saint John<br />
100.0<br />
2 E.ON Climate & Renewables Carbon Sourcing Limited,<br />
GB, Coventry<br />
100.0<br />
2 100.0<br />
E.ON Climate & Renewables Carbon Sourcing Pte Ltd, SG,<br />
Singapore2 100.0<br />
E.ON Climate & Renewables Central Europe GmbH, DE,<br />
Munich1, 8 100.0<br />
E.ON Climate & Renewables France Solar S.A.S., FR,<br />
La Ciotat1 E.ON Climate & Renewables GmbH, DE, Düsseldorf<br />
100.0<br />
1, 8 E.ON Climate & Renewables Italia S.r.l., IT, Milan<br />
100.0<br />
1 E.ON Climate & Renewables Italia Solar S.r.l., IT, Milan<br />
100.0<br />
1 100.0<br />
E.ON Climate & Renewables North America LLC, US,<br />
Wilmington1 100.0<br />
E.ON Climate & Renewables UK Biomass Limited, GB,<br />
Coventry1 100.0<br />
E.ON Climate & Renewables UK Blyth Limited, GB, Coventry1 100.0<br />
E.ON Climate & Renewables UK Developments Limited,<br />
GB, Coventry1 100.0<br />
E.ON Climate & Renewables UK Humber Wind Limited,<br />
GB, Coventry1 E.ON Climate & Renewables UK Limited, GB, Coventry<br />
100.0<br />
1 E.ON Climate & Renewables UK London Array Limited,<br />
GB, Coventry<br />
100.0<br />
1 E.ON Climate & Renewables UK Offshore Wind Limited,<br />
GB, Coventry<br />
100.0<br />
1 100.0<br />
E.ON Climate & Renewables UK Operations Limited, GB,<br />
Coventry1 100.0<br />
E.ON Climate & Renewables UK Rampion Offshore Wind<br />
Limited, GB, Coventry1 100.0<br />
E.ON Climate & Renewables UK Robin Rigg East Limited,<br />
GB, Coventry1 E.ON Climate & Renewables UK Robin Rigg West Limited,<br />
GB, Coventry<br />
100.0<br />
1 E.ON Climate & Renewables UK Wind Limited, GB, Coventry<br />
100.0<br />
1 Name, location Stake (%)<br />
E.ON Climate & Renewables UK Zone Six Limited, GB,<br />
Coventry<br />
100.0<br />
1 100.0<br />
E.ON Comercializadora de Último Recurso S.L., ES,<br />
Santander1 E.ON Czech Holding AG, DE, Munich<br />
100.0<br />
1, 8 E.ON Czech Holding Verwaltungs-GmbH, DE, Munich<br />
100.0<br />
1, 8 100.0<br />
E.ON Danmark A/S, DK, Herlev1 100.0<br />
E.ON Dél-dunántúli Áramhálózati Zrt., HU, Pécs1 100.0<br />
E.ON Dél-dunántúli Gázhálózati Zrt., HU, Pécs1 100.0<br />
E.ON Direkt GmbH, DE, Essen1, 8 100.0<br />
E.ON Distribuce, a.s., CZ, České Budějovice1 100.0<br />
E.ON Distribución, S.L., ES, Santander1 100.0<br />
E.ON Dreiundzwanzigste Verwaltungs GmbH, DE,<br />
Düsseldorf2 E.ON edis AG, DE, Fürstenwalde/Spree<br />
100.0<br />
1 E.ON edis Contracting GmbH, DE, Fürstenwalde/Spree<br />
71.5<br />
2 E.ON edis energia Sp. z o.o., PL, Warsaw<br />
100.0<br />
1 E.ON edis Vertrieb GmbH, DE, Fürstenwalde/Spree<br />
100.0<br />
1 100.0<br />
E.ON Elektrárne s.r.o., SK, Tracovice1 100.0<br />
E.ON Elnät Stockholm AB, SE, Malmö1 100.0<br />
E.ON Elnät Sverige AB, SE, Malmö1 100.0<br />
E.ON Energia S.p.A., IT, Verona1 100.0<br />
E.ON Energía, S.L., ES, Santander1 E.ON Energiaszolgáltató Kft., HU, Budapest<br />
100.0<br />
1 E.ON Energiatermelő Kft., HU, Debrecen<br />
100.0<br />
1 E.ON Energie 25. Beteiligungsgesellschaft mbH München,<br />
DE, Munich<br />
100.0<br />
1, 8 100.0<br />
E.ON Energie 27. Beteiligungsgesellschaft mbH München,<br />
DE, Munich2 100.0<br />
E.ON Energie 31. Beteiligungsgesellschaft mbH München,<br />
DE, Munich2 100.0<br />
E.ON Energie 33. Beteiligungsgesellschaft mbH München,<br />
DE, Munich2 100.0<br />
E.ON Energie 37. Beteiligungs-GmbH, DE, Munich2 100.0<br />
E.ON Energie 38. Beteiligungs-GmbH, DE, Munich2 E.ON Energie 39. Beteiligungs-GmbH, DE, Munich<br />
100.0<br />
2 E.ON Energie AG, DE, Munich<br />
100.0<br />
1, 8 E.ON Energie Odnawialne Sp. z o.o., PL, Szczecin<br />
100.0<br />
1 E.ON Energie Real Estate Investment GmbH, DE, Munich<br />
100.0<br />
2 E.ON Energie România S.A., RO, Târgu Mureş<br />
100.0<br />
1 51.0<br />
E.ON Energie S.A.S., FR, Paris1 100.0<br />
E.ON Energie, a.s., CZ, České Budějovice1 100.0<br />
E.ON Énergies Renouvelables S.A.S., FR, Paris1 100.0<br />
E.ON Energihandel Nordic AB, SE, Malmö1 100.0<br />
E.ON Energy from Waste AG, DE, Helmstedt1, 8 E.ON Energy from Waste Delfzijl B.V., NL, Farmsum<br />
100.0<br />
1 E.ON Energy from Waste Göppingen GmbH, DE, Göppingen<br />
100.0<br />
1, 8 E.ON Energy from Waste Großräschen GmbH, DE,<br />
Großräschen<br />
100.0<br />
1, 8 100.0<br />
E.ON Energy from Waste Hannover GmbH, DE, Hanover1 Disclosures Pursuant to Section 313 (2) HGB of Companies in Which Equity<br />
Investments Are Held (as of December 31, <strong>2011</strong>)<br />
85.0<br />
1 Consolidated affiliated <strong>com</strong>pany. 2 Non-consolidated affiliated <strong>com</strong>pany for reasons of immateriality. 3 Joint venture pursuant to IAS 31 (valued using the equity method).<br />
4 Associated <strong>com</strong>pany (valued using the equity method). 5 Associated <strong>com</strong>pany (valued at cost for reasons of immateriality). 6 Other <strong>com</strong>panies in which share investments<br />
are held. 7 Included as consolidated associated <strong>com</strong>pany pursuant to SIC-12. 8 This <strong>com</strong>pany exercised its exemption option under Section 264, Paragraph 3 of the German<br />
Commercial Code or under Section 264b of the German Commercial Code. 9 IFRS figures. 10 Short fiscal year October 1, 2010 – September 30, <strong>2011</strong>.<br />
161
162 Notes<br />
Name, location Stake (%)<br />
E.ON Energy from Waste Helmstedt GmbH, DE, Helmstedt1, 8 100.0<br />
E.ON Energy from Waste Heringen GmbH, DE, Heringen1, 8 100.0<br />
E.ON Energy from Waste Leudelange SARL, LU, Leudelange1 100.0<br />
E.ON Energy from Waste Polska Sp. z o.o., PL, Warsaw2 100.0<br />
E.ON Energy from Waste Premnitz GmbH, DE, Premnitz1, 8 100.0<br />
E.ON Energy from Waste Saarbrücken GmbH, DE,<br />
Saarbrücken1, 8 100.0<br />
E.ON Energy from Waste Stapelfeld GmbH, DE, Stapelfeld1 100.0<br />
E.ON Energy From Waste UK Limited, GB, Coventry—West<br />
Midlands2 100.0<br />
E.ON Energy Gas (Eastern) Limited, GB, Coventry1 100.0<br />
E.ON Energy Gas (Northwest) Limited, GB, Coventry2 100.0<br />
E.ON Energy Projects GmbH, DE, Munich1, 8 100.0<br />
E.ON Energy Sales GmbH, DE, Essen1, 8 100.0<br />
E.ON Energy Solutions Limited, GB, Coventry1 100.0<br />
E.ON Energy Trading Bulgarien EOOD, BG, Sofia2 100.0<br />
E.ON Energy Trading Holding GmbH, DE, Düsseldorf1, 8 100.0<br />
E.ON Energy Trading NL Staff Company 2 B.V., NL, Voorburg1 100.0<br />
E.ON Energy Trading NL Staff Company B.V., NL, Rotterdam1 100.0<br />
E.ON Energy Trading S.p.A., IT, Milan1 100.0<br />
E.ON Energy Trading SE, DE, Düsseldorf1, 8 100.0<br />
E.ON Energy Trading Srbija d.o.o., RS, Belgrade1 100.0<br />
E.ON Energy Trading UK Staff Company Limited, GB,<br />
Coventry1 E.ON Energy UK Limited, GB, Coventry<br />
100.0<br />
2 E.ON Engineering Corporation, US, Groveport, Ohio<br />
100.0<br />
2 E.ON Erőművek Termelő és Üzemeltetö Kft., HU, Budapest<br />
100.0<br />
1 E.ON España, S.L., ES, Madrid<br />
100.0<br />
1 E.ON Észak-dunántúli Áramhálózati Zrt., HU, Győr<br />
100.0<br />
1 E.ON Europa Power and Fuel S.r.l in liquidazione, IT, Terni<br />
100.0<br />
1 E.ON Europa, S.L., ES, Madrid<br />
100.0<br />
1 E.ON Facility Management GmbH, DE, Munich<br />
100.0<br />
1, 8 E.ON Fastigheter Sverige AB, SE, Malmö<br />
100.0<br />
1 E.ON Fernwärme GmbH, DE, Gelsenkirchen<br />
100.0<br />
1, 8 E.ON Finanzanlagen GmbH, DE, Düsseldorf<br />
100.0<br />
1, 8 E.ON First Future Energy Holding B.V., NL, Rotterdam<br />
100.0<br />
1 E.ON Földgáz Storage Zrt., HU, Budapest<br />
100.0<br />
1 E.ON Földgáz Trade Zrt., HU, Budapest<br />
100.0<br />
1 E.ON Försäkring Sverige AB, SE, Malmö<br />
100.0<br />
1 E.ON Försäljning Sverige AB, SE, Malmö<br />
100.0<br />
1 E.ON France Management S.A.S., FR, Paris<br />
100.0<br />
2 E.ON France S.A.S., FR, Paris<br />
100.0<br />
1 E.ON Gas & Power S.R.L., RO, Bucharest<br />
100.0<br />
2 E.ON Gas Grid GmbH, DE, Essen<br />
100.0<br />
1, 8 E.ON Gas Mobil GmbH, DE, Essen<br />
100.0<br />
2 100.0<br />
E.ON Gas Storage GmbH, DE, Essen1, 8 100.0<br />
E.ON Gas Storage UK Limited, GB, Coventry1 100.0<br />
E.ON Gas Sverige AB, SE, Malmö1 100.0<br />
E.ON Gashandel Sverige AB, SE, Malmö1 Name, location Stake (%)<br />
E.ON Gasification Development AB, SE, Malmö<br />
100.0<br />
1 100.0<br />
E.ON Gaz Distributie S.A., RO, Târgu Mureş1 51.0<br />
E.ON Gazdasági Szolgáltató Kft., HU, Győr1 100.0<br />
E.ON Generación, S.L., ES, Santander1 100.0<br />
E.ON Generation Belgium N.V., BE, Vilvoorde1 100.0<br />
E.ON Generation GmbH, DE, Hanover1, 8 100.0<br />
E.ON Gruga Geschäftsführungsgesellschaft mbH, DE,<br />
Düsseldorf2 100.0<br />
E.ON Gruga Objektgesellschaft mbH & Co. KG, DE, Düsseldorf1 100.0<br />
E.ON Hálózati Szolgáltató Kft., HU, Pécs1 100.0<br />
E.ON Hanse AG, DE, Quickborn1 73.8<br />
E.ON Hanse Vertrieb GmbH, DE, Hamburg1 100.0<br />
E.ON Hanse Wärme GmbH, DE, Hamburg1 100.0<br />
E.ON Human Resources International GmbH, DE, Munich1, 8 100.0<br />
E.ON Hungária Zrt., HU, Budapest1 100.0<br />
E.ON Iberia Holding GmbH, DE, Düsseldorf1, 8 100.0<br />
E.ON Iberia Services, S.L., ES, Málaga1 100.0<br />
E.ON Inhouse Consulting GmbH, DE, Munich2, 8 100.0<br />
E.ON INTERNATIONAL FINANCE B.V., NL, Rotterdam1 100.0<br />
E.ON Invest GmbH, DE, Grünwald, Landkreis Munich2 100.0<br />
E.ON IT Bulgaria EOOD, BG, Sofia2 100.0<br />
E.ON IT Czech Republic s.r.o., CZ, České Budějovice2 100.0<br />
E.ON IT GmbH, DE, Hanover1, 8 E.ON IT Hungary Kft., HU, Budapest<br />
100.0<br />
2 E.ON IT Italia S.r.l., IT, Milan<br />
100.0<br />
2 E.ON IT Netherlands B.V., NL, Rotterdam<br />
100.0<br />
2 E.ON IT Romania S.R.L, RO, Iasi<br />
100.0<br />
2 E.ON IT Slovakia s.r.o., SK, Bratislava<br />
100.0<br />
2 E.ON IT Sverige AB, SE, Malmö<br />
51.0<br />
2 E.ON IT UK Limited, GB, Coventry<br />
100.0<br />
1 E.ON Italia Power & Fuel S.r.l., IT, Terni<br />
100.0<br />
1 E.ON Italia S.p.A., IT, Milan<br />
100.0<br />
1 E.ON JobCenter Sverige AB, SE, Malmö<br />
100.0<br />
1 E.ON Kainuu Oy, FI, Kajaani<br />
100.0<br />
1 E.ON Kärnkraft Finland AB, FI, Kajaani<br />
50.6<br />
1 E.ON Kärnkraft Sverige AB, SE, Malmö<br />
100.0<br />
1 E.ON Kernkraft GmbH, DE, Hanover<br />
100.0<br />
1, 8 E.ON Közép-dunántúli Gázhálózati Zrt., HU, Nagykanizsa<br />
100.0<br />
1 E.ON Kraftwerke 6. Beteiligungs-GmbH, DE, Hanover<br />
99.8<br />
2 E.ON Kraftwerke GmbH, DE, Hanover<br />
100.0<br />
1, 8 E.ON Kundsupport Sverige AB, SE, Malmö<br />
100.0<br />
1 E.ON Limited, GB, Coventry<br />
100.0<br />
1 E.ON Mälarkraft Värme AB, SE, Håbo<br />
100.0<br />
1 E.ON Masdar Integrated Carbon LLC, AE, Kalif A City,<br />
Abu Dhabi<br />
99.8<br />
5 50.0<br />
E.ON Metering GmbH, DE, Munich2 100.0<br />
E.ON Mitte AG, DE, Kassel1 73.3<br />
E.ON Mitte Natur GmbH, DE, Dillenburg1 Disclosures Pursuant to Section 313 (2) HGB of Companies in Which Equity<br />
Investments Are Held (as of December 31, <strong>2011</strong>)<br />
100.0<br />
1 Consolidated affiliated <strong>com</strong>pany. 2 Non-consolidated affiliated <strong>com</strong>pany for reasons of immateriality. 3 Joint venture pursuant to IAS 31 (valued using the equity method).<br />
4 Associated <strong>com</strong>pany (valued using the equity method). 5 Associated <strong>com</strong>pany (valued at cost for reasons of immateriality). 6 Other <strong>com</strong>panies in which share investments<br />
are held. 7 Included as consolidated associated <strong>com</strong>pany pursuant to SIC-12. 8 This <strong>com</strong>pany exercised its exemption option under Section 264, Paragraph 3 of the German<br />
Commercial Code or under Section 264b of the German Commercial Code. 9 IFRS figures. 10 Short fiscal year October 1, 2010 – September 30, <strong>2011</strong>.
CEO Letter<br />
E.ON Stock<br />
Combined Group Management <strong>Report</strong><br />
Consolidated Financial Statements<br />
Corporate Governance <strong>Report</strong><br />
Supervisory Board and Board of Management<br />
Tables and Explanations<br />
Name, location Stake (%)<br />
E.ON Mitte Vertrieb GmbH, DE, Kassel1 100.0<br />
E.ON Mitte Wärme GmbH, DE, Kassel1 100.0<br />
E.ON Moldova Distributie S.A., RO, Iasi1 51.0<br />
E.ON NA Capital LLC, US, Wilmington1 100.0<br />
E.ON NA Investments LLC, US, Wilmington1 100.0<br />
E.ON Netz GmbH, DE, Bayreuth1, 8 100.0<br />
E.ON Neunzehnte Verwaltungs GmbH, DE, Düsseldorf2, 8 100.0<br />
E.ON New Build & Technology B.V., NL, Rotterdam2 100.0<br />
E.ON New Build & Technology BVBA, BE, Vilvoorde2 100.0<br />
E.ON New Build & Technology GmbH, DE, Gelsenkirchen1, 8 100.0<br />
E.ON New Build & Technology Limited, GB, Coventry1 100.0<br />
E.ON Nord Sverige AB, SE, Malmö1 100.0<br />
E.ON Nordic AB, SE, Malmö1 100.0<br />
E.ON North America, Inc., US, Wilmington1 100.0<br />
E.ON Polska Sp. z o.o., PL, Warsaw1 100.0<br />
E.ON Portfolio Solution GmbH, DE, Düsseldorf1 100.0<br />
E.ON Power Plants Belgium BVBA, BE, Antwerp2 100.0<br />
E.ON Produktion Danmark A/S, DK, Herlev1 E.ON Produzione Centrale Livorno Ferraris S.p.A., IT, Milan<br />
100.0<br />
1 E.ON Produzione S.p.A., IT, Sassari<br />
75.0<br />
1 E.ON Provence Biomasse SARL, FR, Nanterre<br />
100.0<br />
2 E.ON RAG Beteiligungsgesellschaft mbH, DE, Düsseldorf<br />
100.0<br />
1 E.ON Red S.L., ES, Santander<br />
100.0<br />
1 E.ON Regenerabile Romania S.R.L, RO, Iasi<br />
100.0<br />
2 E.ON Renovables, S.L., ES, Madrid<br />
100.0<br />
1 E.ON Renovaveis Portugal, SGPS S.A., PT, Lisbon<br />
100.0<br />
1 E.ON Retail Limited, GB, Coventry<br />
100.0<br />
1 E.ON Risk Consulting GmbH, DE, Düsseldorf<br />
100.0<br />
1 E.ON România S.R.L., RO, Târgu Mureş<br />
100.0<br />
1 E.ON Ruhrgas AG, DE, Essen<br />
90.2<br />
1, 8 E.ON Ruhrgas Austria GmbH, AT, Vienna<br />
100.0<br />
1 100.0<br />
E.ON Ruhrgas BBL B.V., NL, Voorburg1 100.0<br />
E.ON Ruhrgas Dogalgaz A.S., TR, Istanbul2 100.0<br />
E.ON Ruhrgas Dutch Holding B.V., NL, Den Haag2 100.0<br />
E.ON Ruhrgas E & P Ägypten GmbH, DE, Essen1, 8 100.0<br />
E.ON Ruhrgas E & P Algerien GmbH, DE, Essen1, 8 100.0<br />
E.ON Ruhrgas E & P GmbH, DE, Essen1, 8 100.0<br />
E.ON Ruhrgas GGH GmbH, DE, Essen2 100.0<br />
E.ON Ruhrgas GPA GmbH, DE, Essen1, 8 100.0<br />
E.ON Ruhrgas Holding GmbH, DE, Düsseldorf1, 8 100.0<br />
E.ON Ruhrgas International GmbH, DE, Essen1, 8 100.0<br />
E.ON Ruhrgas Nigeria Limited, NG, Abuja2 100.0<br />
E.ON Ruhrgas Norge AS, NO, Stavanger1 100.0<br />
E.ON Ruhrgas Personalagentur GmbH, DE, Essen2 100.0<br />
E.ON Ruhrgas Polska Sp. z o.o., PL, Warsaw2 100.0<br />
E.ON Ruhrgas UK E&P Limited, GB, London1 100.0<br />
E.ON Ruhrgas UK Energy Trading Limited, GB, London1 100.0<br />
E.ON Ruhrgas UK EU Limited, GB, London1 Name, location Stake (%)<br />
E.ON Ruhrgas UK North Sea Limited, GB, Aberdeen<br />
100.0<br />
1 100.0<br />
E.ON Russia Beteiligungs GmbH, DE, Düsseldorf2 100.0<br />
E.ON Russia Holding GmbH, DE, Düsseldorf1, 8 100.0<br />
E.ON Sechzehnte Verwaltungs GmbH, DE, Düsseldorf1, 8 100.0<br />
E.ON Service GmbH, DE, Essen2, 8 100.0<br />
E.ON Service Plus GmbH, DE, Landshut1 100.0<br />
E.ON Servicii S.R.L., RO, Târgu Mureş1 100.0<br />
E.ON Servicios, S.L., ES, Santander1 100.0<br />
E.ON Servisní, s.r.o., CZ, České Budějovice1 83.7<br />
E.ON Siebzehnte Verwaltungs GmbH, DE, Düsseldorf2 100.0<br />
E.ON Slovensko, a.s., SK, Bratislava1 100.0<br />
E.ON Smart Living AB, SE, Malmö2 100.0<br />
E.ON Suomi Oy, FI, Helsinki1 100.0<br />
E.ON Sverige AB, SE, Malmö1 100.0<br />
E.ON Thüringer Energie AG, DE, Erfurt1 53.0<br />
E.ON Thüringer Energie Dritte Vermögensverwaltungs-<br />
GmbH, DE, Erfurt2 100.0<br />
E.ON Thüringer Energie KomSolar Vermögensverwaltungs-GmbH,<br />
DE, Erfurt2 E.ON Thüringer Energie Zweite Vermögensverwaltungs-<br />
GmbH, DE, Erfurt<br />
100.0<br />
2 E.ON Tiszántúli Áramhálózati Zrt., HU, Debrecen<br />
100.0<br />
1 E.ON Trend s.r.o., CZ, České Budějovice<br />
100.0<br />
1 E.ON Ügyfélszolgálati Kft., HU, Budapest<br />
100.0<br />
1 E.ON UK CHP Limited, GB, Coventry<br />
100.0<br />
1 E.ON UK CoGeneration Limited, GB, Coventry<br />
100.0<br />
1 E.ON UK Community Solar Limited, GB, Coventry<br />
100.0<br />
2 E.ON UK Directors Limited, GB, Coventry<br />
100.0<br />
2 E.ON UK Energy Services Limited, GB, Coventry<br />
100.0<br />
1 E.ON UK Energy Solutions Limited, GB, Coventry<br />
100.0<br />
1 E.ON UK Finance Limited (in member’s voluntary liquidation),<br />
GB, Coventry<br />
100.0<br />
2 100.0<br />
E.ON UK Gas Limited, GB, Coventry1 100.0<br />
E.ON UK Holding Company Limited, GB, Coventry1 100.0<br />
E.ON UK Industrial Shipping Limited, GB, Coventry2 100.0<br />
E.ON UK Ironbridge Limited, GB, Coventry2 100.0<br />
E.ON UK Pension Trustees Limited, GB, Coventry2 100.0<br />
E.ON UK plc, GB, Coventry1 100.0<br />
E.ON UK Power Technology Limited, GB, Coventry1 100.0<br />
E.ON UK Property Services Limited, GB, Coventry1 100.0<br />
E.ON UK PS Limited, GB, Coventry1 100.0<br />
E.ON UK Retail Limited, GB, Coventry2 100.0<br />
E.ON UK Secretaries Limited, GB, Coventry2 100.0<br />
E.ON UK Technical Services Limited, GB, Edinburgh1 100.0<br />
E.ON UK Trading Limited (in member’s voluntary liquidation),<br />
GB, Coventry2 100.0<br />
E.ON UK Trustees Limited, GB, Coventry1 100.0<br />
E.ON US Corporation, US, Wilmington1 100.0<br />
E.ON US Holding GmbH, DE, Düsseldorf1, 8 Disclosures Pursuant to Section 313 (2) HGB of Companies in Which Equity<br />
Investments Are Held (as of December 31, <strong>2011</strong>)<br />
100.0<br />
1 Consolidated affiliated <strong>com</strong>pany. 2 Non-consolidated affiliated <strong>com</strong>pany for reasons of immateriality. 3 Joint venture pursuant to IAS 31 (valued using the equity method).<br />
4 Associated <strong>com</strong>pany (valued using the equity method). 5 Associated <strong>com</strong>pany (valued at cost for reasons of immateriality). 6 Other <strong>com</strong>panies in which share investments<br />
are held. 7 Included as consolidated associated <strong>com</strong>pany pursuant to SIC-12. 8 This <strong>com</strong>pany exercised its exemption option under Section 264, Paragraph 3 of the German<br />
Commercial Code or under Section 264b of the German Commercial Code. 9 IFRS figures. 10 Short fiscal year October 1, 2010 – September 30, <strong>2011</strong>.<br />
163
164 Notes<br />
Name, location Stake (%)<br />
E.ON US Investments Corp., US, Louisville1 100.0<br />
E.ON Varme Danmark ApS, DK, Herlev1 100.0<br />
E.ON Värme Sverige AB, SE, Malmö1 100.0<br />
E.ON Värme Timrå AB, SE, Sundsvall1 90.9<br />
E.ON Värmekraft Sverige AB, SE, Karlshamn1 100.0<br />
E.ON Vattenkraft Sverige AB, SE, Sundsvall1 100.0<br />
E.ON Vertrieb Deutschland GmbH, DE, Munich1 100.0<br />
E.ON Vierundzwanzigste Verwaltungs GmbH, DE, Düsseldorf2 100.0<br />
E.ON Vind Sverige AB, SE, Malmö1 100.0<br />
E.ON Wasserkraft GmbH, DE, Landshut1, 8 100.0<br />
E.ON Westfalen Weser 2. Vermögensverwaltungs-GmbH,<br />
DE, Herford2 100.0<br />
E.ON Westfalen Weser 3. Vermögensverwaltungs-UG<br />
(haftungsbeschränkt), DE, Hameln2 E.ON Westfalen Weser AG, DE, Paderborn<br />
100.0<br />
1 E.ON Westfalen Weser Energie-Service GmbH, DE,<br />
Kirchlengern<br />
62.8<br />
1 E.ON Westfalen Weser Vertrieb GmbH, DE, Paderborn<br />
100.0<br />
1 E.ON Zwanzigste Verwaltungs GmbH, DE, Düsseldorf<br />
100.0<br />
2 100.0<br />
E.ON Zweiundzwanzigste Verwaltungs GmbH, DE,<br />
Düsseldorf2, 8 100.0<br />
East Midlands Electricity Distribution Holdings, GB,<br />
Coventry1 East Midlands Electricity Distribution Limited, GB, Coventry<br />
100.0<br />
2 East Midlands Electricity Generation (Corby) Limited, GB,<br />
Coventry<br />
100.0<br />
1 East Midlands Electricity Limited, GB, Coventry<br />
100.0<br />
1 East Midlands Electricity Share Scheme Trustees Limited,<br />
GB, Coventry<br />
100.0<br />
2 100.0<br />
EAV 2. Beteiligungs-GmbH, DE, Helmstedt2 100.0<br />
EAV Beteiligungs-GmbH, DE, Helmstedt2 100.0<br />
EBG 1. Beteiligungsgesellschaft mbH, DE, Essen2 100.0<br />
EBS Kraftwerk GmbH, DE, Hürth5 50.0<br />
EBY Eigenbetriebe GmbH, DE, Regensburg1, 8 100.0<br />
EBY Gewerbeobjekt GmbH, DE, Regensburg2 100.0<br />
EBY Immobilien GmbH & Co. KG, DE, Regensburg2 EBY Port 3 GmbH, DE, Regensburg<br />
100.0<br />
1 EBY Port 5 GmbH, DE, Regensburg<br />
100.0<br />
2 EC Serwis Sp. z o.o., PL, Slupsk<br />
100.0<br />
1 EC Skarżysko-Kamienna Sp. z o.o., PL, Skarżysko Kamienna<br />
100.0<br />
2 EC&R Asset Management, LLC, US, Wilmington<br />
63.9<br />
1 EC&R Canada Ltd., CA, Saint John<br />
100.0<br />
2 EC&R Development, LLC, US, Wilmington<br />
100.0<br />
1 EC&R Energy Marketing, LLC, US, Wilmington<br />
100.0<br />
1 EC&R Investco Mgmt II, LLC, US, Wilmington<br />
100.0<br />
1 EC&R Investco Mgmt, LLC, US, Wilmington<br />
100.0<br />
1 100.0<br />
EC&R NA Solar PV, LLC, US, Wilmington2 100.0<br />
EC&R O&M, LLC, US, Wilmington1 100.0<br />
EC&R Panther Creek WF I&II Holdco, LLC, US, Wilmington1 Name, location Stake (%)<br />
EC&R Panther Creek WF III Holdco, LLC, US, Wilmington<br />
100.0<br />
1 100.0<br />
EC&R Panther Creek Wind Farm I&II, LLC, US, Wilmington1 100.0<br />
EC&R Panther Creek Wind Farm III, LLC, US, Wilmington1 100.0<br />
EC&R Papalote Creek I, LLC, US, Wilmington1 100.0<br />
EC&R Papalote Creek II, LLC, US, Wilmington1 100.0<br />
EC&R QSE, LLC, US, Wilmington1 100.0<br />
EC&R Services, LLC, US, Wilmington1 100.0<br />
EC&R Sherman, LLC, US, Wilmington2 100.0<br />
Economy Power Limited, GB, Coventry1 100.0<br />
E-Eko Malenovice s.r.o., CZ, Otrokovice5 24.5<br />
EEP 1. Beteiligungsgesellschaft mbH, DE, Munich2 100.0<br />
EFG Erdgas Forchheim GmbH, DE, Forchheim5 24.9<br />
EFM GmbH & Co. Beta KG, DE, Karlsfeld1, 8 EFR Europäische Funk-Rundsteuerung GmbH, DE, Munich<br />
100.0<br />
5 EFR-CEE Szolgáltató Kft., HU, Budapest<br />
39.9<br />
5 EGF EnergieGesellschaft Frankenberg mbH, DE,<br />
Frankenberg/Eder<br />
37.0<br />
2 EH-SZER Energetikai és Távközlési Hálózatépítő és<br />
Szerelő Kft., HU, Győr<br />
40.0<br />
1 100.0<br />
Eisenacher Versorgungs-Betriebe GmbH (EVB), DE,<br />
Eisenach4 25.1<br />
Ekopur d.o.o., SI, Ljubljana2 EKS-Service Kft., HU, Budapest<br />
100.0<br />
5 Elecdey ASCOY, S.A., ES, Murcia<br />
50.0<br />
5 Elecdey CARCELÉN, S.A., ES, Albacete<br />
19.5<br />
4 Elektrizitätswerk Schwandorf GmbH, DE, Schwandorf<br />
23.0<br />
2 Elevate Wind Holdco, LLC, US, Wilmington<br />
100.0<br />
2 ELICA S.R.L., IT, Naples<br />
100.0<br />
2 100.0<br />
Elmregia GmbH, DE, Schöningen5 49.0<br />
Elsö Magyar Szelerömü Kft, HU, Kulcs2 74.7<br />
Eltel Networks Pohjoinen Oy, FI, Kajaani4 25.0<br />
Elverket Vallentuna AB, SE, Vallentuna4 43.4<br />
EME Distribution No. 2 Limited, GB, Coventry1 100.0<br />
Empec Ustka Sp. z o.o., PL, Ustka4 48.5<br />
Empower Training Services Limited (member’s liquidation),<br />
GB, Coventry2 ENACO Energieanlagen- und Kommunikationstechnik<br />
GmbH, DE, Maisach, Landkreis Fürstenfeldbruck<br />
100.0<br />
5 ENAG/Maingas Energieanlagen GmbH, DE, Eisenach<br />
26.0<br />
5 Energest S.r.l., IT, Mira (VE)<br />
50.0<br />
2 Energetika Malenovice, a.s., CZ, Zlin-Malenovice<br />
100.0<br />
2 ENERGETIKA SERVIS s.r.o., CZ, České Budějovice<br />
100.0<br />
2 Energetyka Cieplna Opolszczyzny S.A., PL, Opole<br />
80.0<br />
5 Energías Renovables de Euskadi, S.L., ES, Bilbao<br />
45.7<br />
5 Energie- und Medienversorgung Schwarza GmbH (EMS),<br />
DE, Rudolstadt/Schwarza<br />
30.0<br />
1 100.0<br />
Energie und Wasser Potsdam GmbH, DE, Potsdam4 35.0<br />
Energie und Wasser Wahlstedt/Bad Segeberg GmbH &<br />
Co. KG (ews), DE, Bad Segeberg5 Disclosures Pursuant to Section 313 (2) HGB of Companies in Which Equity<br />
Investments Are Held (as of December 31, <strong>2011</strong>)<br />
50.1<br />
1 Consolidated affiliated <strong>com</strong>pany. 2 Non-consolidated affiliated <strong>com</strong>pany for reasons of immateriality. 3 Joint venture pursuant to IAS 31 (valued using the equity method).<br />
4 Associated <strong>com</strong>pany (valued using the equity method). 5 Associated <strong>com</strong>pany (valued at cost for reasons of immateriality). 6 Other <strong>com</strong>panies in which share investments<br />
are held. 7 Included as consolidated associated <strong>com</strong>pany pursuant to SIC-12. 8 This <strong>com</strong>pany exercised its exemption option under Section 264, Paragraph 3 of the German<br />
Commercial Code or under Section 264b of the German Commercial Code. 9 IFRS figures. 10 Short fiscal year October 1, 2010 – September 30, <strong>2011</strong>.
CEO Letter<br />
E.ON Stock<br />
Combined Group Management <strong>Report</strong><br />
Consolidated Financial Statements<br />
Corporate Governance <strong>Report</strong><br />
Supervisory Board and Board of Management<br />
Tables and Explanations<br />
Name, location Stake (%)<br />
Energie-Agentur Weyhe GmbH, DE, Weyhe5 50.0<br />
Energieerzeugungswerke Geesthacht GmbH, DE,<br />
Geesthacht5 33.4<br />
Energienetze Bayern GmbH, DE, Regensburg1 100.0<br />
Energienetze Schaafheim GmbH, DE, Regensburg2 100.0<br />
Energie Region Kassel GmbH & Co. KG, DE, Kassel2 100.0<br />
Energie Region Kassel Verwaltungs GmbH, DE, Kassel2 100.0<br />
Energieversorgung Alzenau GmbH (EVA), DE, Alzenau5 69.5<br />
Energieversorgung Apolda GmbH, DE, Apolda4 49.0<br />
Energieversorgung Buching-Trauchgau (EBT) Gesellschaft<br />
mit beschränkter Haftung, DE, Halblech5 50.0<br />
Energieversorgung Greiz GmbH, DE, Greiz4 49.0<br />
Energieversorgung Inselsberg GmbH, DE, Waltershausen5 20.0<br />
Energieversorgung Nordhausen GmbH, DE, Nordhausen4 40.0<br />
Energieversorgung Putzbrunn GmbH & Co. KG, DE,<br />
Putzbrunn5 50.0<br />
Energieversorgung Putzbrunn Verwaltungs GmbH, DE,<br />
Putzbrunn5 50.0<br />
Energieversorgung Rudolstadt GmbH, DE, Rudolstadt5 23.9<br />
Energieversorgung Sehnde GmbH, DE, Sehnde5 30.0<br />
Energie-Wende-Garching GmbH & Co. KG, DE, Garching,<br />
Landkreis Munich5 33.3<br />
Energie-Wende-Garching Verwaltungs-GmbH, DE,<br />
Garching, Landkreis Munich5 33.3<br />
Energiewerke Isernhagen GmbH, DE, Isernhagen4 49.0<br />
Energiewerke Zeulenroda GmbH, DE, Zeulenroda-Triebes5 49.0<br />
Energos Deutschland GmbH, DE, Helmstedt2 100.0<br />
Energy Collection Services Limited, GB, Coventry1 100.0<br />
ENERGY Sp. z o.o., PL, Pile2 100.0<br />
Enertec Hameln GmbH, DE, Hameln1 100.0<br />
Enfield Energy Centre Limited, GB, Coventry1 100.0<br />
Enfield Energy Services (Europe) Limited, GB, Coventry1 100.0<br />
Enfield Operations (UK) Limited, GB, Coventry1 100.0<br />
Enizade Limited, GB, Coventry1 100.0<br />
ENSECO GmbH, DE, Unterschleißheim, Landkreis Munich5 49.0<br />
Entsorgungsgemeinschaft Oberhavel GbR, DE, Helmstedt2 74.9<br />
Entsorgungszentrum Salzgitter GmbH, DE, Salzgitter5 50.0<br />
Eólica de Levante, S.L., ES, Alicante5 Eólica de São Julião, Lda, PT, Lisbon<br />
25.0<br />
4 EÓLICA MARÍTIMA Y PORTUARIA, SOCIEDAD LIMITADA,<br />
ES, Oviedo<br />
45.0<br />
2 70.0<br />
Eoliser Serviços de Gestão para parques eólicos, Lda, PT,<br />
Lisbon1 100.0<br />
EOS PAX IIA, S.L., ES, Santiago de Compostela4 48.5<br />
EPS Polska Holding Sp. z o.o., PL, Warsaw2 EPS Polska Sp. z o.o., PL, Warsaw<br />
100.0<br />
2 Erdgasversorgungsgesellschaft Thüringen-Sachsen mbH<br />
(EVG), DE, Erfurt<br />
100.0<br />
3 Ergon Energy Limited, GB, Coventry<br />
50.0<br />
1 Ergon Finance Limited (member’s liquidation), GB, Coventry<br />
100.0<br />
2 Name, location Stake (%)<br />
Ergon Holding Company Limited, GB, Coventry<br />
100.0<br />
1 100.0<br />
Ergon Holdings Ltd, MT, St. Julians1 100.0<br />
Ergon Insurance Ltd, MT, St. Julians1 100.0<br />
Ergon Nominees Limited, GB, Coventry1 100.0<br />
Ergon Overseas Holdings Limited, GB, Coventry1 100.0<br />
Ergon Power Limited, GB, Coventry2 100.0<br />
Ergon Properties Limited (member’s liquidation), GB,<br />
Coventry2 100.0<br />
Ergosud S.p.A., IT, Rome4 50.0<br />
ERKA Vermögensverwaltungsgesellschaft mbH, DE,<br />
Düsseldorf2 100.0<br />
ESN EnergieSystemeNord GmbH, DE, Schwentinental5 47.5<br />
Etzel Gas-Lager GmbH & Co. KG, DE, Friedeburg-Etzel7 74.8<br />
Etzel Gas-Lager Management GmbH, DE, Friedeburg-Etzel5 74.8<br />
European Nuclear Energy Leadership Academy GmbH,<br />
DE, Garching5 26.3<br />
Evantec GmbH, DE, Munich2 100.0<br />
EVG Energieversorgung Gemünden GmbH, DE,<br />
Gemünden am Main5 49.0<br />
EVU Services GmbH, DE, Neumünster5 25.0<br />
EVV Elektrizitätsversorgungsgesellschaft Velten mbH, DE,<br />
Velten5 35.0<br />
EW Eichsfeldgas GmbH, DE, Worbis2 49.0<br />
ew wärme GmbH, DE, Bad Heiligenstadt5 49.0<br />
EWC Windpark Cuxhaven GmbH, DE, Munich5 50.0<br />
ews Verwaltungsgesellschaft mbH, DE, Bad Segeberg5 50.2<br />
EZH-SEON b.v., NL, Rotterdam1 100.0<br />
EZH-Systems Inc., US, Delaware2 100.0<br />
EZV Energie- und Service GmbH & Co. KG Untermain, DE,<br />
Wörth am Main5 28.9<br />
EZV Energie- und Service Verwaltungsgesellschaft mbH,<br />
DE, Wörth am Main5 28.8<br />
Falkenbergs Biogas AB, SE, Malmö4 65.0<br />
Farma Wiatrowa Barzowice Sp. z o.o., PL, Warsaw1 100.0<br />
Farma Wiatrowa Lebcz Sp. z o.o., PL, Warsaw1 100.0<br />
Fennovoima Oy, FI, Helsingfors4 34.0<br />
Ferngas Nordbayern GmbH, DE, Nuremberg1 70.0<br />
Fernwärmeversorgung Freising Gesellschaft mit<br />
beschränkter Haftung (FFG), DE, Freising5 Fernwärmeversorgung Herne GmbH, DE, Herne<br />
50.0<br />
5 Fidelia Communications Inc., US, Delaware<br />
50.0<br />
2 100.0<br />
FIDELIA Holding LLC, US, Wilmington1 100.0<br />
Fitas Verwaltung GmbH & Co. Dritte Vermietungs-KG, DE,<br />
Pullach i. Isartal, Landkreis Munich2 90.0<br />
FITAS Verwaltung GmbH & Co. REGIUM-Objekte KG, DE,<br />
Pullach i. Isartal, Landkreis Munich2 FITAS Verwaltung GmbH & Co. Vermietungs-KG, DE,<br />
Pöcking<br />
90.0<br />
2 Flatlands Wind Farm, LLC, US, Wilmington<br />
99.9<br />
2 Forest Creek Investco, Inc., US, Wilmington<br />
100.0<br />
1 Disclosures Pursuant to Section 313 (2) HGB of Companies in Which Equity<br />
Investments Are Held (as of December 31, <strong>2011</strong>)<br />
100.0<br />
1 Consolidated affiliated <strong>com</strong>pany. 2 Non-consolidated affiliated <strong>com</strong>pany for reasons of immateriality. 3 Joint venture pursuant to IAS 31 (valued using the equity method).<br />
4 Associated <strong>com</strong>pany (valued using the equity method). 5 Associated <strong>com</strong>pany (valued at cost for reasons of immateriality). 6 Other <strong>com</strong>panies in which share investments<br />
are held. 7 Included as consolidated associated <strong>com</strong>pany pursuant to SIC-12. 8 This <strong>com</strong>pany exercised its exemption option under Section 264, Paragraph 3 of the German<br />
Commercial Code or under Section 264b of the German Commercial Code. 9 IFRS figures. 10 Short fiscal year October 1, 2010 – September 30, <strong>2011</strong>.<br />
165
166 Notes<br />
Name, location Stake (%)<br />
Forest Creek WF Holdco, LLC, US, Wilmington1 100.0<br />
Forest Creek Wind Farm, LLC, US, Wilmington1 100.0<br />
Frankengas GmbH, DE, Nuremberg4 Freizeitbad Reinbek Betriebsgesellschaft mbH, DE, Reinbek<br />
30.9<br />
5 Freya Bunde-Etzel GmbH & Co. KG, DE, Bonn<br />
49.0<br />
4 G.E.I.—Gestione Energetica Impianti S.p.A., IT, Crema<br />
60.0<br />
4 GAL Beteiligungs GmbH, DE, Porta Westfalica<br />
48.9<br />
5 50.0<br />
Gasag Berliner Gaswerke Aktiengesellschaft, DE, Berlin4 36.9<br />
GasLine Telekommunikationsnetz-Geschäftsführungsgesellschaft<br />
deutscher Gasversorgungsunternehmen mbH,<br />
DE, Straelen5 GasLINE Telekommunikationsnetzgesellschaft deutscher<br />
Gasversorgungsunternehmen mbH & Co. KG, DE, Straelen<br />
40.0<br />
4 Gasspeicher Lehrte GmbH, DE, Helmstedt<br />
40.0<br />
2 Gasum Oy, FI, Espoo<br />
100.0<br />
4 Gas-Union GmbH, DE, Frankfurt/Main<br />
20.0<br />
4 Gasversorgung Bad Rodach GmbH, DE, Bad Rodach<br />
25.9<br />
5 50.0<br />
Gasversorgung Biedenkopf GmbH, DE, Biedenkopf5 49.0<br />
Gasversorgung Ebermannstadt GmbH, DE, Ebermannstadt5 50.0<br />
Gasversorgung Frankenwald GmbH (GFW), DE, Helmbrechts5 50.0<br />
Gasversorgung Greifswald GmbH, DE, Greifswald5 49.0<br />
Gasversorgung im Landkreis Gifhorn GmbH (GLG), DE,<br />
Wolfsburg-Fallersleben1 95.0<br />
Gasversorgung Unterfranken Gesellschaft mit beschränkter<br />
Haftung, DE, Würzburg4 Gasversorgung Vorpommern GmbH, DE, Trassenheide<br />
64.0<br />
5 Gasversorgung Wismar Land GmbH, DE, Lübow<br />
49.0<br />
5 49.0<br />
Gasversorgung Wismar Land Vertrieb GmbH, DE, Lübow5 49.0<br />
Gasversorgung Wunsiedel GmbH, DE, Wunsiedel5 50.0<br />
Gaswerk Bad Sooden-Allendorf GmbH, DE,<br />
Bad Sooden-Allendorf5 49.0<br />
GCE Énergies SARL, FR, La Camp du Castellet2 100.0<br />
Gelsenberg GmbH & Co. KG, DE, Düsseldorf1 100.0<br />
Gelsenberg Verwaltungs GmbH, DE, Düsseldorf2 100.0<br />
Gelsenwasser Beteiligungs-GmbH, DE, Munich1, 8 100.0<br />
Gem. Ges. zur Förderung des E.ON-Instituts für<br />
Energieforschung mbH, DE, Gorleben5 50.0<br />
Gemeindewerke Leck GmbH, DE, Leck5 49.9<br />
Gemeindewerke Uetze GmbH, DE, Uetze5 49.0<br />
Gemeindewerke Wedemark GmbH, DE, Wedemark5 49.0<br />
Gemeindewerke Wietze GmbH, DE, Wietze5 49.0<br />
Gemeinschaftskernkraftwerk Grohnde GmbH & Co. oHG,<br />
DE, Emmerthal1 100.0<br />
Gemeinschaftskernkraftwerk Grohnde Management<br />
GmbH, DE, Emmerthal2 83.2<br />
Gemeinschaftskernkraftwerk Isar 2 GmbH, DE, Essenbach2 75.0<br />
Gemeinschaftskraftwerk Irsching GmbH, DE, Vohburg1 50.2<br />
Gemeinschaftskraftwerk Kiel Gesellschaft mit beschränkter<br />
Haftung, DE, Kiel3 Name, location Stake (%)<br />
Gemeinschaftskraftwerk Staudinger GmbH & Co. KG, DE,<br />
Großkrotzenburg<br />
50.0<br />
1, 8 100.0<br />
Gemeinschaftskraftwerk Staudinger Verwaltungs-GmbH,<br />
DE, Großkrotzenburg2 Gemeinschaftskraftwerk Veltheim Gesellschaft mit<br />
beschränkter Haftung, DE, Porta Westfalica<br />
100.0<br />
1 Gemeinschaftskraftwerk Weser GmbH & Co. oHG, DE,<br />
Emmerthal<br />
66.7<br />
1 66.7<br />
Gen Net.Com Limited, GB, Coventry2 100.0<br />
Generale Servizi S.r.l., IT, Gandino (BG) 2 Geólica Magallón, S.L, ES, Zaragoza<br />
100.0<br />
4 Geothermie-Wärmegesellschaft Braunau-Simbach mbH,<br />
AT, politische Gemeinde Braunau am Inn<br />
36.2<br />
5 Gesellschaft für Energie und Klimaschutz Schleswig-<br />
Holstein GmbH, DE, Kiel<br />
20.0<br />
5 GfS Gesellschaft für Simulatorschulung mbH, DE, Essen<br />
33.3<br />
5 GGG Gesellschaft für Grundstücks- und Gebäudenutzung<br />
mbH, DE, Essen<br />
41.7<br />
2 100.0<br />
GHD E.ON Bayern AG & Co. KG, DE, Dingolfing2 75.0<br />
GLG Netz GmbH, DE, Gifhorn1 100.0<br />
GNR Gesellschaft zur energetischen Nutzung nachwachsender<br />
Rohstoffe mbH, DE, Brakel5 33.3<br />
GNS Gesellschaft für Nuklear-Service mbH, DE, Essen4 48.0<br />
GOLLIPP Bioerdgas GmbH & Co KG, DE, Gollhofen5 50.0<br />
GOLLIPP Bioerdgas Verwaltungs GmbH, DE, Nuremberg5 Gondoskodás-Egymásért Alapítvány, HU, Debrecen<br />
50.0<br />
2 GRE Gesellschaft zur rationellen Energienutzung Horn-<br />
Bad Meinberg mbH, DE, Horn-Bad Meinberg<br />
100.0<br />
5 50.0<br />
Grenzkraftwerke Gesellschaft mit beschränkter Haftung,<br />
DE, Simbach am Inn5 50.0<br />
GreyLogix GmbH, DE, Flensburg5 74.2<br />
Guyane Conhilac Énergies SARL, FR, Cayenne2 100.0<br />
Hamburg Netz GmbH, DE, Hamburg1 100.0<br />
Hamburger Hof Versicherungs-Aktiengesellschaft, DE,<br />
Düsseldorf2 100.0<br />
Hams Hall Management Company Limited, GB, Coventry4 46.6<br />
Harzwasserwerke GmbH, DE, Hildesheim4 20.8<br />
Hauptstadtsee 865. V V GmbH, DE, Berlin5 50.0<br />
Havelstrom Zehdenick GmbH, DE, Zehdenick5 49.0<br />
Heizwerk Holzverwertungsgenossenschaft Stiftland eG &<br />
Co. oHG, DE, Neualbenreuth5 50.0<br />
Helioenergy Electricidad Dos, S.A, ES, Sevilla4 50.0<br />
Helioenergy Electricidad Uno, S.A., ES, Sevilla4 50.0<br />
HEMAB Elförsäljning AB, SE, Malmö1 100.0<br />
Hermann Seippel-Unterstützungseinrichtung GmbH, DE,<br />
Essen2 100.0<br />
HEUREKA-Gamma AG, CH, Baden-Dättwil2 100.0<br />
HGC Hamburg Gas Consult GmbH, DE, Hamburg2 100.0<br />
Hibernia Gamma Beteiligungsgesellschaft mbH, DE,<br />
Frankfurt/Main4 Disclosures Pursuant to Section 313 (2) HGB of Companies in Which Equity<br />
Investments Are Held (as of December 31, <strong>2011</strong>)<br />
39.4<br />
1 Consolidated affiliated <strong>com</strong>pany. 2 Non-consolidated affiliated <strong>com</strong>pany for reasons of immateriality. 3 Joint venture pursuant to IAS 31 (valued using the equity method).<br />
4 Associated <strong>com</strong>pany (valued using the equity method). 5 Associated <strong>com</strong>pany (valued at cost for reasons of immateriality). 6 Other <strong>com</strong>panies in which share investments<br />
are held. 7 Included as consolidated associated <strong>com</strong>pany pursuant to SIC-12. 8 This <strong>com</strong>pany exercised its exemption option under Section 264, Paragraph 3 of the German<br />
Commercial Code or under Section 264b of the German Commercial Code. 9 IFRS figures. 10 Short fiscal year October 1, 2010 – September 30, <strong>2011</strong>.
CEO Letter<br />
E.ON Stock<br />
Combined Group Management <strong>Report</strong><br />
Consolidated Financial Statements<br />
Corporate Governance <strong>Report</strong><br />
Supervisory Board and Board of Management<br />
Tables and Explanations<br />
Name, location Stake (%)<br />
HIBERNIA Industriewerte GmbH & Co. oHG, DE,<br />
Düsseldorf2 100.0<br />
Hochtemperatur-Kernkraftwerk GmbH (HKG), Gemeinsames<br />
europäisches Unternehmen, DE, Hamm5 HOCHTIEF Energy Management Harburg GmbH, DE,<br />
Hamburg<br />
26.0<br />
5 Holford Gas Storage Limited, GB, Edinburgh<br />
35.0<br />
1 Holsteiner Wasser GmbH, DE, Neumünster<br />
100.0<br />
5 50.0<br />
Horizon Nuclear Power Limited, GB, Gloucester3 50.0<br />
Horizon Nuclear Power Oldbury Limited, GB, Gloucester2 100.0<br />
Horizon Nuclear Power Services Limited, GB, Gloucester2 100.0<br />
Horizon Nuclear Power Wylfa Limited, GB, Gloucester2 100.0<br />
HSE AVG Beteiligungs-GmbH, DE, Darmstadt5 HSN Magdeburg GmbH, DE, Magdeburg<br />
50.0<br />
1 HUGE Kft., HU, Budapest<br />
74.9<br />
2 Inadale WF Holdco, LLC, US, Wilmington<br />
100.0<br />
1 Inadale Wind Farm, LLC, US, Wilmington<br />
100.0<br />
1 Induboden GmbH, DE, Düsseldorf<br />
100.0<br />
2 Induboden GmbH & Co. Grundstücksgesellschaft OHG,<br />
DE, Düsseldorf<br />
100.0<br />
1 Induboden GmbH & Co. Industriewerte OHG, DE, Düsseldorf<br />
100.0<br />
1 Industry Development Services Limited, GB, Coventry<br />
100.0<br />
1 Informační služby—energetika, a.s., CZ, Prague<br />
100.0<br />
2 InfraServ-Bayernwerk Gendorf GmbH, DE, Burgkirchen/Alz<br />
100.0<br />
5 Infrastructure Alliance Limited, JE, St. Helier<br />
50.0<br />
1 Infrastrukturgesellschaft Stadt Nienburg/Weser mbH, DE,<br />
Nienburg/Weser<br />
100.0<br />
5 INTERARGEM GbR, DE, Bielefeld<br />
49.9<br />
2 Interargem GmbH, DE, Bielefeld<br />
66.7<br />
1 Inversora de Gas Cuyana S.A., AR, Mendoza<br />
61.2<br />
2 24.0<br />
Inversora de Gas del Centro S.A., AR, Córdoba1 75.0<br />
Inwestycyjna Spólka Energetyczna-IRB Sp. z o.o., PL,<br />
Warsaw5 Isam-Immobilien-GmbH, DE, Munich<br />
50.0<br />
2 Jihočeská plynárenská, a.s., CZ, České Budějovice<br />
100.0<br />
2 Jihomoravská plynárenská, a.s., CZ, Brno<br />
100.0<br />
4 Kajaanin Lämpö Oy, FI, Helsingfors<br />
43.7<br />
4 Kalmar Energi Försäljning AB, SE, Kalmar<br />
50.0<br />
4 Kalmar Energi Holding AB, SE, Kalmar<br />
40.0<br />
4 Karlshamn Kraft AB, SE, Karlshamn<br />
50.0<br />
1 Kärnkraftsäkerhet & Utbildning AB, SE, Nyköping<br />
70.0<br />
5 Kernkraftwerk Brokdorf GmbH & Co. oHG, DE, Hamburg<br />
25.0<br />
1 Kernkraftwerk Brunsbüttel GmbH & Co. oHG, DE, Hamburg<br />
80.0<br />
4 Kernkraftwerk Gundremmingen GmbH, DE,<br />
Gundremmingen<br />
33.3<br />
4 Kernkraftwerk Krümmel GmbH & Co. oHG, DE, Hamburg<br />
25.0<br />
4 50.0<br />
Kernkraftwerk Stade GmbH & Co. oHG, DE, Hamburg1 66.7<br />
Kernkraftwerke Isar Verwaltungs GmbH, DE, Essenbach1, 8 100.0<br />
KGN Kommunalgas Nordbayern GmbH, DE, Bamberg1, 8 Name, location Stake (%)<br />
KGW—Kraftwerk Grenzach-Wyhlen GmbH, DE, Munich<br />
100.0<br />
1 69.8<br />
Klåvbens AB, SE, Olofström5 50.0<br />
Kolbäckens Kraft KB, SE, Sundsvall1 Komáromi Kogenerációs Erőmű Kft., HU, Győr<br />
100.0<br />
2 KommEnergie GmbH, DE, Eichenau, Landkreis<br />
Fürstenfeldbruck<br />
100.0<br />
5 Kommunale Energieversorgung GmbH Eisenhüttenstadt,<br />
DE, Eisenhüttenstadt<br />
67.0<br />
5 49.0<br />
Kommunale Klimaschutzgesellschaft Landkreis Celle<br />
gemeinnützige GmbH, DE, Celle5 25.0<br />
Kommunale Klimaschutzgesellschaft Landkreis Uelzen<br />
gemeinnützige GmbH, DE, Celle5 25.0<br />
Kraftverkehrsgesellschaft Paderborn mbH -KVP-, DE,<br />
Paderborn2 Kraftwerk Buer Betriebsgesellschaft mbH, DE,<br />
Gelsenkirchen<br />
100.0<br />
5 Kraftwerk Buer GbR, DE, Gelsenkirchen<br />
50.0<br />
5 Kraftwerk Burghausen GmbH, DE, Munich<br />
50.0<br />
1, 8 Kraftwerk Hattorf GmbH, DE, Munich<br />
100.0<br />
2 Kraftwerk Obernburg GmbH, DE, Erlenbach am Main<br />
100.0<br />
3 Kraftwerk Plattling GmbH, DE, Munich<br />
50.0<br />
1, 8 Kraftwerk Schkopau Betriebsgesellschaft mbH, DE,<br />
Schkopau<br />
100.0<br />
1 Kraftwerk Schkopau GbR, DE, Schkopau<br />
55.6<br />
1 Kraftwerk Schwedt GmbH & Co. KG, DE, Schwedt<br />
58.1<br />
1 Kraftwerk Schwedt Verwaltungsgesellschaft mbH, DE,<br />
Schwedt<br />
99.0<br />
2 Kraftwerks-Simulator-Gesellschaft mbH, DE, Essen<br />
100.0<br />
5 Kreiswerke Main-Kinzig GmbH, DE, Gelnhausen<br />
41.7<br />
5 Kurgan Grundstücks-Verwaltungsgesellschaft mbH & Co.<br />
oHG, DE, Grünwald, Landkreis Munich<br />
24.5<br />
1 90.0<br />
LandE GmbH, DE, Wolfsburg-Fallersleben1 69.6<br />
Landgas Göhren GmbH, DE, Göhren5 Landwehr Wassertechnik GmbH, DE, Schöppenstedt<br />
40.6<br />
2 Lighting for Staffordshire Holdings Limited, GB, Coventry<br />
100.0<br />
1 Lighting for Staffordshire Limited, GB, Coventry<br />
60.0<br />
1 Lillo Energy NV, BE, Beveren/Antwerp<br />
100.0<br />
5 Limited Liability Company E.ON IT, RU, Moscow<br />
50.0<br />
2 Line WORX GmbH, DE, Essen<br />
100.0<br />
2 Livorno Holding S.r.l., IT, Rome<br />
100.0<br />
5 LIWACOM Informationstechnik GmbH, DE, Essen<br />
50.0<br />
5 Łobeska Energetyka Cieplna Sp. z o.o., PL, Łobez<br />
33.3<br />
2 London Array Limited, GB, Coventry<br />
100.0<br />
5 LSW LandE-Stadtwerke Wolfsburg GmbH & Co. KG, DE,<br />
Wolfsburg<br />
30.0<br />
4 LSW LandE-Stadtwerke Wolfsburg Verwaltungs-GmbH,<br />
DE, Wolfsburg<br />
57.0<br />
5 57.0<br />
Lubmin-Brandov Gastransport GmbH, DE, Essen1 100.0<br />
LUMEN DISTRIBUČNÍ SOUSTAVY, s.r.o., CZ, České Budějovice5 34.0<br />
Lumen Energy a.s., CZ, Prague5 Disclosures Pursuant to Section 313 (2) HGB of Companies in Which Equity<br />
Investments Are Held (as of December 31, <strong>2011</strong>)<br />
40.0<br />
1 Consolidated affiliated <strong>com</strong>pany. 2 Non-consolidated affiliated <strong>com</strong>pany for reasons of immateriality. 3 Joint venture pursuant to IAS 31 (valued using the equity method).<br />
4 Associated <strong>com</strong>pany (valued using the equity method). 5 Associated <strong>com</strong>pany (valued at cost for reasons of immateriality). 6 Other <strong>com</strong>panies in which share investments<br />
are held. 7 Included as consolidated associated <strong>com</strong>pany pursuant to SIC-12. 8 This <strong>com</strong>pany exercised its exemption option under Section 264, Paragraph 3 of the German<br />
Commercial Code or under Section 264b of the German Commercial Code. 9 IFRS figures. 10 Short fiscal year October 1, 2010 – September 30, <strong>2011</strong>.<br />
167
168 Notes<br />
Name, location Stake (%)<br />
LUMEN SYNERGY s.r.o., CZ, České Budějovice5 34.0<br />
Luminar S.r.l., IT, Milan1 100.0<br />
Luna Lüneburg GmbH, DE, Lüneburg5 49.0<br />
Maasvlakte CCS Project B.V., NL, Rotterdam5 50.0<br />
Maasvlakte I b.v., NL, Rotterdam2 100.0<br />
Maasvlakte II b.v., NL, Rotterdam2 MADINERGIE SARL, FR, Le Lamentin<br />
100.0<br />
2 Magic Valley Wind Farm I, LLC, US, Wilmington<br />
100.0<br />
1 Mainkraftwerk Schweinfurt Gesellschaft mit beschränkter<br />
Haftung, DE, Munich<br />
100.0<br />
2 75.0<br />
MCE Énergies SARL, FR, La Camp du Castellet2 100.0<br />
MEC Koszalin Sp. z o.o., PL, Koszalin4 MEGAL Mittel-Europäische-Gasleitungsgesellschaft mbH<br />
& Co. KG, DE, Essen<br />
30.8<br />
3 51.0<br />
MEGAL Verwaltungs-GmbH, DE, Essen2 51.0<br />
MEON Pensions GmbH & Co. KG, DE, Grünwald1 MEON Verwaltungs GmbH, DE, Grünwald<br />
100.0<br />
2 Mer. Wind S.r.l., IT, Rome<br />
100.0<br />
1 Měření dodávek plynu, a.s., CZ, Prague<br />
100.0<br />
2 Metegra GmbH, DE, Laatzen<br />
100.0<br />
5 Meter Services Limited, GB, Coventry<br />
25.0<br />
2 Metering Services Limited, GB, Coventry<br />
100.0<br />
2 METHA-Methanhandel GmbH, DE, Essen<br />
100.0<br />
1, 8 100.0<br />
MFG Flughafen-Grundstücksverwaltungsgesellschaft<br />
mbH & Co. Gamma oHG, DE, Grünwald7 Midlands Electricity Group Limited, GB, Coventry<br />
90.0<br />
1 100.0<br />
Midlands Electricity Limited, GB, Coventry2 100.0<br />
Midlands Electricity Metering Limited, GB, Coventry2 100.0<br />
Midlands Gas Limited, GB, Coventry1 100.0<br />
Midlands Generation (Overseas) Limited, GB, Coventry1 100.0<br />
Midlands Power (UK) Limited, GB, Coventry1 100.0<br />
Midlands Power International Limited, GB, Coventry1 100.0<br />
Midlands Sales Limited, GB, Coventry2 Mittelrheinische Erdgastransportleitungsgesellschaft<br />
mbH, DE, Haan<br />
100.0<br />
1, 8 Mittlere Donau Kraftwerke Aktiengesellschaft, DE, Munich<br />
100.0<br />
2 Montan GmbH Assekuranz-Makler, DE, Düsseldorf<br />
60.0<br />
4 Mosoni-Duna Menti Szélerőmű Kft., HU, Győr<br />
44.3<br />
2 Müllheizkraftwerk Rothensee GmbH, DE, Magdeburg<br />
100.0<br />
7 Munnsville Investco, LLC, US, Wilmington<br />
51.0<br />
1 Munnsville WF Holdco, LLC, US, Wilmington<br />
100.0<br />
1 Munnsville Wind Farm, LLC, US, Wilmington<br />
100.0<br />
1 MVA Bielefeld-Herford GmbH, DE, Bielefeld<br />
100.0<br />
1 Nafta a.s., SK, Bratislava<br />
100.0<br />
4 Nahwärme Bad Oeynhausen-Löhne GmbH, DE,<br />
Bad Oeynhausen<br />
40.5<br />
2 Nahwärmeversorgung Kirchlengern GmbH, DE,<br />
Kirchlengern<br />
65.4<br />
5 50.0<br />
Naturgas Emmerthal GmbH & Co. KG, DE, Emmerthal2 Name, location Stake (%)<br />
NEL Beteiligungs GmbH, DE, Essen<br />
84.6<br />
2 100.0<br />
NetConnect Germany GmbH & Co. KG, DE, Ratingen5 44.0<br />
NetConnect Germany Management GmbH, DE, Ratingen5 44.0<br />
NETRA GmbH Norddeutsche Erdgas Transversale, DE,<br />
Schneiderkrug5 33.3<br />
NETRA GmbH Norddeutsche Erdgas Transversale & Co.<br />
KG, DE, Schneiderkrug4 Netz Veltheim GmbH, DE, Porta Westfalica<br />
40.6<br />
1 Netzanschluss Mürow Oberdorf GbR, DE, Bremerhaven<br />
66.7<br />
5 Netzgesellschaft Gehrden mbH, DE, Gehrden<br />
34.8<br />
5 49.0<br />
Netzgesellschaft Hemmingen mbH, DE, Hemmingen5 49.0<br />
Netzgesellschaft Herrenwald Verwaltung GmbH, DE,<br />
Stadtallendorf2 Netzgesellschaft Schwerin mbH (NGS), DE, Schwerin<br />
51.0<br />
5 40.0<br />
Netzgesellschaft Stuhr/Weyhe mbH, DE, Weyhe5 49.0<br />
Netzservice Mecklenburg-Vorpommern (NMV) GmbH, DE,<br />
Schwerin2 Neue Energien Bad Salzungen GmbH, DE, Bad Salzungen<br />
100.0<br />
5 Neumünster Netz Beteiligungs-GmbH, DE, Neumünster<br />
40.0<br />
1 NHG Netzgesellschaft Herrenwald GmbH & Co. KG, DE,<br />
Stadtallendorf<br />
50.1<br />
2 Nord Stream AG, CH, Zug<br />
51.0<br />
4 Norddeutsche Gesellschaft zur Ablagerung von Mineralstoffen<br />
mbH, DE, Helmstedt<br />
15.5<br />
2 51.0<br />
NORD-direkt GmbH, DE, Neumünster2 Nordrheinische Erdgastransportleitungsgesellschaft<br />
mbH & Co. KG, DE, Haan<br />
100.0<br />
3 50.0<br />
Nordrheinische Erdgastransportleitungs-Verwaltungs-<br />
GmbH, DE, Haan5 50.0<br />
Nordzucker Bioerdgas GmbH & Co. KG, DE, Braunschweig2 50.0<br />
Nordzucker Bioerdgas Verwaltung-GmbH, DE,<br />
Braunschweig2 50.0<br />
Northeolic Montebuño, S.L., ES, Madrid2 100.0<br />
Nürnberger Straße 57 Grundstücks-Verwaltungs GmbH,<br />
DE, Würzburg2 Nyíregyházi Kombinált Ciklusú Erőmű Kft., HU,<br />
Nyíregyháza<br />
100.0<br />
1 OAO E.ON Russia, RU, Surgut<br />
100.0<br />
1 OAO Severneftegazprom, RU, Krasnoselkup<br />
79.0<br />
4 OAO Shaturskaya Upravlyayushchaya Kompaniya, RU,<br />
Shatura<br />
25.0<br />
2 oaza-Krupka, a.s., CZ, Liberec VI<br />
51.0<br />
5 Obere Donau Kraftwerke Aktiengesellschaft, DE, Munich<br />
49.0<br />
2 Oebisfelder Wasser und Abwasser GmbH, DE, Oebisfelde<br />
60.0<br />
5 Offshore Trassenplanungs GmbH, DE, Hanover<br />
49.0<br />
2 Offshore-Windpark Beta Baltic GmbH, DE, Munich<br />
50.0<br />
2 Offshore-Windpark Delta Nordsee GmbH, DE, Munich<br />
100.0<br />
2 OKG AB, SE, Oskarshamn<br />
100.0<br />
1 OLT Offshore LNG Toscana S.p.A., IT, Milan<br />
54.5<br />
4 46.8<br />
One World Hospitality (Proprietary) ltd., ZA, Randburg5 Disclosures Pursuant to Section 313 (2) HGB of Companies in Which Equity<br />
Investments Are Held (as of December 31, <strong>2011</strong>)<br />
50.0<br />
1 Consolidated affiliated <strong>com</strong>pany. 2 Non-consolidated affiliated <strong>com</strong>pany for reasons of immateriality. 3 Joint venture pursuant to IAS 31 (valued using the equity method).<br />
4 Associated <strong>com</strong>pany (valued using the equity method). 5 Associated <strong>com</strong>pany (valued at cost for reasons of immateriality). 6 Other <strong>com</strong>panies in which share investments<br />
are held. 7 Included as consolidated associated <strong>com</strong>pany pursuant to SIC-12. 8 This <strong>com</strong>pany exercised its exemption option under Section 264, Paragraph 3 of the German<br />
Commercial Code or under Section 264b of the German Commercial Code. 9 IFRS figures. 10 Short fiscal year October 1, 2010 – September 30, <strong>2011</strong>.
CEO Letter<br />
E.ON Stock<br />
Combined Group Management <strong>Report</strong><br />
Consolidated Financial Statements<br />
Corporate Governance <strong>Report</strong><br />
Supervisory Board and Board of Management<br />
Tables and Explanations<br />
Name, location Stake (%)<br />
OOO E.ON Ruhrgas E&P Russia, RU, Moscow2 100.0<br />
OOO E.ON Russia, RU, Moscow2 100.0<br />
OOO E.ON Russia Power, RU, Moscow2 100.0<br />
OOO Teplosbyt, RU, Shatura2 100.0<br />
Open Grid Europe GmbH, DE, Essen1, 8 100.0<br />
Open Grid Service GmbH, DE, Essen2 100.0<br />
Oskarshamns Energi AB, SE, Oskarshamn4 50.0<br />
Österreichisch-Bayerische Kraftwerke Aktiengesellschaft,<br />
DE, Simbach am Inn3 50.0<br />
Östersjöfrakt AB, SE, Örebro1 80.0<br />
Östrand Energi AB, SE, Sundsvall1 100.0<br />
Ostrowski Zaklad Ceoplowinczy S.A., PL, Ostrow<br />
Wielkopolski4 48.6<br />
PaderSprinter AG & Co. oHG, DE, Paderborn2 100.0<br />
PADES Personalservice GmbH, DE, Munich2 100.0<br />
Panrusgáz Zrt., HU, Budapest5 50.0<br />
Parq Eolic De Les Basses, S.L., ES, Barcelona5 50.0<br />
Parque Eólico Barlavento, S.A., PT, Lisbon1 90.0<br />
Parque Eólico de Valcaire, S.L., ES, Granada5 45.0<br />
Parque Eólico Sierra de Penadecabras S.L., ES, Madrid2 80.0<br />
PEG Infrastruktur AG, CH, Zug1 100.0<br />
Peißenberger Kraftwerksgesellschaft mit beschränkter<br />
Haftung, DE, Peißenberg, Landkreis Weilheim-Schongau2 100.0<br />
Peißenberger Wärmegesellschaft mbH, DE, Peißenberg,<br />
Landkreis Weilheim-Schongau5 50.0<br />
Perstorps Fjärrvärme AB, SE, Perstorp4 50.0<br />
Pioneer Trail Wind Farm, LLC, US, Wilmington1 100.0<br />
PLEcon Pipeline Engineering Consulting GmbH, DE, Berlin2 PLEdoc Gesellschaft für Dokumentationserstellung und<br />
-pflege mbH, DE, Essen<br />
85.0<br />
2 100.0<br />
Power Technology Limited, GB, Coventry2 100.0<br />
Powerforum Zrt., HU, Budapest5 50.0<br />
Powergen (East Midlands) Investments, GB, Coventry1 Powergen (East Midlands) Loan Notes, GB, Coventry<br />
100.0<br />
1 Powergen Australia Investments Limited, GB, Coventry<br />
100.0<br />
1 Powergen Finance Limited, GB, Coventry<br />
100.0<br />
1 Powergen Gas Limited, GB, Coventry<br />
100.0<br />
2 Powergen Group Holdings Limited, GB, Coventry<br />
100.0<br />
1 Powergen Group Investments, GB, Coventry<br />
100.0<br />
1 Powergen Holdings B.V., NL, Amsterdam<br />
100.0<br />
1 Powergen Holdings SARL, LU, Luxembourg<br />
100.0<br />
1 Powergen International Limited, GB, Coventry<br />
100.0<br />
1 Powergen Investments Limited (member’s liquidation),<br />
GB, Coventry<br />
100.0<br />
2 Powergen Ireland Limited, GB, Coventry<br />
100.0<br />
1 Powergen Limited, GB, Coventry<br />
100.0<br />
1 Powergen LS SE, GB, Coventry<br />
100.0<br />
1 Powergen Luxembourg Holdings SARL, LU, Luxembourg<br />
100.0<br />
1 Name, location Stake (%)<br />
Powergen Overseas Holdings Limited (in member’s liquidation),<br />
GB, Coventry<br />
100.0<br />
2 100.0<br />
Powergen Power No. 1 Limited, GB, Coventry1 100.0<br />
Powergen Power No. 2 Limited, GB, Coventry1 100.0<br />
Powergen Power No. 3 Limited, GB, Coventry1 100.0<br />
Powergen Retail Gas Limited, GB, Coventry2 100.0<br />
Powergen Retail Limited, GB, Coventry1 100.0<br />
Powergen Retail Supply Limited, GB, Coventry1 100.0<br />
Powergen Serang Limited, GB, Coventry2 100.0<br />
Powergen Share Trustees Limited (member’s liquidation),<br />
GB, Coventry1 100.0<br />
Powergen UK Holding Company Limited, GB, Coventry1 100.0<br />
Powergen UK Investments, GB, Coventry1 100.0<br />
Powergen UK Limited, GB, Coventry1 100.0<br />
Powergen UK Securities, GB, Coventry1 100.0<br />
Powergen US Holdings Limited, GB, Coventry1 100.0<br />
Powergen US Investments, GB, Coventry1 100.0<br />
Powergen US Securities Limited, GB, Coventry1 100.0<br />
Powergen Warm Front Limited (member’s voluntary<br />
liquidation), GB, Coventry2 100.0<br />
Powergen Weather Limited, GB, Coventry2 100.0<br />
Pragoplyn, a.s., CZ, Prague-Nové Město1 100.0<br />
Pražská plynárenská Distribuce, a.s., člen koncernu<br />
Pražská plynárenská, a.s., CZ, Prague1 100.0<br />
Pražská plynárenská Holding a.s., CZ, Prague5 49.0<br />
Pražská plynárenská Servis distribuce, a.s., člen koncernu<br />
Pražská plynárenská, a.s., CZ, Prague2 100.0<br />
Pražská plynárenská Správa majetku, s.r.o., člen koncernu<br />
Pražská plynárenská, a.s., CZ, Prague-Michle2 Pražská plynárenská, a.s., CZ, Prague<br />
100.0<br />
1 49.3<br />
Promec Sp. z o.o., PL, Skarżysko Kamienna2 100.0<br />
Prometheus, energetické služby, s.r.o., CZ, Prague2 100.0<br />
Przedsiębiorstwo Energetyki Cieplnej w Barlinku<br />
Sp. z o.o., PL, Barlinek2 PT Power Jawa Barat, ID, Jakarta<br />
51.5<br />
4 Purena GmbH, DE, Wolfenbüttel<br />
40.0<br />
1 Pyron WF Holdco, LLC, US, Wilmington<br />
94.5<br />
1 Pyron Wind Farm, LLC, US, Wilmington<br />
100.0<br />
1 Q-Energie b.v., NL, Eindhoven<br />
100.0<br />
2 Qenergy Sp. z o.o., PL, Warsaw<br />
53.3<br />
5 Raab Karcher Electronic Systems plc, GB, Coventry<br />
40.0<br />
1 RAG-Beteiligungs-Aktiengesellschaft, AT, Maria Enzersdorf<br />
100.0<br />
4 Rauschbergbahn Gesellschaft mit beschränkter Haftung,<br />
DE, Ruhpolding<br />
30.0<br />
2 RDE Regionale Dienstleistungen Energie GmbH & Co. KG,<br />
DE, Würzburg<br />
77.4<br />
2 RDE Verwaltungs-GmbH, DE, Würzburg<br />
60.7<br />
2 ReCon Projektentwicklungs- und Beteiligungsgesellschaft<br />
mbH, DE, Munich<br />
100.0<br />
2 100.0<br />
REGAS GmbH & Co KG, DE, Regensburg5 Disclosures Pursuant to Section 313 (2) HGB of Companies in Which Equity<br />
Investments Are Held (as of December 31, <strong>2011</strong>)<br />
50.0<br />
1 Consolidated affiliated <strong>com</strong>pany. 2 Non-consolidated affiliated <strong>com</strong>pany for reasons of immateriality. 3 Joint venture pursuant to IAS 31 (valued using the equity method).<br />
4 Associated <strong>com</strong>pany (valued using the equity method). 5 Associated <strong>com</strong>pany (valued at cost for reasons of immateriality). 6 Other <strong>com</strong>panies in which share investments<br />
are held. 7 Included as consolidated associated <strong>com</strong>pany pursuant to SIC-12. 8 This <strong>com</strong>pany exercised its exemption option under Section 264, Paragraph 3 of the German<br />
Commercial Code or under Section 264b of the German Commercial Code. 9 IFRS figures. 10 Short fiscal year October 1, 2010 – September 30, <strong>2011</strong>.<br />
169
170 Notes<br />
Name, location Stake (%)<br />
REGAS Verwaltungs-GmbH, DE, Regensburg5 50.0<br />
REGENSBURGER ENERGIE- UND WASSERVERSORGUNG AG,<br />
DE, Regensburg5 35.5<br />
RegioCom GmbH, DE, Magdeburg5 50.0<br />
regiolicht Niedersachsen GmbH, DE, Helmstedt2 100.0<br />
Regnitzstromverwertung Aktiengesellschaft, DE, Erlangen5 33.3<br />
REWAG REGENSBURGER ENERGIE- UND WASSER-<br />
VERSORGUNG AG & CO KG, DE, Regensburg4 35.5<br />
RGE Holding GmbH, DE, Essen1, 8 100.0<br />
Rhein-Main-Donau Aktiengesellschaft, DE, Munich1 77.5<br />
Ringhals AB, SE, Varberg4 29.6<br />
R-KOM Regensburger Telekommunikationsgesellschaft<br />
mbH & Co. KG, DE, Regensburg5 20.0<br />
R-KOM Regensburger Telekommunikationsverwaltungsgesellschaft<br />
mbH, DE, Regensburg5 20.0<br />
RMD Wasserstraßen GmbH, DE, Munich2 100.0<br />
RMD-Consult GmbH Wasserbau und Energie, DE, Munich2 100.0<br />
Roscoe WF Holdco, LLC, US, Wilmington1 100.0<br />
Roscoe Wind Farm, LLC, US, Wilmington1 100.0<br />
Rosengård Invest AB, SE, Malmö5 25.0<br />
Rota Gas S.r.l., IT, Mercato San Severino (SA) 5 49.0<br />
RuhrEnergie GmbH, EVR, DE, Gelsenkirchen1, 8 100.0<br />
S.C. Congaz S.A., RO, Constanţa5 28.6<br />
S.C. Salgaz S.A., RO, Salonta2 60.1<br />
Safetec Entsorgungs- und Sicherheitstechnik GmbH, DE,<br />
Heidelberg2 100.0<br />
Sakab AB, SE, Kumla1 100.0<br />
Sakab Sellbergs AB, SE, Örebro1 100.0<br />
San Juan de Bargas Eólica, S.L., ES, Zaragoza4 47.0<br />
Sand Bluff WF Holdco, LLC, US, Wilmington1 100.0<br />
Sand Bluff Wind Farm, LLC, US, Wilmington1 100.0<br />
Scarweather Sands Limited, GB, Coventry5 50.0<br />
SCF2 S.R.L, IT, Rome2 100.0<br />
SCHLESWAG Abwasser GmbH, DE, Neumünster5 100.0<br />
Schleswig-Holstein Netz AG, DE, Quickborn1 94.4<br />
Schleswig-Holstein Netz GmbH, DE, Rendsburg2 100.0<br />
Schleswig-Holstein Netz Verwaltungs-GmbH, DE, Quickborn1 100.0<br />
Sea Power & Fuel S.r.l., IT, Genoa5 50.0<br />
SEC Energia Sp. z o.o., PL, Szczecin2 100.0<br />
SEE-Sul Energia Eólica, Lda, PT, Lisbon1 100.0<br />
SERVICE plus GmbH, DE, Neumünster2 100.0<br />
Service Plus Recycling GmbH, DE, Neumünster2 100.0<br />
Settlers Trail Wind Farm, LLC, US, Wilmington1 100.0<br />
Sinergia Andaluza, S.L., ES, Granada5 25.0<br />
SINERGIA ARAGONESA, S.L., ES, Zaragoza2 60.0<br />
Sisyphus Quebec Limited, GB, Coventry1 100.0<br />
SKO ENERGO FIN, s.r.o., CZ, Mlada Boleslav4 42.5<br />
SKO ENERGO, s.r.o., CZ, Mlada Boleslav5 21.0<br />
Slovak Gas Holding B.V., NL, Zoetermeer3 Name, location Stake (%)<br />
SO.MET. ENERGIA S.r.l., IT, Costigliole d’Asti (AT)<br />
50.0<br />
1 60.0<br />
Sociedad Eólica Salmantina, S.L, ES, Salamanca1 90.0<br />
Société des Eaux de l’Est S.A., FR, Saint-Avold (Creutzwald) 4 25.0<br />
Société Nationale d’Électricité et de Thermique, S.A.<br />
(SNET), FR, Paris1 100.0<br />
Söderåsens Bioenergi AB, SE, Billesholm4 51.0<br />
Solar Energy s.r.o., CZ, Znojmo5 25.0<br />
Solare Bulgaria Group OOD, BG, Varna5 25.1<br />
Sollefteåforsens AB, SE, Sundsvall4 50.0<br />
SOTECTRAT Tratamento de Residuos Sólidos, Portugal,<br />
Unipessoal Lda., PT, Funchal2 100.0<br />
SQC Kvalificeringscentrum AB, SE, Stockholm5 33.3<br />
Städtische Betriebswerke Luckenwalde GmbH, DE,<br />
Luckenwalde5 29.0<br />
Städtische Werke Magdeburg GmbH, DE, Magdeburg4 26.7<br />
Stadtversorgung Pattensen GmbH & Co. KG, DE, Pattensen5 49.0<br />
Stadtversorgung Pattensen Verwaltung GmbH, DE,<br />
Pattensen5 49.0<br />
Stadtwerk Haßfurt GmbH, DE, Haßfurt5 24.9<br />
Stadtwerke Arnstadt GmbH, DE, Arnstadt5 44.0<br />
Stadtwerke Bad Bramstedt GmbH, DE, Bad Bramstedt5 36.0<br />
Stadtwerke Bad Langensalza GmbH, DE, Bad Langensalza5 40.0<br />
Stadtwerke Barth GmbH, DE, Barth5 49.0<br />
Stadtwerke Bebra GmbH, DE, Bebra5 20.0<br />
Stadtwerke Bergen GmbH, DE, Bergen5 49.0<br />
Stadtwerke Blankenburg GmbH, DE, Blankenburg5 30.0<br />
Stadtwerke Bogen GmbH, DE, Bogen5 41.0<br />
Stadtwerke Brandenburg an der Havel GmbH, DE,<br />
Brandenburg an der Havel4 36.8<br />
Stadtwerke Bredstedt GmbH, DE, Bredstedt5 49.9<br />
Stadtwerke Burgdorf GmbH, DE, Burgdorf5 49.0<br />
Stadtwerke Ebermannstadt Versorgungsbetriebe GmbH,<br />
DE, Ebermannstadt5 25.0<br />
Stadtwerke Eggenfelden GmbH, DE, Eggenfelden5 49.0<br />
Stadtwerke Eisenberg GmbH, DE, Eisenberg5 49.0<br />
Stadtwerke Frankfurt (Oder) GmbH, DE, Frankfurt/Oder4 39.0<br />
Stadtwerke Garbsen GmbH, DE, Garbsen4 24.9<br />
Stadtwerke Geesthacht GmbH, DE, Geesthacht5 24.9<br />
Stadtwerke Gelnhausen GmbH, DE, Gelnhausen1 100.0<br />
Stadtwerke Gotha GmbH, DE, Gotha4 48.0<br />
Stadtwerke Göttingen AG, DE, Göttingen2 48.9<br />
Stadtwerke Husum GmbH, DE, Husum5 49.9<br />
Stadtwerke Lage GmbH, DE, Lage5 45.0<br />
Stadtwerke Leinefelde GmbH, DE, Leinefelde-Worbis5 49.0<br />
Stadtwerke Lichtenau GmbH, DE, Lichtenau5 25.0<br />
Stadtwerke Lübz GmbH, DE, Lübz5 25.0<br />
Stadtwerke Ludwigsfelde GmbH, DE, Ludwigsfelde5 29.0<br />
Stadtwerke Mühlhausen GmbH, DE, Mühlhausen5 Disclosures Pursuant to Section 313 (2) HGB of Companies in Which Equity<br />
Investments Are Held (as of December 31, <strong>2011</strong>)<br />
23.9<br />
1 Consolidated affiliated <strong>com</strong>pany. 2 Non-consolidated affiliated <strong>com</strong>pany for reasons of immateriality. 3 Joint venture pursuant to IAS 31 (valued using the equity method).<br />
4 Associated <strong>com</strong>pany (valued using the equity method). 5 Associated <strong>com</strong>pany (valued at cost for reasons of immateriality). 6 Other <strong>com</strong>panies in which share investments<br />
are held. 7 Included as consolidated associated <strong>com</strong>pany pursuant to SIC-12. 8 This <strong>com</strong>pany exercised its exemption option under Section 264, Paragraph 3 of the German<br />
Commercial Code or under Section 264b of the German Commercial Code. 9 IFRS figures. 10 Short fiscal year October 1, 2010 – September 30, <strong>2011</strong>.
CEO Letter<br />
E.ON Stock<br />
Combined Group Management <strong>Report</strong><br />
Consolidated Financial Statements<br />
Corporate Governance <strong>Report</strong><br />
Supervisory Board and Board of Management<br />
Tables and Explanations<br />
Name, location Stake (%)<br />
Stadtwerke Neunburg vorm Wald Strom GmbH, DE,<br />
Neunburg vorm Wald5 24.9<br />
Stadtwerke Neustadt a. Rbge. GmbH & Co. KG, DE,<br />
Neustadt a. Rbge. 4 24.9<br />
Stadtwerke Neustadt a. Rbge. Verwaltungs-GmbH, DE,<br />
Neustadt a. Rbge. 5 24.9<br />
Stadtwerke Neustadt an der Orla GmbH, DE,<br />
Neustadt an der Orla5 Stadtwerke Niebüll GmbH, DE, Niebüll<br />
20.0<br />
5 Stadtwerke Parchim GmbH, DE, Parchim<br />
49.9<br />
5 Stadtwerke Premnitz GmbH, DE, Premnitz<br />
25.2<br />
5 Stadtwerke Pritzwalk GmbH, DE, Pritzwalk<br />
35.0<br />
5 Stadtwerke Ribnitz-Damgarten GmbH, DE,<br />
Ribnitz-Damgarten<br />
49.0<br />
5 Stadtwerke Schwedt GmbH, DE, Schwedt/Oder<br />
39.0<br />
4 Stadtwerke Sondershausen GmbH, DE, Sondershausen<br />
37.8<br />
5 Stadtwerke Stadtroda GmbH, DE, Stadtroda<br />
23.9<br />
5 Stadtwerke Suhl/Zella-Mehlis GmbH, DE, Suhl<br />
24.9<br />
4 Stadtwerke Tornesch GmbH, DE, Tornesch<br />
44.4<br />
5 Stadtwerke Vilshofen GmbH, DE, Vilshofen<br />
49.0<br />
5 Stadtwerke Weilburg GmbH, DE, Weilburg an der Lahn<br />
41.0<br />
5 Stadtwerke Weimar Stadtversorgungs-GmbH, DE, Weimar<br />
20.0<br />
4 Stadtwerke Wismar GmbH, DE, Wismar<br />
49.0<br />
4 Stadtwerke Wittenberge GmbH, DE, Wittenberge<br />
49.0<br />
5 Stadtwerke Wolfenbüttel GmbH, DE, Wolfenbüttel<br />
22.7<br />
4 Stadtwerke Wolmirstedt GmbH, DE, Wolmirstedt<br />
26.0<br />
5 Statco Six Limited, GB, London<br />
49.4<br />
1 Stensjön Kraft AB, SE, Stockholm<br />
100.0<br />
4 Stony Creek WF Holdco, LLC, US, Wilmington<br />
50.0<br />
1 Stony Creek Wind Farm, LLC, US, Wilmington<br />
100.0<br />
1 store-x Storage Capacity Exchange GmbH, DE, Leipzig<br />
100.0<br />
5 Strom Germering GmbH, DE, Germering, Landkreis<br />
Fürstenfeldbruck<br />
38.0<br />
2 90.0<br />
Stromnetzgesellschaft Bad Salzdetfurth mbH, DE,<br />
Bad Salzdetfurth5 49.0<br />
Stromversorgung Ahrensburg GmbH, DE, Ahrensburg2 100.0<br />
Stromversorgung Angermünde GmbH, DE, Angermünde5 49.0<br />
Stromversorgung Ruhpolding Gesellschaft mit<br />
beschränkter Haftung, DE, Ruhpolding2 100.0<br />
Stromversorgung Zerbst GmbH & Co. KG, DE, Zerbst5 30.0<br />
Stromversorgung Zerbst Verwaltungs-GmbH, DE, Zerbst5 30.0<br />
strotög GmbH Strom für Töging, DE, Töging am Inn5 50.0<br />
SüdWasser GmbH, DE, Erlangen2 SULPUR Grundstücks-Vermietungsgesellschaft mbH & Co.<br />
Objekt Erfurt KG i.L., DE, Schönefeld<br />
100.0<br />
2 83.3<br />
Sunshine 1 S.r.l., IT, Milan2 100.0<br />
Surschiste, S.A., FR, Mazingarbe2 100.0<br />
SV Civitella S.r.l., IT, Milan1 100.0<br />
SV VII S.r.l., IT, Milan1 100.0<br />
Svensk Kärnbränslehantering AB, SE, Stockholm5 Name, location Stake (%)<br />
Svenskt Gastekniskt Center AB, SE, Malmö<br />
34.0<br />
5 50.0<br />
SVH Stromversorgung Haar GmbH, DE, Haar, Landkreis<br />
Munich5 50.0<br />
SVI-Stromversorgung Ismaning GmbH, DE, Ismaning,<br />
Landkreis Munich5 49.0<br />
SVO Energie GmbH, DE, Celle1 97.5<br />
SVO Holding GmbH, DE, Celle1 SVO Vertrieb GmbH, DE, Celle<br />
50.1<br />
1 SWE Energie GmbH, DE, Erfurt<br />
100.0<br />
4 SWE Netz GmbH, DE, Erfurt<br />
29.0<br />
4 SWE Technische Service GmbH, DE, Erfurt<br />
29.0<br />
5 SWN Stadtwerke Neustadt GmbH, DE, Neustadt bei Coburg<br />
25.1<br />
4 SWS Energie GmbH, DE, Stralsund<br />
25.1<br />
4 Sydkraft EC Slupsk Sp. z o.o., PL, Slupsk<br />
49.0<br />
1 Sydkraft Polen AB, SE, Malmö<br />
98.9<br />
1 Sydkraft Term Sp. z o.o., PL, Poznań<br />
100.0<br />
1 Sydkraft Zlotow Sp. z o.o., PL, Zlotow<br />
100.0<br />
1 Szczecinska Energetyka Cieplna Sp. z o.o., PL, Szczecin<br />
85.0<br />
1 Szombathelyi Erőmű Zrt., HU, Szombathely<br />
66.4<br />
2 Szombathelyi Távhöszolgáltató Kft., HU, Szombathely<br />
55.0<br />
5 Tapolcai Kogenerációs Erőmű Kft., HU, Győr<br />
25.0<br />
2 Tauerngasleitung GmbH, AT, Wals-Siezenheim<br />
100.0<br />
5 Technische Werke Delitzsch GmbH, DE, Delitzsch<br />
48.0<br />
4 TEN Thüringer Energienetze GmbH, DE, Erfurt<br />
25.1<br />
1 Teplárna Kyjov, a.s., CZ, Kyjov<br />
100.0<br />
2 Teplárna Otrokovice a.s., CZ, Otrokovice<br />
99.3<br />
1 Teplárna Tábor, a.s., CZ, Tábor<br />
100.0<br />
1 Terminal Alpi Adriatico S.r.l., IT, Rome<br />
51.5<br />
1 Terrakomp GmbH, DE, Helmstedt<br />
100.0<br />
2 THB Thüringer Breitband GmbH, DE, Weimar<br />
100.0<br />
2 The Power Generation Company Limited, GB, Coventry<br />
100.0<br />
2 Thor Cogeneration Limited, GB, Coventry<br />
100.0<br />
1 100.0<br />
Thor Holdings Limited, GB, Coventry1 100.0<br />
Thüringer Energie Netzservice Geschäftsführungsgesellschaft<br />
mbH, DE, Erfurt2 100.0<br />
Thüringer Energie Netzservice GmbH & Co. KG, DE, Erfurt2 100.0<br />
Thüringer Netkom GmbH, DE, Weimar2 100.0<br />
TPG Wind Limited, GB, Coventry4 50.0<br />
Tractaments de Juneda, S.A., ES, Lérida4 26.4<br />
Trans Europa Naturgas Pipeline Gesellschaft mbH & Co.<br />
KG, DE, Essen4 51.0<br />
Trans Europa Naturgas Pipeline Verwaltungs-GmbH, DE,<br />
Essen5 TREA Breisgau Betriebsgesellschaft mbH, DE, Eschbach<br />
50.0<br />
2 74.9<br />
TREA Breisgau Energieverwertung GmbH, DE, Eschbach5 30.0<br />
Treasury, SE, Malmö1 100.0<br />
TXU Europe (AH Online) Limited, GB, Coventry1 100.0<br />
TXU Europe (AHG) Limited, GB, Coventry1 100.0<br />
TXU Europe (AHGD) Limited, GB, Coventry1 Disclosures Pursuant to Section 313 (2) HGB of Companies in Which Equity<br />
Investments Are Held (as of December 31, <strong>2011</strong>)<br />
100.0<br />
1 Consolidated affiliated <strong>com</strong>pany. 2 Non-consolidated affiliated <strong>com</strong>pany for reasons of immateriality. 3 Joint venture pursuant to IAS 31 (valued using the equity method).<br />
4 Associated <strong>com</strong>pany (valued using the equity method). 5 Associated <strong>com</strong>pany (valued at cost for reasons of immateriality). 6 Other <strong>com</strong>panies in which share investments<br />
are held. 7 Included as consolidated associated <strong>com</strong>pany pursuant to SIC-12. 8 This <strong>com</strong>pany exercised its exemption option under Section 264, Paragraph 3 of the German<br />
Commercial Code or under Section 264b of the German Commercial Code. 9 IFRS figures. 10 Short fiscal year October 1, 2010 – September 30, <strong>2011</strong>.<br />
171
172 Notes<br />
Name, location Stake (%)<br />
TXU Europe (AHST) Limited, GB, Coventry1 100.0<br />
TXU Europe Group Trustee Limited, GB, Coventry1 100.0<br />
TXU Warm Front Limited, GB, Coventry2 100.0<br />
Überlandwerk Leinetal GmbH, DE, Gronau4 48.0<br />
Umspannwerk Miltzow-Mannhagen GbR, DE, Horst5 36.8<br />
Umwelt- und Wärmeenergiegesellschaft Strasburg<br />
GmbH, DE, Strasburg2 100.0<br />
Unión de Generadores de Energía, S.A., ES, Zaragoza4 50.0<br />
UNIVERSAL SUN S.R.L., IT, Milan5 Untere Iller AG, DE, Landshut<br />
50.0<br />
2 Uranit GmbH, DE, Jülich<br />
60.0<br />
3 Utilities Center Maasvlakte Leftbank b.v., NL, Rotterdam<br />
50.0<br />
1 Utility Debt Services Limited, GB, Coventry<br />
100.0<br />
2 Valoritzacions Agroramaderes Les Garrigues, S.L., ES, Lérida<br />
100.0<br />
4 VEBA Electronics Beteiligungs GmbH, DE,<br />
Norderfriedrichskoog<br />
36.8<br />
1 VEBA Electronics GmbH, DE, Norderfriedrichskoog<br />
100.0<br />
1 VEBA Electronics LLC, US, Wilmington<br />
100.0<br />
1 VEBA Electronics US Holding GmbH, DE,<br />
Norderfriedrichskoog<br />
100.0<br />
1 VEBA Investments Limited, GB, Coventry<br />
100.0<br />
1 VEBA OIL SUPPLY AND TRADING LLC, US, Red Bank<br />
100.0<br />
1 100.0<br />
VEBACOM Holdings LLC, US, Wilmington2 100.0<br />
Venado Wind Farm, LLC, US, Wilmington2 100.0<br />
Verkehrs-Servicegesellschaft Paderborn/Höxter mbH, DE,<br />
Paderborn5 Versorgungsbetrieb Waldbüttelbrunn GmbH, DE,<br />
Waldbüttelbrunn<br />
37.0<br />
5 Versorgungsbetriebe Helgoland GmbH, DE, Helgoland<br />
49.0<br />
2 Versorgungskasse Energie (VVaG), DE, Hanover<br />
90.0<br />
1 Versuchsatomkraftwerk Kahl GmbH, DE, Karlstein<br />
95.1<br />
5 Veszprém-Kogeneráció Energiatermelő Zrt., HU, Győr<br />
20.0<br />
2 VEW-VKR Fernwärmeleitung Shamrock-Bochum GbR, DE,<br />
Gelsenkirchen-Buer<br />
100.0<br />
2 55.1<br />
VIAG Connect Ges. für Telekommunikation Ges.m.b.H., AT,<br />
Vienna2 100.0<br />
Visioncash, GB, Coventry1 100.0<br />
Volkswagen AG Preussen Elektra AG Offene Handelsgesellschaft,<br />
DE, Wolfsburg3 Wärme- und Wasserversorgung Friedensstadt GmbH, DE,<br />
95.0<br />
Trebbin OT Blankensee5 Name, location Stake (%)<br />
Wärmeversorgung Schenefeld GmbH, DE, Schenefeld<br />
50.0<br />
5 40.0<br />
Wärmeversorgung Sollstedt GmbH, DE, Sollstedt5 49.0<br />
Wärmeversorgungsgesellschaft Königs Wusterhausen<br />
mbH, DE, Königs Wusterhausen2 50.1<br />
Warmtebedrijf Exploitatie N.V., NL, Rotterdam5 50.0<br />
Wasser GmbH Salzhemmendorf, DE, Salzhemmendorf5 49.0<br />
Wasser- und Abwassergesellschaft Vienenburg mbH, DE,<br />
Vienenburg5 49.0<br />
Wasserkraftnutzung im Landkreis Gifhorn GmbH, DE,<br />
Müden/Aller5 Wasserversorgung Sarstedt GmbH, DE, Sarstedt<br />
50.0<br />
5 Wasserwerk Gifhorn Beteiligungs-GmbH, DE, Gifhorn<br />
49.0<br />
5 Wasserwerk Gifhorn GmbH & Co KG, DE, Gifhorn<br />
49.8<br />
5 Wasserwerks-Betriebsgemeinschaft Klein Heidorn GbR,<br />
DE, Neustadt a. Rbge.<br />
49.8<br />
5 Wasserwirtschafts- und Betriebsgesellschaft Grafenwöhr<br />
GmbH, DE, Grafenwöhr<br />
50.0<br />
5 WAZV-Abwasserentsorgung GmbH, DE, Nentershausen<br />
49.0<br />
5 WBG GmbH, DE, Helmstedt<br />
49.0<br />
1 WEA Schönerlinde GbR mbH Kiepsch & Bosse & Beteiligungsges.<br />
e.disnatur mbH, DE, Berlin<br />
98.0<br />
2 Weißmainkraftwerk Röhrenhof Aktiengesellschaft, DE,<br />
Berneck<br />
70.0<br />
2 93.5<br />
Western Gas Limited, GB, Coventry1 100.0<br />
WEVG Salzgitter GmbH & Co. KG, DE, Salzgitter1 50.2<br />
WEVG Verwaltungs GmbH, DE, Salzgitter2 WGS Wärmegesellschaft mbH Saalfeld, DE, Saalfeld<br />
50.2<br />
5 Wildcat Wind Farm I, LLC, US, Wilmington<br />
24.0<br />
1 Wildcat Wind Farm II, LLC, US, Wilmington<br />
100.0<br />
2 WINDENERGIEPARK WESTKÜSTE GmbH, DE, Rendsburg<br />
100.0<br />
2 Windpark Anhalt-Süd (Köthen) OHG, DE, Potsdam<br />
80.0<br />
2 Windpark Mutzschen OHG, DE, Potsdam<br />
83.3<br />
2 Windpark Naundorf OHG, DE, Potsdam<br />
77.8<br />
2 Windy Hills Limited, GB, County Tyrone<br />
66.7<br />
1 100.0<br />
WPG Westfälische Propan-GmbH, DE, Detmold5 22.2<br />
WVM Wärmeversorgung Maßbach GmbH, DE, Maßbach5 22.2<br />
Yorkshire Windpower Limited, GB, Coventry4 50.0<br />
ZAO Gazprom YRGM Development, RU, Salekhard7 25.0<br />
Západoslovenská energetika a.s. (ZSE), SK, Bratislava4 Disclosures Pursuant to Section 313 (2) HGB of Companies in Which Equity<br />
Investments Are Held (as of December 31, <strong>2011</strong>)<br />
49.0<br />
1 Consolidated affiliated <strong>com</strong>pany. 2 Non-consolidated affiliated <strong>com</strong>pany for reasons of immateriality. 3 Joint venture pursuant to IAS 31 (valued using the equity method).<br />
4 Associated <strong>com</strong>pany (valued using the equity method). 5 Associated <strong>com</strong>pany (valued at cost for reasons of immateriality). 6 Other <strong>com</strong>panies in which share investments<br />
are held. 7 Included as consolidated associated <strong>com</strong>pany pursuant to SIC-12. 8 This <strong>com</strong>pany exercised its exemption option under Section 264, Paragraph 3 of the German<br />
Commercial Code or under Section 264b of the German Commercial Code. 9 IFRS figures. 10 Short fiscal year October 1, 2010 – September 30, <strong>2011</strong>.
CEO Letter<br />
E.ON Stock<br />
Combined Group Management <strong>Report</strong><br />
Consolidated Financial Statements<br />
Corporate Governance <strong>Report</strong><br />
Supervisory Board and Board of Management<br />
Tables and Explanations<br />
Name, location<br />
Consolidated investment funds<br />
Stake %<br />
ACTIVEST A 5 Fonds, DE, Unterföhring7 100.0<br />
ACTIVEST B 18 Fonds, DE, Unterföhring7 100.0<br />
E.ON Treasury 1, DE, Unterföhring7 100.0<br />
EBW Fonds, DE, Unterföhring7 100.0<br />
EDEN Fonds, DE, Unterföhring7 100.0<br />
GRP Fonds, DE, Unterföhring7 100.0<br />
GSB Fonds, DE, Unterföhring7 100.0<br />
GSBW 1 Fonds, DE, Unterföhring7 100.0<br />
HANSE 2 Fonds, DE, Unterföhring7 100.0<br />
MEA Fonds, DE, Unterföhring7 100.0<br />
ON Balance 1 Fonds, DE, Unterföhring7 100.0<br />
OP-ONE Fonds, DE, Unterföhring7 100.0<br />
SEW Fonds, DE, Unterföhring7 100.0<br />
TASSILO Fonds, DE, Unterföhring7 100.0<br />
VKE Fonds, DE, Unterföhring7 100.0<br />
WEB Fonds, DE, Unterföhring7 Disclosures Pursuant to Section 313 (2) HGB of Companies in Which Equity<br />
Investments Are Held (as of December 31, <strong>2011</strong>)<br />
100.0<br />
Equity Earnings<br />
Name, location<br />
Other <strong>com</strong>panies in which share investments are held<br />
Stake % € in millions € in millions<br />
AB Lesto, LT, Vilnius6 11.8 635.5 -1.9<br />
Baumgarten-Oberkappel-Gasleitungsgesellschaft m.b.H., AT, Vienna6 15.0 35.0 24.8<br />
Enovos International S.A., LU, Esch-sur-Alzette6 10.0 619.1 89.6<br />
European Energy Exchange AG, DE, Leipzig6 3.5 57.6 7.5<br />
Forsmarks Kraftgrupp AB, SE, Östhammar6, 9 8.5 32.3 0.1<br />
Gasnor AS, NO, Avaldsnes6 14.0 42.5 6.6<br />
Holdigaz SA, CH, Vevey6 2.2 59.8 11.4<br />
Interconnector (UK) Limited, GB, London6, 10 15.1 52.3 19.2<br />
Powernext, S.A., FR, Paris6 4.9 18.8 5.1<br />
Trans Adriatic Pipeline AG, CH, Baar6 15.0 32.5 -12.2<br />
Transitgas AG, CH, Zurich6 3.0 86.4 2.3<br />
1 Consolidated affiliated <strong>com</strong>pany. 2 Non-consolidated affiliated <strong>com</strong>pany for reasons of immateriality. 3 Joint venture pursuant to IAS 31 (valued using the equity method).<br />
4 Associated <strong>com</strong>pany (valued using the equity method). 5 Associated <strong>com</strong>pany (valued at cost for reasons of immateriality). 6 Other <strong>com</strong>panies in which share investments<br />
are held. 7 Included as consolidated associated <strong>com</strong>pany pursuant to SIC-12. 8 This <strong>com</strong>pany exercised its exemption option under Section 264, Paragraph 3 of the German<br />
Commercial Code or under Section 264b of the German Commercial Code. 9 IFRS figures. 10 Short fiscal year October 1, 2010 – September 30, <strong>2011</strong>.<br />
173
174<br />
Corporate Governance <strong>Report</strong><br />
Corporate Governance Declaration, made in accordance<br />
with Section 289a of the German Commercial<br />
Code (Part of the Combined Group Management<br />
<strong>Report</strong>)<br />
Declaration of Compliance with the German Corporate<br />
Governance Code, made in accordance with<br />
Section 161 of the German Stock Corporation Act,<br />
by the Board of Management and the Supervisory<br />
Board of E.ON AG<br />
“The Board of Management and the Supervisory Board hereby<br />
declare that E.ON AG, from the date of its previous declaration<br />
of <strong>com</strong>pliance (December 13, 2010) to the date its declaration<br />
was updated (March 8, <strong>2011</strong>), fully <strong>com</strong>plied with the re<strong>com</strong>mendations<br />
contained in the German Corporate Governance<br />
Code (‘the Code’), dated May 26, 2010, prepared by the Government<br />
Commission appointed by the German Minister of<br />
Justice and published in the official section of the electronic<br />
version of the Bundesanzeiger. Since March 8, <strong>2011</strong>, E.ON AG<br />
has fully <strong>com</strong>plied with all of the Code’s re<strong>com</strong>mendations, and<br />
will do so in the future, with the following exception:<br />
Section 5.4.6, Paragraph 2, Item 1 of the Code re<strong>com</strong>mends<br />
that Supervisory Board members receive performance-based<br />
<strong>com</strong>pensation in addition to fixed <strong>com</strong>pensation. In May<br />
<strong>2011</strong>, the E.ON <strong>Annual</strong> Shareholders Meeting decided to change<br />
the Supervisory Board’s <strong>com</strong>pensation to consist only of<br />
fixed <strong>com</strong>pensation and to adjust the Company’s Articles of<br />
Association accordingly. The <strong>2011</strong> financial year is the first<br />
for which the new rule applies. The purpose of eliminating<br />
performance-based <strong>com</strong>pensation is to further enhance the<br />
Supervisory Board’s independence. This change to the Company’s<br />
Articles of Association also reflects current developments<br />
in discussions regarding corporate governance.<br />
Düsseldorf, December 12, <strong>2011</strong><br />
For the Supervisory Board of E.ON AG:<br />
Werner Wenning<br />
(Chairman of the Supervisory Board of E.ON AG)<br />
For the Board of Management of E.ON AG<br />
Dr. Johannes Teyssen<br />
(Chairman of the Board of Management of E.ON AG)<br />
The declaration is published on the Company’s webpage at<br />
www.eon.<strong>com</strong> and is thus publicly available to shareholders<br />
at all times.<br />
Relevant Information about Management Practices<br />
Corporate Governance<br />
E.ON views corporate governance as a central foundation of<br />
responsible and value-oriented management, efficient collaboration<br />
between the Board of Management and the Supervisory<br />
Board, transparent disclosures, and appropriate risk<br />
management.<br />
In <strong>2011</strong>, the Board of Management and Supervisory Board<br />
paid close attention to E.ON’s <strong>com</strong>pliance with the Code’s<br />
re<strong>com</strong>mendations and suggestions. They determined that E.ON<br />
<strong>com</strong>plies with all of the Code’s re<strong>com</strong>mendations (with one<br />
exception described in the declaration above) and with nearly<br />
all of its suggestions.<br />
Transparent Management<br />
Transparency is a high priority of E.ON AG’s Board of Management<br />
and Supervisory Board. Our shareholders, all capital<br />
market participants, financial analysts, shareholder associations,<br />
and the media regularly receive up-to-date information<br />
about the situation of, and any material changes to, the Company.<br />
We primarily use the Internet to help ensure that all<br />
investors have equal access to <strong>com</strong>prehensive and timely<br />
information about the Company.<br />
E.ON AG issues reports about its situation and earnings by<br />
the following means:<br />
• Interim <strong>Report</strong>s<br />
• <strong>Annual</strong> <strong>Report</strong><br />
• <strong>Annual</strong> press conference<br />
• Press releases<br />
• Telephone conferences held on release of the quarterly<br />
Interim <strong>Report</strong>s and the <strong>Annual</strong> <strong>Report</strong><br />
• Numerous events for financial analysts in and outside<br />
Germany.<br />
A financial calendar lists the dates on which the Company’s<br />
financial reports are released.
In addition to the Company’s periodic financial reports, the<br />
Company issues ad hoc statements when events or changes<br />
occur at E.ON AG that could have a significant impact on the<br />
price of E.ON stock.<br />
Pursuant to Section 10 of the German Securities Prospectus<br />
Law, E.ON is required to publish an annual document that<br />
contains all its ad hoc and financial releases of the previous<br />
12 months.<br />
The financial calendar, ad hoc statements, and annual document<br />
are available on the Internet at www.eon.<strong>com</strong>.<br />
Directors’ Dealings<br />
Persons with executive responsibilities, in particular members<br />
of E.ON AG’s Board of Management and Supervisory Board,<br />
and persons closely related to them, must disclose their dealings<br />
in E.ON stock or in related financial instruments pursuant<br />
to Section 15a of the German Securities Trading Act. Such<br />
dealings that took place in <strong>2011</strong> have been disclosed on the<br />
Internet at www.eon.<strong>com</strong>. As of December 31, <strong>2011</strong>, there<br />
was no ownership interest subject to disclosure pursuant to<br />
Item 6.6 of the Code.<br />
Integrity<br />
Our actions are grounded in integrity and a respect for the<br />
law. The basis for this is our Code of Conduct, issued by the<br />
Board of Management, which emphasizes that all employees<br />
must <strong>com</strong>ply with laws and regulations and with Company<br />
policies. These relate to dealing with business partners, third<br />
parties, and government institutions, particularly with regard<br />
to antitrust law, the granting and accepting of benefits, the<br />
involvement of intermediaries, and the selection of suppliers<br />
and service providers. Other rules address issues such as the<br />
avoidance of conflicts of interest (such as the prohibition<br />
to <strong>com</strong>pete, secondary employment, material financial investments)<br />
and handling <strong>com</strong>pany information, property, and<br />
resources. The policies and procedures of our Compliance Organization<br />
ensure the investigation, evaluation, cessation, and<br />
punishment of reported violations by the appropriate Compliance<br />
Officers and the E.ON Group’s Chief Compliance Officer.<br />
Violations of the Code of Conduct can also be reported anonymously<br />
(for example, by means of a whistleblower report).<br />
The most recent version of the Code of Conduct is published<br />
on the Internet at www.eon.<strong>com</strong>.<br />
CEO Letter<br />
E.ON Stock<br />
Combined Group Management <strong>Report</strong><br />
Consolidated Financial Statements<br />
Corporate Governance <strong>Report</strong><br />
Supervisory Board and Board of Management<br />
Tables and Explanations<br />
Description of the Functioning of the Board of<br />
Management and Supervisory Board and of the<br />
Composition and Functioning of Their Committees<br />
Board of Management<br />
The E.ON Board of Management manages the Company’s<br />
businesses, with all its members bearing joint responsibility<br />
for its decisions. It establishes the Company’s objectives,<br />
sets its fundamental strategic direction, and is responsible<br />
for corporate policy and Group organization.<br />
The Board of Management consists of six members and has one<br />
Chairperson. Board of Management members may not be<br />
older than 65. The Board of Management has in place policies<br />
and procedures for the business it conducts and, in consultation<br />
with the Supervisory Board, has assigned task areas to<br />
its members.<br />
The Board of Management regularly reports to the Supervisory<br />
Board on a timely and <strong>com</strong>prehensive basis on all relevant<br />
issues of corporate planning, business development, risk assessment,<br />
and risk management. It also submits the Group’s<br />
investment, finance, and personnel plan for the <strong>com</strong>ing fiscal<br />
year as well as the medium-term plan to the Supervisory Board<br />
for its approval at the last meeting of each financial year.<br />
The Chairperson of the Board of Management informs, without<br />
undue delay, the Chairperson of the Supervisory Board of<br />
important events that are of fundamental significance in<br />
assessing the Company’s situation, development, and management<br />
and of any defects that have arisen in the Company’s<br />
monitoring systems. Transactions and measures requiring the<br />
Supervisory Board’s approval are also submitted to the<br />
Supervisory Board without delay.<br />
Members of the Board of Management are also required to<br />
promptly report conflicts of interest to the Executive Committee<br />
of the Supervisory Board and to inform the other members<br />
of the Board of Management. Members of the Board of<br />
Management may only assume other corporate positions,<br />
particularly appointments to the supervisory boards of non-<br />
Group <strong>com</strong>panies, with the consent of the Executive Committee<br />
of the Supervisory Board. There were no conflicts of interest<br />
175
176 Corporate Governance <strong>Report</strong><br />
involving members of the Board of Management in <strong>2011</strong>. Any<br />
material transactions between the Company and members<br />
of the Board of Management, their relatives, or entities with<br />
which they have close personal ties require the consent of<br />
the Executive Committee of the Supervisory Board. No such<br />
transactions took place in <strong>2011</strong>.<br />
In addition, the Board of Management has established a<br />
number of <strong>com</strong>mittees that support it in the fulfillment of its<br />
tasks. The members of these <strong>com</strong>mittees are senior representatives<br />
of various departments of E.ON AG whose experience,<br />
responsibilities, and expertise make them particularly suited<br />
for their <strong>com</strong>mittee’s tasks.<br />
A Disclosure Committee supports the Board of Management<br />
on issues relating to financial disclosures and ensures that<br />
such information is disclosed in a correct and timely fashion.<br />
A Risk Committee ensures the correct application and implementation<br />
of the legal requirements of Paragraph 91 of the<br />
German Stock Corporation Act (“AktG”). This <strong>com</strong>mittee monitors<br />
the E.ON Group’s risk situation and devotes particular<br />
attention to the early warning system in order to recognize<br />
developments that could potentially threaten the Group’s<br />
continued existence. In collaboration with relevant departments<br />
and sub-departments, the <strong>com</strong>mittee ensures and refines the<br />
implementation of, and <strong>com</strong>pliance with, the reporting policies<br />
enacted by the Board of Management with regard to <strong>com</strong>modity<br />
risks, credit risks, and opportunities and risks pursuant<br />
to Germany’s Corporate Sector Control and Transparency Act<br />
(“KonTraG”).<br />
A Market Committee ensures that E.ON, across all its entities<br />
and in a timely manner, adopts clear and unequivocal policies<br />
and assigns clear mandates for monitoring market developments<br />
and managing its <strong>com</strong>modity portfolio (power, gas, coal,<br />
and so forth). These mandates provide the authority to make<br />
external transactions for the purpose of managing the portfolio’s<br />
risk-reward profile in pursuance of the E.ON Group’s<br />
financial and strategic objectives.<br />
Supervisory Board<br />
The Supervisory Board has 20 members and, in accordance<br />
with the German Codetermination Act, is <strong>com</strong>posed of an<br />
equal number of shareholder and employee representatives.<br />
The shareholder representatives are elected by the shareholders<br />
at the <strong>Annual</strong> Shareholders Meeting; the Supervisory<br />
Board nominates candidates for this purpose. The other ten<br />
members of the Supervisory Board are elected by employee<br />
delegates and must include seven employees and three<br />
trade-union representatives. Persons are not eligible as<br />
Supervisory Board members if they:<br />
• are already supervisory board members in ten or more<br />
<strong>com</strong>mercial <strong>com</strong>panies that are obliged by law to set up<br />
a supervisory board<br />
• are legal representatives of an enterprise controlled by<br />
the Company<br />
• are legal representatives of another corporation whose<br />
supervisory board includes a member of the Company’s<br />
Board of Management<br />
• were a member of the Company’s Board of Management<br />
in the past two years, unless the person concerned is<br />
nominated by shareholders who hold more than 25 percent<br />
of the Company’s voting rights.<br />
At least one independent member of the Supervisory Board<br />
must have expertise in preparing or auditing financial statements.<br />
The Supervisory Board determined that Werner Wenning<br />
and Dr. Theo Siegert meet this requirement.<br />
The Supervisory Board oversees the Company’s management<br />
and advises the Board of Management on an ongoing basis.<br />
The Board of Management requires the Supervisory Board’s<br />
prior approval for significant transactions or measures, such<br />
as the Group’s investment, finance, and personnel plans;<br />
the acquisition or sale of <strong>com</strong>panies, equity interests, or parts<br />
of <strong>com</strong>panies whose value exceeds 1 percent of stockholders’<br />
equity as shown in the most recent Consolidated Balance<br />
Sheets; financing measures that exceed the same value and<br />
have not been approved by it as part of the Company’s<br />
finance plan; and the conclusion, amendment, or termination<br />
of affiliation agreements. The Supervisory Board examines<br />
the Financial Statements of E.ON AG, the Management <strong>Report</strong>,<br />
and the proposal for appropriating in<strong>com</strong>e available for distribution<br />
and, on the basis of the Audit and Risk Committee’s<br />
preliminary review, the Consolidated Financial Statements and<br />
the Combined Group Management <strong>Report</strong>. The Supervisory<br />
Board provides to the <strong>Annual</strong> Shareholders Meeting a written<br />
report on the results of this examination.
The Supervisory Board has established policies and procedures<br />
for itself. It holds four regular meetings in each financial year.<br />
Its policies and procedures include mechanisms by which, if<br />
necessary, a meeting of the Supervisory Board can be called<br />
at any time by a member or by the Board of Management. In<br />
the event of a tie vote on the Supervisory Board, another<br />
vote is held; if there is still a tie, the Chairperson casts the<br />
tie-breaking vote.<br />
In view of Item 5.4.1 of the Code, in December 2010 the Supervisory<br />
Board defined targets for its <strong>com</strong>position that go<br />
beyond the applicable legal requirements. These targets are<br />
as follows:<br />
“The Supervisory Board’s <strong>com</strong>position should ensure that, on<br />
balance, its members have the necessary expertise, skills, and<br />
professional experience to discharge their duties properly. Each<br />
Supervisory Board member should have or acquire the minimum<br />
expertise and skills needed to be able to understand and<br />
assess on his or her own all the business transactions that<br />
may occur. The Supervisory Board should include a sufficient<br />
number of independent candidates; members are deemed<br />
independent if they do not have any business relationship with<br />
the Company or its Board of Management that constitutes a<br />
conflict of interest. The Supervisory Board should not include<br />
more than two former members of the Board of Management,<br />
and members of the Supervisory Board must not sit on the<br />
boards of, or act as consultants for, any of the Company’s major<br />
<strong>com</strong>petitors.<br />
Each Supervisory Board member must have sufficient time<br />
available to perform his or her duties on the boards of various<br />
E.ON <strong>com</strong>panies. Persons who are members of the board of<br />
management of a listed <strong>com</strong>pany shall therefore only be eligible<br />
as members of E.ON’s Supervisory Board if they do not<br />
sit on more than three supervisory boards of listed non-Group<br />
<strong>com</strong>panies or in <strong>com</strong>parable supervisory bodies of non-Group<br />
<strong>com</strong>panies.<br />
As a general rule, Supervisory Board members should not be<br />
older than 70.<br />
The key role of the Supervisory Board is to oversee and advise<br />
the Board of Management. Consequently, a majority of the<br />
shareholder representatives on the Supervisory Board should<br />
have experience as members of the board of management<br />
of a stock corporation or of a <strong>com</strong>parable <strong>com</strong>pany or association<br />
in order to discharge their duties in a qualified manner.<br />
CEO Letter<br />
E.ON Stock<br />
Combined Group Management <strong>Report</strong><br />
Consolidated Financial Statements<br />
Corporate Governance <strong>Report</strong><br />
Supervisory Board and Board of Management<br />
Tables and Explanations<br />
In addition, the Supervisory Board as a whole should have<br />
particular expertise in the energy sector and the E.ON Group’s<br />
business operations. Such expertise includes knowledge<br />
about the key markets in which the E.ON Group operates. Furthermore,<br />
the internal and external stakeholder groups (shareholders/investors,<br />
employees/unions, society/government) should<br />
be represented in the Supervisory Board.<br />
If the qualifications of several candidates for the Supervisory<br />
Board meet, to an equal degree, the general and <strong>com</strong>panyrelated<br />
requirements, the Supervisory Board intends to consider<br />
other criteria in its nomination of candidates in order to<br />
increase the Supervisory Board’s diversity.<br />
In view of the E.ON Group’s international orientation, the Supervisory<br />
Board should include a sufficient number of members<br />
who have spent, at a minimum, a significant part of their professional<br />
career abroad.<br />
In addition, the Supervisory Board aims to continually increase<br />
the number of women in the Supervisory Board. Currently, one<br />
shareholder representative and one employee representative<br />
are women. The Supervisory Board aims to double this number<br />
at the latest at its next regular election, which takes place in<br />
2013. It aims for 30 percent of Supervisory Board members to be<br />
women as of the regular election after that; this reflects the<br />
percentage of women employees in the E.ON Group.”<br />
These targets for the Supervisory Board’s <strong>com</strong>position were<br />
taken into consideration for the first time by the Nomination<br />
Committee and the full Supervisory Board’s re<strong>com</strong>mendations<br />
for the election of three shareholder representative<br />
Super visory Board members at the <strong>2011</strong> <strong>Annual</strong> Shareholders<br />
Meeting. The <strong>Annual</strong> Shareholders Meeting elected, by a<br />
large majority, the re<strong>com</strong>mended candidates: Baroness Denise<br />
Kingsmill, Bård Mikkelsen, and René Obermann. Baroness<br />
Denise Kingsmill’s membership on the United Kingdom’s Monopolies<br />
and Mergers Commission and her many successful<br />
years as an attorney give her extensive knowledge of energy<br />
markets and their <strong>com</strong>petitive and regulatory environment as<br />
well as broad political experience. René Obermann has<br />
177
178<br />
Corporate Governance <strong>Report</strong><br />
exceptional management experience from an industry in which<br />
regulation and <strong>com</strong>petition developed in a manner similar<br />
to that of the energy industry. Under his leadership, technological<br />
and business innovations for this industry were successfully<br />
developed and marketed. Bård Mikkelsen was for many<br />
years the Chief Executive Officer of Statkraft, a Norwegian<br />
energy supplier, and has deep knowledge of the European<br />
energy market, including renewables. The three new members<br />
add to the Supervisory Board’s international diversity. In<br />
addition, the Supervisory Board’s goal of doubling the number<br />
of its female members by 2013 was achieved for the shareholders<br />
side by <strong>2011</strong>. The targets for the Supervisory Board’s<br />
<strong>com</strong>position will be taken into consideration when proposing<br />
the shareholder representatives of the Supervisory Board in<br />
the process of the planned transformation of E.ON AG into a<br />
Societas Europaea (“SE”).<br />
In addition, under the Supervisory Board’s policies and procedures,<br />
Supervisory Board members are required to disclose<br />
to the Supervisory Board any conflicts of interest, particularly<br />
if a conflict arises from their advising, or holding a corporate<br />
office with, one of E.ON’s customers, suppliers, creditors, or other<br />
business partners. The Supervisory Board is required to report<br />
any conflicts of interest to the <strong>Annual</strong> Shareholders Meeting<br />
and to describe how the conflicts have been dealt with. Any<br />
material conflict of interest of a non-temporary nature should<br />
result in the termination of a member’s appointment to the<br />
Supervisory Board. There were no conflicts of interest involving<br />
members of the Supervisory Board in <strong>2011</strong>. Any consulting or<br />
other service agreements between the Company and a Supervisory<br />
Board member require the Supervisory Board’s consent.<br />
No such agreements existed in <strong>2011</strong>.<br />
The Supervisory Board has established the following <strong>com</strong>mittees<br />
and defined policies and procedures for them:<br />
The Mediation Committee required by Section 27, Paragraph 3,<br />
of the Codetermination Act consists of two shareholder-<br />
representative members and two employee-representative<br />
members. This <strong>com</strong>mittee is responsible for re<strong>com</strong>mending<br />
to the Supervisory Board potential candidates for the Board<br />
of Management if the first vote does not yield the necessary<br />
two-thirds majority of votes of Supervisory Board members.<br />
It therefore only meets when necessary.<br />
The Executive Committee consists of the four members of the<br />
above-named <strong>com</strong>mittee. It prepares the meetings of the<br />
Supervisory Board and advises the Board of Management on<br />
matters of general policy relating to the Company’s strategic<br />
development. In urgent cases (in other words, if waiting for the<br />
Supervisory Board’s prior approval would materially prejudice<br />
the Company), the Executive Committee acts on the full Supervisory<br />
Board’s behalf. In addition, a key Executive Committee<br />
task is to prepare the Supervisory Board’s personnel decisions<br />
and resolutions for setting the total <strong>com</strong>pensation of individual<br />
Board of Management members within the meaning of Section<br />
87 of AktG. Furthermore, it is responsible for the conclusion,<br />
alteration, and termination of the service agreements of<br />
Board of Management members and for presenting the Supervisory<br />
Board with a proposal for a resolution on the Board<br />
of Management’s <strong>com</strong>pensation plan including key elements<br />
of Board of Management service agreements. It also deals<br />
with corporate-governance matters and reports to the Supervisory<br />
Board at least once a year on the status and effectiveness<br />
of, and possible ways of improving, the Company’s corporate<br />
governance.<br />
The Audit and Risk Committee consists of four members who<br />
have special knowledge in the field of accounting and/or<br />
business administration. In line with Section 100, Paragraph<br />
5, of AktG and the Code’s mandates, the Chairperson has<br />
extensive knowledge and experience in applying accounting<br />
principles and/or in international business control processes.<br />
In particular, the Audit and Risk Committee monitors the Company’s<br />
accounting and the accounting process; the effectiveness<br />
of internal control systems, internal risk management, and<br />
the internal audit system; <strong>com</strong>pliance; and the independent<br />
audit. With regard to the independent audit, the <strong>com</strong>mittee also<br />
deals with the definition of the audit priorities and the agreement<br />
regarding the independent auditor’s fees. The Audit and<br />
Risk Committee also prepares the Supervisory Board’s decision<br />
on the approval of the Financial Statements of E.ON AG
and the Consolidated Financial Statements. It also examines<br />
the Company’s quarterly Interim <strong>Report</strong>s and discusses the<br />
audit review of the Interim <strong>Report</strong>s with the independent auditor<br />
and regularly reviews the Company’s risk situation and<br />
risk management. The effectiveness of the internal control<br />
mechanisms for the accounting process used at E.ON AG<br />
and the management units is tested on a regular basis by our<br />
Internal Audit division; the Audit and Risk Committee regularly<br />
monitors the work done by the Internal Audit division and<br />
the definition of audit priorities. In addition, the Audit and<br />
Risk Committee prepares the proposal on the selection of the<br />
Company’s independent auditor for the <strong>Annual</strong> Shareholders<br />
Meeting. In order to ensure the auditor’s independence, the<br />
Audit and Risk Committee secures a statement from the proposed<br />
auditors detailing any facts that could lead to the audit<br />
firm being excluded for independence reasons or otherwise<br />
conflicted.<br />
As part of its audit responsibilities, the independent auditor<br />
agrees to:<br />
• promptly inform the Chairperson of the Audit and Risk<br />
Committee should any such facts arise during the course<br />
of the audit<br />
• promptly inform the Supervisory Board of anything arising<br />
during the course of the audit that is of relevance to the<br />
Supervisory Board’s duties<br />
• inform the Chairperson of the Audit and Risk Committee<br />
of, or to note in the audit report, any facts that arise<br />
during the audit that contradict the statements submitted<br />
by the Board of Management or Supervisory Board in<br />
connection with the Code.<br />
The Finance and Investment Committee consists of six members.<br />
It advises the Board of Management on all issues of corporate<br />
finance and investment planning. It decides on behalf<br />
of the Supervisory Board on the approval of the acquisition<br />
and disposition of <strong>com</strong>panies, equity interests, and parts of<br />
<strong>com</strong>panies, as well as on finance measures whose value<br />
exceeds 1 percent of the equity listed in the Company’s most<br />
recent Consolidated Balance Sheet. If the value of any such<br />
transactions or activities exceeds 2.5 percent of the equity listed<br />
in the most recent Consolidated Balance Sheet, the Finance<br />
and Investment Committee prepares the Supervisory Board’s<br />
decision on such matters.<br />
CEO Letter<br />
E.ON Stock<br />
Combined Group Management <strong>Report</strong><br />
Consolidated Financial Statements<br />
Corporate Governance <strong>Report</strong><br />
Supervisory Board and Board of Management<br />
Tables and Explanations<br />
The Nomination Committee consists of three shareholderrepresentative<br />
members. Its Chairperson is the Chairperson<br />
of the Supervisory Board. Its task is to re<strong>com</strong>mend to the<br />
Supervisory Board suitable candidates for election to the<br />
Supervisory Board by the <strong>Annual</strong> Shareholders Meeting.<br />
All <strong>com</strong>mittees meet at regular intervals and when specific<br />
circumstances require it under their policies and procedures.<br />
The <strong>Report</strong> of the Supervisory Board (on pages 190 to 193)<br />
contains information about the activities of the Supervisory<br />
Board and its <strong>com</strong>mittees in the financial year under review.<br />
Pages 194 and 195 show the <strong>com</strong>position of the Supervisory<br />
Board and its <strong>com</strong>mittees.<br />
Shareholders and <strong>Annual</strong> Shareholders Meeting<br />
E.ON AG shareholders exercise their rights and vote their<br />
shares at the <strong>Annual</strong> Shareholders Meeting. The Company’s<br />
financial calendar, which is published in the <strong>Annual</strong> <strong>Report</strong>,<br />
in the quarterly Interim <strong>Report</strong>s, and on the Internet at<br />
www.eon.<strong>com</strong>, regularly informs shareholders about important<br />
Company dates.<br />
At the <strong>Annual</strong> Shareholders Meeting, shareholders may vote<br />
their shares themselves, through a proxy of their choice, or<br />
through a Company proxy who is required to follow the shareholder’s<br />
voting instructions.<br />
As stipulated by German law, the <strong>Annual</strong> Shareholders<br />
Meeting votes to select the Company’s independent auditor.<br />
179
180 Corporate Governance <strong>Report</strong><br />
Compensation <strong>Report</strong> pursuant to Section 289,<br />
Paragraph 2, Item 5 and Section 315, Paragraph 2,<br />
Item 4 of the German Commercial Code (Part of<br />
the Combined Group Management <strong>Report</strong>)<br />
This <strong>com</strong>pensation report describes the <strong>com</strong>pensation plan<br />
and the individual <strong>com</strong>pensation for E.ON AG’s Supervisory<br />
Board and Board of Management. It applies the regulations<br />
of the German Commercial Code and the German Stock Corporation<br />
Act (known by its German abbreviation, “AktG”) as<br />
amended to reflect the Act on the Appropriateness of Management<br />
Board Compensation (known by its German acronym,<br />
“VorstAG”) as well as the principles of the German Corporate<br />
Governance Code (“the Code”).<br />
Compensation Plan for Members of the Supervisory<br />
Board<br />
The <strong>com</strong>pensation of Supervisory Board members is determined<br />
by the <strong>Annual</strong> Shareholders Meeting and governed by<br />
E.ON AG’s Articles of Association. In accordance with German<br />
law, the <strong>com</strong>pensation plan takes into consideration Supervisory<br />
Board members’ responsibilities and scope of duties.<br />
The Supervisory Board’s <strong>com</strong>pensation plan was changed by<br />
a resolution of the <strong>Annual</strong> Shareholders Meeting on May 5, <strong>2011</strong>.<br />
Starting in the <strong>2011</strong> financial year, Supervisory Board members<br />
receive fixed <strong>com</strong>pensation only. Although this deviates from<br />
one of the Code’s re<strong>com</strong>mendations, it further enhances the<br />
independence necessary for the Supervisory Board to fulfill<br />
its supervisory function. In addition, there are a number of<br />
duties that Supervisory Board members must perform irrespective<br />
of the Company’s financial performance. The new plan<br />
ensures an appropriate level of <strong>com</strong>pensation even when the<br />
Company faces difficult times, since in such times the Supervisory<br />
Board’s work is often particularly demanding.<br />
The details of the proposed <strong>com</strong>pensation plan are as follows:<br />
In addition to being reimbursed for their expenses including<br />
the value-added tax due on their <strong>com</strong>pensation, Supervisory<br />
Board members receive fixed <strong>com</strong>pensation of €140,000 for<br />
each financial year. The Chairman of the Audit and Risk Committee<br />
receives an additional €180,000; the members of the<br />
Audit and Risk Committee, an additional €110,000. Other <strong>com</strong>mittee<br />
chairmen receive an additional €140,000; <strong>com</strong>mittee<br />
members, an additional €70,000. There is no additional <strong>com</strong>pensation<br />
for members of the Nomination Committee or of any<br />
<strong>com</strong>mittees formed on an ad hoc basis. Members serving on<br />
more than one <strong>com</strong>mittee receive the highest applicable<br />
<strong>com</strong>mittee <strong>com</strong>pensation only. In contradistinction to the <strong>com</strong>pensation<br />
just described, the Chairman of the Supervisory<br />
Board receives fixed <strong>com</strong>pensation of €440,000; the Deputy<br />
Chairman, €320,000,00. The Chairman and the Deputy Chairman<br />
of the Supervisory Board receive no additional <strong>com</strong>pensation<br />
for their <strong>com</strong>mittee duties. In addition, Supervisory<br />
Board members are paid an attendance fee of €1,000 per day<br />
for meetings of the Supervisory Board or its <strong>com</strong>mittees.<br />
Compensation is paid on a pro rata basis after the <strong>com</strong>pletion<br />
of each quarter.<br />
Individuals who were members of the Supervisory Board or<br />
any of its <strong>com</strong>mittees for less than an entire financial year<br />
receive pro rata <strong>com</strong>pensation.<br />
Finally, the Company has taken out D&O insurance for the<br />
benefit of Supervisory Board members to cover the statutory<br />
liability related to their Supervisory Board duties. In accordance<br />
with the Code’s re<strong>com</strong>mendations, this insurance includes<br />
a deductible in the case of a damage claim being granted. The<br />
deductible is 10 percent of a damage claim but with a maximum<br />
cumulative annual cap of 150 percent of a member’s<br />
annual fixed <strong>com</strong>pensation.
Compensation of the Members of the Supervisory<br />
Board<br />
The total <strong>com</strong>pensation of the members of the Supervisory<br />
Board amounted to €4.8 million (2009: €4.9 million). As in the<br />
prior year, no loans were outstanding or granted to Supervisory<br />
Board members in the <strong>2011</strong> financial year. The members<br />
of the Supervisory Board are listed on pages 194 and 195.<br />
CEO Letter<br />
E.ON Stock<br />
Combined Group Management <strong>Report</strong><br />
Consolidated Financial Statements<br />
Corporate Governance <strong>Report</strong><br />
Supervisory Board and Board of Management<br />
Tables and Explanations<br />
Supervisory Board Compensation for <strong>2011</strong><br />
Supervisory<br />
Board<br />
Supervisory Compensation <strong>com</strong>pensation<br />
Board for <strong>com</strong>mittee from affiliated<br />
€<br />
Compensation<br />
duties <strong>com</strong>panies1 Total<br />
Werner Wenning (Chairman since May 5, <strong>2011</strong>) 340,000 23,333 – 363,333<br />
Ulrich Hartmann (until May 5, <strong>2011</strong>) 183,333 – – 183,333<br />
Erhard Ott 320,000 – – 320,000<br />
Werner Bartoschek 140,000 110,000 38,000 288,000<br />
Sven Bergelin 140,000 – 61,220 201,220<br />
Oliver Biniek (since September 30, <strong>2011</strong>) 46,667 17,500 4,550 68,717<br />
Gabriele Gratz 140,000 70,000 56,000 266,000<br />
Wolf-Rüdiger Hinrichsen (until September 30, <strong>2011</strong>) 105,000 52,500 – 157,500<br />
Ulrich Hocker 140,000 – – 140,000<br />
Baroness Denise Kingsmill CBE (since May 5, <strong>2011</strong>) 93,333 – – 93,333<br />
Prof. Dr. Ulrich Lehner 140,000 70,000 – 210,000<br />
Bård Mikkelsen 140,000 – – 140,000<br />
René Obermann (since May 5, <strong>2011</strong>) 93,333 – – 93,333<br />
Hans Prüfer 140,000 70,000 – 210,000<br />
Klaus Dieter Raschke 140,000 110,000 46,870 296,870<br />
Dr. Walter Reitler 140,000 – 37,500 177,500<br />
Hubertus Schmoldt 140,000 – – 140,000<br />
Dr. Henning Schulte-Noelle 140,000 70,000 – 210,000<br />
Dr. Karen de Segundo 140,000 – – 140,000<br />
Dr. Theo Siegert 140,000 180,000 – 320,000<br />
Prof. Dr. Wilhelm Simson (until May 5, <strong>2011</strong>) 58,333 – – 58,333<br />
Dr. Georg Frhr. von Waldenfels 140,000 – – 140,000<br />
Hans Wollitzer 140,000 70,000 58,900 268,900<br />
Subtotal 3,339,999 843,333 303,040 4,486,372<br />
Attendance fees and meeting-related reimbursements 287,378<br />
Total 4,773,750<br />
1 Following the adoption of an expense-based approach, this column only shows <strong>com</strong>pensation for the <strong>2011</strong> financial year. Mrs. Gratz and Mr. Bartoschek received €76,055 and<br />
€54,836 from E.ON subsidiaries, respectively, for Supervisory Board duties in 2010.<br />
181
182 Corporate Governance <strong>Report</strong><br />
Compensation Plan for Members of the Board of<br />
Management<br />
In accordance with the principles of the version of the Code<br />
dated May 26, 2010, which incorporates VorstAG’s provisions<br />
and in some cases defines them in greater detail, the Supervisory<br />
Board must approve the Executive Committee’s proposal<br />
for the Board of Management’s <strong>com</strong>pensation plan and<br />
reviews the plan regularly.<br />
At its meeting on March 8, <strong>2011</strong>, the Supervisory Board passed<br />
a resolution approving the <strong>com</strong>pensation plan described below.<br />
Components of the Compensation Plan<br />
The <strong>com</strong>pensation of Board of Management members is <strong>com</strong>posed<br />
of a fixed annual base salary paid on a monthly basis,<br />
an annual bonus, and a long-term variable <strong>com</strong>ponent.<br />
These <strong>com</strong>ponents account for approximately the following<br />
percentages of total <strong>com</strong>pensation:<br />
• Base salary 30 percent<br />
• <strong>Annual</strong> target bonus<br />
(with 100% target attainment) 40 percent<br />
• Long-term <strong>com</strong>pensation<br />
(value at issuance) 30 percent<br />
<strong>Annual</strong> Bonus<br />
The annual bonus mechanism for the year under review was<br />
established by a resolution of the Supervisory Board dated<br />
March 8, <strong>2011</strong>, and took effect on January 1, <strong>2011</strong>. Section 87 of<br />
the VorstAG version of the AktG requires that a management<br />
board’s <strong>com</strong>pensation package must be geared towards a sustainable<br />
business performance. To implement this requirement,<br />
the Supervisory Board and Board of Management members<br />
agreed in 2009 that the Board of Management’s annual<br />
bonus mechanism would adopt a multi-year performance metric<br />
effective 2010. This modification affects the <strong>com</strong>pany performance<br />
portion of the annual bonus.<br />
The amount of the bonus is determined by the degree to<br />
which certain performance targets are attained. The targetsetting<br />
system consists of <strong>com</strong>pany performance targets,<br />
individual performance targets, and a value-added factor based<br />
on return on average capital employed (“ROACE”). Board of<br />
Management members who fully attain their performance<br />
target receive the target bonus agreed to in their contracts.<br />
The first step in calculating the total annual bonus is to<br />
determine to what degree the operating-earnings target has<br />
been attained. The second step is for the Supervisory Board, at<br />
its discretion, to determine the degree to which the individualperformance<br />
portion of the annual bonus has been attained.<br />
The third step is for both target-attainment portions to be<br />
weighted (70 percent operating-earnings target, 30 percent for<br />
the individual-performance target) and added together. Finally,<br />
this subtotal is multiplied by a value-added factor.<br />
The metric used for the operating-earnings target is EBITDA.<br />
The EBITDA target for a particular financial year is the plan<br />
figure approved by the Supervisory Board. If E.ON’s actual<br />
EBITDA is equal to the EBITDA target, this constitutes<br />
100-percent attainment. If it is 30 percentage points or more<br />
below the target, this constitutes 0-percent achievement.<br />
If it is 30 percentage points or more above the target, this<br />
constitutes 200-percent attainment. Linear interpolation is<br />
used to translate intermediate EBITDA figures into percentages.<br />
The metric used for the value-added target is ROACE. The<br />
ROACE target is the prior-year weighted-average cost of capital<br />
(“WACC”) plus a premium, stipulated by the Supervisory<br />
Board, to increase leverage. The premium for the <strong>2011</strong> financial<br />
year was 2 percentage points. In view of altered long-term<br />
returns expectations for much of the energy industry and for<br />
E.ON (particularly because of the forced shutdown of some<br />
nuclear power stations in Germany and the altered regulatory<br />
environment), the Supervisory Board resolved to set the<br />
premium at 1.25 percentage points beginning with the 2012<br />
financial year. If E.ON’s actual ROACE is equal to the ROACE<br />
target, this constitutes 100-percent attainment. If it is 2 (effective<br />
2012: 1.25) percentage points or more lower, this constitutes<br />
50-percent attainment. If it is 2 (effective 2012: 1.25) percentage<br />
points or more higher, this constitutes 150-percent<br />
attainment. Linear interpolation is used to translate intermediate<br />
ROACE figures into percentages.<br />
Extraordinary events and changes in E.ON’s portfolio (acquisitions<br />
and disposals of significant assets or government<br />
interventions such as the forced shutdown of some nuclear<br />
power stations in Germany) are not factored into the determination<br />
of target attainment.
The Supervisory Board, at its discretion, determines the<br />
degree to which Board of Management members have met<br />
the targets of the individual-performance portion of their<br />
annual bonus. In making this determination, the Supervisory<br />
Board pays particular attention to the criteria of Section 87<br />
of the AktG and to the Code.<br />
The maximum bonus that can be attained is 200 percent of the<br />
target bonus. The minimum bonus paid is equal to 30 percent<br />
of the target bonus (except in the case of Mrs. Stachelhaus<br />
and Mr. Kildahl, who were appointed to the Board of Management<br />
in 2010).<br />
Thirty percent of the total annual bonus (individual target<br />
attainment multiplied by the value-added factor) is based on<br />
target achievement for the prior financial year (a single-year<br />
performance metric). The remaining 70 percent of the total<br />
annual bonus (EBITDA target attainment multiplied by the<br />
value-added factor) is calculated as follows: Half (that is, 35 percent<br />
of the total annual bonus) is based on the prior financial<br />
year. The other half (that is, the other 35 percent of the total<br />
annual bonus) is a three-year performance metric based on<br />
EBITDA target attainment and the value-added factor for the<br />
previous financial year and the two subsequent years. This<br />
portion of the annual bonus will be calculated and paid out<br />
based on target attainment for the previous financial year.<br />
However, this portion of the bonus is preliminary and is subject<br />
to partial repayment if there are negative developments in<br />
the subsequent years. This portion of the annual bonus is definitively<br />
set at the end of the two-year period following the<br />
baseline year. If the three-year average for target attainment<br />
is higher than the preliminary calculation for the one-year<br />
period, then Board of Management members receive an additional<br />
bonus payment (bonus). If it is lower, they are required<br />
to pay back the resulting difference or have it deducted from<br />
their next bonus (malus or negative bonus).<br />
Since 2010, more than 60 percent of the Board of Management’s<br />
variable <strong>com</strong>pensation (which consists of the annual bonus<br />
and long-term variable <strong>com</strong>pensation) is based on long-term<br />
performance metrics, thereby ensuring that this variable<br />
<strong>com</strong>pensation is sustainable. The sustainability requirement<br />
is also reflected by the fact that the Supervisory Board considers<br />
the criteria of Section 87 of the AktG and the Code when<br />
it determines the individual performance portion of the<br />
annual bonus.<br />
CEO Letter<br />
E.ON Stock<br />
Combined Group Management <strong>Report</strong><br />
Consolidated Financial Statements<br />
Corporate Governance <strong>Report</strong><br />
Supervisory Board and Board of Management<br />
Tables and Explanations<br />
Long-Term Variable Compensation<br />
The long-term variable <strong>com</strong>pensation <strong>com</strong>ponent that Board<br />
of Management members receive is stock-based <strong>com</strong>pensation<br />
under the E.ON Share Performance Plan. The Supervisory<br />
Board decides each year on the allocation of new tranches,<br />
including the respective targets and the number of rights<br />
granted to individual members of the Board of Management.<br />
To ensure that this <strong>com</strong>pensation is sustainable within the<br />
meaning of VorstAG, all performance rights allocated under<br />
the plan since 2010 have a vesting period of four years.<br />
The dependence of this <strong>com</strong>pensation on E.ON’s stock price<br />
serves to bring together management’s and shareholders’<br />
interests and objectives. This effect is enhanced by the requirement<br />
that Board of Management members have to invest in<br />
E.ON stock themselves. The factoring in of an internal valueadded<br />
factor underscores the plan’s close alignment with<br />
the Company’s interests. Payout under the plan only occurs if<br />
minimum internal target parameters, which are set by the<br />
Supervisory Board prior to allocation, are achieved.<br />
Starting with the sixth tranche of performance rights allocated<br />
in <strong>2011</strong>, the value of performance rights is based in part on a<br />
60-day average of E.ON’s stock price and in part on the average<br />
ratio of ROACE to WACC plus, per tranche, a premium stipulated<br />
by the Supervisory Board. If this hurdle is not reached, the<br />
value-added factor is 0 percent, and there is no payout. If<br />
the hurdle is reached, the value-added factor is 75 percent. If<br />
the hurdle is exceeded, a linear function is used to calculate the<br />
value-added factor, which is limited to a 150-percent maximum.<br />
Extraordinary events and changes in E.ON’s portfolio (acquisitions<br />
and disposals of significant assets or government<br />
interventions such as the forced shutdown of some nuclear<br />
power stations in Germany) are not factored into the determination<br />
of the value-added factor.<br />
183
184 Corporate Governance <strong>Report</strong><br />
The payout rate calculated at the end of a tranche’s term is<br />
capped at 250 percent of the target value originally set by<br />
the Supervisory Board.<br />
At the time of the payout of the fourth tranche (issued in 2009),<br />
which expired in <strong>2011</strong>, the payout rate was roughly 4 percent<br />
of the target value at grant. The figures for prior tranches are<br />
roughly 23 percent for the third tranche (issued in 2008) and<br />
roughly 94 percent for the second tranche (issued in 2007). This<br />
reflects, in particular, the absolute and relative changes in the<br />
price of E.ON stock, with the result that the Board of Management’s<br />
<strong>com</strong>pensation is affected by changes in E.ON’s market<br />
value.<br />
The Supervisory Board made a decision regarding the seventh<br />
tranche and its target parameters. In view of E.ON’s altered<br />
long-term returns expectations, the Supervisory Board also<br />
passed a resolution to lower the premium for the sixth<br />
tranche which had been set in the prior year. However, this<br />
change does not apply to the first year of the sixth tranche’s<br />
term. An explanation of the deviation from the Code was<br />
published on the Company’s website. The caps on the valueadded<br />
factor and the payout amount remain unchanged.<br />
Note 11 to the Consolidated Financial Statements contains<br />
additional details about stock-based <strong>com</strong>pensation.<br />
Contractual Non-cash Compensation<br />
Under their contracts, Board of Management members receive<br />
non-cash <strong>com</strong>pensation in the form of a chauffeur-driven<br />
<strong>com</strong>pany car for business and personal use, tele<strong>com</strong>munications<br />
equipment for business and personal use, appropriate<br />
accident insurance coverage, and an annual medical examination.<br />
In addition, Board of Management members have D&O<br />
insurance coverage. If an insurance claim is granted, this<br />
insurance includes a deductible. In accordance with VorstAG,<br />
the deductible is equal to 10 percent of a damage claim but<br />
with a maximum cumulative annual cap of 150 percent of a<br />
member’s annual fixed <strong>com</strong>pensation.<br />
Settlement Cap for Premature Termination of Board<br />
of Management Duties<br />
In accordance with the Code, all Board of Management members<br />
have a settlement cap. Under the cap, payments to a<br />
Board of Management member for a premature termination<br />
of Board of Management duties without significant cause<br />
within the meaning of Section 626 of the German Civil Code<br />
may not exceed the value of two years’ total <strong>com</strong>pensation<br />
or the total <strong>com</strong>pensation for the remainder of the member’s<br />
service agreement, whichever is less.<br />
Change-in-Control Clauses<br />
The Company had change-in-control agreements with all Board<br />
of Management members in the <strong>2011</strong> financial year. In the<br />
event of a premature loss of a Board of Management position<br />
due to a change-in-control event, Board of Management<br />
members are entitled to severance and settlement payments.<br />
The change-in-control agreements stipulate that a change in<br />
control exists in three cases: a third party acquires at least<br />
30 percent of the Company’s voting rights, thus triggering the<br />
automatic requirement to make an offer for the Company<br />
pursuant to Germany’s Stock Corporation Takeover Law; the<br />
Company, as a dependent entity, concludes a corporate<br />
agreement; the Company is merged with another <strong>com</strong>pany.<br />
A Board of Management member is entitled to severance<br />
and settlement pay if, within 12 months of the change in control,<br />
his or her service agreement is terminated by mutual<br />
consent, expires, or is terminated by the Board member (in the<br />
latter case, however, only if his or her position on the Board<br />
is materially affected by the change in control).<br />
In accordance with the Code, the settlement payments for<br />
Board of Management members would be equal to 150 percent<br />
of the settlement cap; that is, the capitalized amount of three<br />
years’ total annual <strong>com</strong>pensation (annual base salary, annual<br />
target bonus, and other <strong>com</strong>pensation). To reflect discounting<br />
and setting off of payment for services rendered to other <strong>com</strong>panies<br />
or organizations, payments will be reduced by 20 percent.<br />
If a Board of Management member is above the age of<br />
53, this 20-percent reduction is diminished incrementally.<br />
Pension Entitlements<br />
Mr. Kildahl and Mrs. Stachelhaus, who were not part of the<br />
E.ON Group when they were appointed to the Board of<br />
Management in 2010, were enrolled in the Contribution Plan<br />
E.ON Management Board, a contribution-based pension plan<br />
whose terms (with the exception of the contribution amount)<br />
reflect those of the pension plan that has been in effect since<br />
2008 for newly hired employees and senior managers of E.ON<br />
<strong>com</strong>panies in Germany. Under the Contribution Plan E.ON Management<br />
Board, the Company contributes to Board of Management<br />
members’ pension account. The amount of the annual<br />
contributions is equal to a predetermined percentage of pensionable<br />
in<strong>com</strong>e (base salary and annual bonus). The percentage<br />
for Board of Management members was set after consultations<br />
with outside <strong>com</strong>pensation experts. The annual <strong>com</strong>pany<br />
contribution is equal to 13 percent of pensionable in<strong>com</strong>e.<br />
The second <strong>com</strong>ponent of the <strong>com</strong>pany contribution is a performance-based<br />
contribution based on the difference between
the E.ON Group’s ROCE and prior-year cost of capital. The<br />
performance-based <strong>com</strong>pany contribution is a minimum of<br />
1 percent and a maximum of 6 percent of pensionable in<strong>com</strong>e.<br />
The third <strong>com</strong>ponent is an annual matching contribution<br />
equal to 4 percent of pensionable in<strong>com</strong>e. The requirement<br />
for the matching contribution to be granted is that the Board<br />
of Management member contributes, at a minimum, the same<br />
amount by having it withheld from his or her <strong>com</strong>pensation.<br />
The <strong>com</strong>pany-funded matching contribution is suspended if<br />
and as long as, for the last three years, the positive difference<br />
between the E.ON Group’s ROCE and prior-year cost of capital<br />
is less than 0 percentage points. The contributions made for<br />
a Board of Management member during a calendar year are<br />
capitalized based on a standard retirement age of 62 using,<br />
for each intervening year, an interest rate based on the return<br />
of long-term German treasury notes. At the time of pension<br />
payout, a Board of Management member (or his or her survivors)<br />
may choose to have the pension account balance paid<br />
out as a lifelong pension, in installments, or in a lump sum. In<br />
the case of retirement, the monthly pension is set so that<br />
its cash value at the time of pension payout—at the earliest,<br />
however, at the time that a Board of Management member<br />
or his or her survivors stop receiving <strong>com</strong>pensation under his<br />
or her service agreement—is equal to the pension account<br />
balance taking into account a 1-percent increase per year.<br />
The following <strong>com</strong>mentary applies to the pension entitlements<br />
of Dr. Teyssen, Prof. Dr. Maubach, Dr. Schenck, and<br />
Dr. Reutersberg:<br />
Following the end of their service for the Company, these<br />
Board of Management members are entitled to receive pension<br />
payments in three cases: departure on and after reaching<br />
the standard retirement age (60 years); departure due to permanent<br />
incapacitation; departure due to their service agreement<br />
being terminated prematurely or not extended by the<br />
Company (a so-called third pension situation).<br />
In the first two cases (reaching the standard retirement<br />
age, permanent incapacitation), pension payments begin when<br />
a member departs the Board of Management for one of<br />
these reasons; annual pension payments are equal to between<br />
50 percent and 75 percent of the member’s last annual base<br />
salary depending on the length of service on the Board of<br />
Management.<br />
In the third case, annual pension payments also range<br />
between 50 percent and 75 percent of the last annual base<br />
salary and begin when the member reaches the age of 60.<br />
Members who depart the Board of Management in this way<br />
receive a reduced pension as a bridge payment from the<br />
CEO Letter<br />
E.ON Stock<br />
Combined Group Management <strong>Report</strong><br />
Consolidated Financial Statements<br />
Corporate Governance <strong>Report</strong><br />
Supervisory Board and Board of Management<br />
Tables and Explanations<br />
date of their departure until they reach the age of 60 if they<br />
had, at the time of their departure, been in a Top Management<br />
position in the E.ON Group for more than five years and<br />
if the termination or non-extension of their service agreement<br />
is not due to their misconduct or rejection of an offer of<br />
extension that is at least on a par with their existing service<br />
agreement. The amount of the bridge payment is also initially<br />
between 50 percent and 75 percent of the last annual base<br />
salary based on the length of service on the Board of Management.<br />
This amount is then reduced by the ratio between<br />
the actual and potential length of service in a Top Management<br />
position in the E.ON Group until the standard retirement<br />
age. In contrast to this, the service agreements the Company<br />
concluded before the 2006 financial year do not include reductions<br />
to the bridge payment.<br />
If a recipient of pension payments (or bridge payments) is<br />
entitled to pension payments or bridge payments stemming<br />
from earlier employment, 100 percent of these payments will<br />
be set off against his or her pension or bridge payments from<br />
the Company. In addition, 50 percent of in<strong>com</strong>e from other<br />
employment will be set off against bridge payments.<br />
Pension payments are adjusted on an annual basis to reflect<br />
changes in the German consumer price index.<br />
Following the death of an active or former Board of Management<br />
member, a reduced amount of his or her pension is paid<br />
as a survivor’s pension to the family. Widows and widowers<br />
are entitled to lifelong payment equal to 60 percent of the<br />
pension a Board of Management member received on the date<br />
of his or her death or would have received had he or she<br />
entered retirement on this date. This payment is terminated<br />
if a widow or widower remarries. The children or dependents<br />
of a Board of Management member who have not reached<br />
the age of 18 are entitled, for the duration of their education<br />
or professional training until they reach a maximum age of<br />
25, to an annual payment equal to 20 percent of the pension<br />
the Board of Management member received or would have<br />
received on the date of his or her death. Surviving children<br />
benefits granted before 2006 deviate from this model and<br />
are equal to 15 percent of a Board of Management member’s<br />
pension. If, taken together, the survivor’s pensions of the<br />
widow or widower and children exceed 100 percent of a Board<br />
of Management member’s pension, the pensions paid to the<br />
children are proportionally reduced by the excess amount.<br />
185
186 Corporate Governance <strong>Report</strong><br />
The following table provides an overview of the current pension<br />
obligations to Board of Management members. The table<br />
also includes the additions to provisions for pensions for<br />
each member. These additions to provisions for pensions are<br />
not paid <strong>com</strong>pensation but valuations calculated in accordance<br />
with IFRS. In addition, the cash value of pension obligations<br />
is shown in the following table. The cash value is equal to the<br />
defined benefit obligation based on a 4.75-percent interest<br />
rate (2010: 5 percent).<br />
Pensions of the Board of Management Members for <strong>2011</strong><br />
Current pension entitlement at<br />
December 31, <strong>2011</strong><br />
Pursuant to stipulations of the German Occupational Pensions<br />
Improvement Act (known by its German acronym, “BetrAVG”),<br />
Board of Management members’ pension entitlements are<br />
not vested until they have been in effect for five years. This<br />
applies to both of the above-described pension plans.<br />
As a percentage<br />
of annual<br />
base salary (€) (€)<br />
Additions to provisions for pensions<br />
in <strong>2011</strong><br />
Cash value at<br />
December 31,<br />
<strong>2011</strong><br />
Thereof interest<br />
cost (€) (€)<br />
Dr. Johannes Teyssen 75 930,000 938,358 481,073 11,726,545<br />
Jørgen Kildahl1 – – 296,708 10,475 534,129<br />
Prof. Dr. Klaus-Dieter Maubach 60 420,000 473,220 150,244 4,334,327<br />
Dr. Bernhard Reutersberg 70 490,000 964,546 340,549 7,795,387<br />
Dr. Marcus Schenck 60 540,000 533,927 88,155 2,808,202<br />
Regine Stachelhaus1 – – 311,832 10,926 516,027<br />
1 Contribution Plan E.ON Management Board.<br />
Pensions of the Board of Management Members for 2010<br />
Current pension entitlement at<br />
December 31, 2010<br />
As a percentage<br />
of annual<br />
base salary (€) (€)<br />
Additions to provisions for pensions<br />
in 2010<br />
Cash value at<br />
December 31,<br />
2010<br />
Thereof interest<br />
cost (€) (€)<br />
Dr. Wulf H. Bernotat (until April 30, 2010) 1 – – 536,953 536,953 13,581,803<br />
Dr. Johannes Teyssen 70 784,000 758,605 397,322 9,621,462<br />
Christoph Dänzer-Vanotti (until May 12, 2010) 50 375,000 472,738 173,020 5,171,717<br />
Lutz Feldmann (until May 12, 2010) 60 450,000 263,869 195,644 2,854,189<br />
Jørgen Kildahl (since May 13, 2010) 2 – – 209,495 – 209,495<br />
Prof. Dr. Klaus-Dieter Maubach (since May 13, 2010) 50 350,000 280,475 88,180 3,004,887<br />
Dr. Bernhard Reutersberg (since August 11, 2010) 60 420,000 379,517 56,323 6,810,972<br />
Dr. Marcus Schenck 50 375,000 439,221 62,014 1,763,103<br />
Regine Stachelhaus (since June 24, 2010) 2 – – 218,524 – 218,524<br />
1 Entered retirement on May 1, 2010.<br />
2 Contribution Plan E.ON Management Board.
Compensation of the Members of the Board of<br />
Management<br />
There was no general adjustment of Board of Management<br />
<strong>com</strong>pensation in <strong>2011</strong>. At its meeting on March 8, <strong>2011</strong>, the<br />
Supervisory Board passed a resolution to adjust the <strong>com</strong>pensation<br />
of Dr. Teyssen and Dr. Schenck effective September 1, <strong>2011</strong>.<br />
The Supervisory Board determined that the Board of Management’s<br />
<strong>com</strong>pensation is appropriate. In accordance with<br />
VorstAG’s provisions, the Supervisory Board made this determination<br />
in particular by means of horizontal <strong>com</strong>parisons.<br />
The figures for performance rights granted do not indicate<br />
actual payments in <strong>2011</strong> but rather indicate values, based on<br />
<strong>com</strong>mercial principles, of the performance rights granted in<br />
<strong>2011</strong>. The payout of the performance rights from the sixth<br />
tranche will be calculated at the end of 2014 on the basis of<br />
E.ON’s stock price and the value-added factor. As a result,<br />
the payout figures could be higher or lower than the figures<br />
shown here.<br />
CEO Letter<br />
E.ON Stock<br />
Combined Group Management <strong>Report</strong><br />
Consolidated Financial Statements<br />
Corporate Governance <strong>Report</strong><br />
Supervisory Board and Board of Management<br />
Tables and Explanations<br />
The Board of Management’s <strong>com</strong>pensation was subject to a<br />
market <strong>com</strong>parison with <strong>com</strong>pensation at <strong>com</strong>panies of similar<br />
size and in similar industries.<br />
The total <strong>com</strong>pensation of the members of the Board of Management<br />
in the <strong>2011</strong> financial year amounted to €17.6 million<br />
(2010: €15.4 million). Individual members of the Board of Management<br />
were paid the following total <strong>com</strong>pensation:<br />
Compensation of the Board of Management for <strong>2011</strong><br />
Value of the<br />
Number of<br />
6th tranche<br />
6th tranche<br />
Fixed annual<br />
Other of perfor-<br />
performance<br />
<strong>com</strong>pen<strong>com</strong>penmance<br />
rights<br />
rights<br />
€<br />
sation Bonus sation granted Total granted<br />
Dr. Johannes Teyssen 1,160,000 2,143,000 27,425 1,212,186 4,542,611 60,188<br />
Jørgen Kildahl 700,000 1,032,000 247,796 538,745 2,518,541 26,750<br />
Prof. Dr. Klaus-Dieter Maubach 700,000 1,016,000 448,843 538,745 2,703,588 26,750<br />
Dr. Bernhard Reutersberg 700,000 1,130,000 24,041 538,745 2,392,786 26,750<br />
Dr. Marcus Schenck 800,000 1,548,000 23,724 718,333 3,090,057 35,667<br />
Regine Stachelhaus 700,000 1,016,000 59,852 538,745 2,314,597 26,750<br />
Total 4,760,000 7,885,000 831,681 4,085,499 17,562,180 202,855<br />
To indicate how the <strong>com</strong>pensation plan works, the table below<br />
shows Board of Management members’ <strong>com</strong>pensation for<br />
<strong>2011</strong> including the amounts calculated from the settlement<br />
at year-end <strong>2011</strong> of the fourth tranche of the E.ON Share Performance<br />
Plan granted in 2009 (see the 2009 Compensation<br />
<strong>Report</strong>, page 154).<br />
Effective <strong>com</strong>pensation of the Board of Management for <strong>2011</strong><br />
Fixed annual<br />
Other<br />
Payout value<br />
of the<br />
4th tranche<br />
<strong>com</strong>pen<strong>com</strong>pen-<br />
of perfor-<br />
€<br />
sation Bonus sationmance rights Total<br />
Dr. Johannes Teyssen 1,160,000 2,143,000 27,425 43,494 3,373,919<br />
Jørgen Kildahl 700,000 1,032,000 247,796 – 1,979,796<br />
Prof. Dr. Klaus-Dieter Maubach 700,000 1,016,000 448,843 13,453 2,178,296<br />
Dr. Bernhard Reutersberg 700,000 1,130,000 24,041 12,139 1,866,180<br />
Dr. Marcus Schenck 800,000 1,548,000 23,724 32,368 2,404,092<br />
Regine Stachelhaus 700,000 1,016,000 59,852 – 1,775,852<br />
Total 4,760,000 7,885,000 831,681 101,454 13,578,135<br />
187
188 Corporate Governance <strong>Report</strong><br />
Compensation of the Board of Management for 2010<br />
Value of the<br />
Number of<br />
5th tranche<br />
5th tranche<br />
Fixed annual<br />
Other of perfor-<br />
performance<br />
<strong>com</strong>pen<strong>com</strong>penmance<br />
rights<br />
rights<br />
€<br />
sation Bonus sation granted Total granted<br />
Dr. Wulf H. Bernotat (until April 30, 2010) 413,333 600,000 7,450 306,170 1,326,953 16,514<br />
Dr. Johannes Teyssen 1,080,000 2,337,000 27,966 793,772 4,238,738 42,814<br />
Christoph Dänzer-Vanotti (until May 12, 2010) 274,194 402,150 6,300 435,449 1,118,093 23,487<br />
Lutz Feldmann (until May 12, 2010) 274,194 402,150 11,558 435,449 1,123,351 23,487<br />
Jørgen Kildahl (since May 13, 2010)<br />
Prof. Dr. Klaus-Dieter Maubach<br />
444,444 686,000 48,006 272,149 1,450,599 14,679<br />
(since May 13, 2010)<br />
Dr. Bernhard Reutersberg<br />
421,213 786,000 60,379 34,021 1,301,613 1,835<br />
(since August 11, 2010) 273,106 421,000 9,847 34,021 737,974 1,835<br />
Dr. Marcus Schenck 750,000 1,530,000 26,351 544,297 2,850,648 29,358<br />
Regine Stachelhaus (since June 24, 2010) 363,258 563,000 31,964 272,149 1,230,371 14,679<br />
Total 4,293,742 7,727,300 229,821 3,127,477 15,378,340 168,688<br />
The above figures show the <strong>com</strong>pensation of members who<br />
ended their service on, or joined, the Board of Management<br />
in 2010 on a pro rata basis reflecting the percentage of the year<br />
they were on the Board of Management.<br />
To indicate how the <strong>com</strong>pensation plan works, the table below<br />
shows Board of Management members’ <strong>com</strong>pensation for<br />
2010 including the amounts paid out from the settlement of the<br />
third tranche of the E.ON Share Performance Plan granted in<br />
2008 (see the 2008 Compensation <strong>Report</strong>, page 153).<br />
Effective <strong>com</strong>pensation of the Board of Management for 2010<br />
Fixed annual<br />
Other<br />
Payout value<br />
of the<br />
3th tranche<br />
<strong>com</strong>pen<strong>com</strong>pen-<br />
of perfor-<br />
€<br />
sation Bonus sationmance rights Total<br />
Dr. Wulf H. Bernotat (until April 30, 2010) 413,333 600,000 7,450 689,7951 1,710,578<br />
Dr. Johannes Teyssen 1,080,000 2,337,000 27,966 238,071 3,683,037<br />
Christoph Dänzer-Vanotti (until May 12, 2010) 274,194 402,150 6,300 185,085 867,729<br />
Lutz Feldmann (until May 12, 2010) 274,194 402,150 11,558 394,8331 1,082,735<br />
Jørgen Kildahl (since May 13, 2010) 444,444 686,000 48,006 – 1,178,450<br />
Prof. Dr. Klaus-Dieter Maubach (since May 13, 2010) 421,213 786,000 60,379 64,774 1,332,366<br />
Dr. Bernhard Reutersberg (since August 11, 2010) 273,106 421,000 9,847 63,639 767,592<br />
Dr. Marcus Schenck 750,000 1,530,000 26,351 185,085 2,491,436<br />
Regine Stachelhaus (since June 24, 2010) 363,258 563,000 31,964 – 958,222<br />
Total 4,293,742 7,727,300 229,821 1,821,282 14,072,145<br />
1 Extraordinary payment.
The remaining other <strong>com</strong>pensation of the members of the<br />
Board of Management consists primarily of benefits in kind<br />
from the personal use of <strong>com</strong>pany cars and, in some cases,<br />
temporary coverage of rent payments for a second residence,<br />
relocation costs, and real-estate agent fees along with the<br />
in<strong>com</strong>e tax levied on this <strong>com</strong>pensation.<br />
Following the adjustment of the premium (the Company’s<br />
website contains an explanation of how this deviates from<br />
the Code), stock-based <strong>com</strong>pensation with a value of €20.14<br />
(according to Section 314, Paragraph 1, Item 6a of the German<br />
Commercial Code) per performance right from the sixth<br />
tranche was included in Board of Management members’ total<br />
<strong>com</strong>pensation for <strong>2011</strong>. For purposes of internal <strong>com</strong>munications<br />
between the Board of Management and the Supervisory<br />
Board, the target value is used instead of the above-mentioned<br />
value. The target value is equal to the cash payout amount<br />
of each performance right if at the end of the vesting period<br />
E.ON stock maintains its price and the value-added factor is<br />
100 percent. In <strong>2011</strong>, the target value of the rights issued was<br />
€1,350,000 for the Chairman of the Board of Management,<br />
€0.8 million for Dr. Schenck, and €0.6 million for all other Board<br />
of Management members. The German Commercial Code<br />
(Section 314, Paragraph 1, Item 6a, Sentence 9) requires supplemental<br />
disclosure, by year, of the Company’s expenses for all<br />
CEO Letter<br />
E.ON Stock<br />
Combined Group Management <strong>Report</strong><br />
Consolidated Financial Statements<br />
Corporate Governance <strong>Report</strong><br />
Supervisory Board and Board of Management<br />
Tables and Explanations<br />
tranches granted in <strong>2011</strong> and in previous years and for tranches<br />
existing in <strong>2011</strong>. The following expenses in accordance<br />
with IFRS 2 were recorded for performance rights existing in<br />
the <strong>2011</strong> financial year (figures are approximate): Dr. Teyssen<br />
€86,000, Mr. Kildahl €128,000, Mrs. Stachelhaus €128,000,<br />
Prof. Dr. Maubach €136,000, Dr. Reutersberg €136,000, and<br />
Dr. Schenck €19,000.<br />
Additional information about E.ON AG’s stock-based <strong>com</strong>pensation<br />
program can be found in Note 11 to the Consolidated<br />
Financial Statements. As in the prior year, no loans were outstanding<br />
or granted to members of the Board of Management<br />
in <strong>2011</strong> financial year. Page 203 contains additional information<br />
about the members of the Board of Management.<br />
Payments Made to Former Members of the Board<br />
of Management<br />
Total payments made to former Board of Management members<br />
and to their beneficiaries amounted to €9.5 million in<br />
<strong>2011</strong> (2010: €25.4 million).<br />
Provisions of €137.7 million (2010: €136.6 million) have been<br />
provided for pension obligations to former Board of Management<br />
members and their beneficiaries.<br />
189
190<br />
Supervisory Board and Board of Management<br />
<strong>Report</strong> of the Supervisory Board<br />
In the <strong>2011</strong> financial year, the Supervisory Board carefully performed<br />
all its duties and obligations under law, the Articles of<br />
Association, and its own policies and procedures. It thoroughly<br />
examined and discussed the Company’s situation.<br />
We advised the Board of Management regularly about the<br />
Company’s management and continually monitored the Board<br />
of Management’s activities, assuring ourselves that the<br />
Company’s management was legal, purposeful, and orderly.<br />
We were closely involved in all business transactions of key<br />
importance to the Company and discussed these transactions<br />
thoroughly based on the Board of Management’s reports. At<br />
the Supervisory Board’s five regular meetings and five extraordinary<br />
meetings, we addressed in depth all issues relevant<br />
to the Company. The Board of Management regularly provided<br />
us with timely and <strong>com</strong>prehensive information in both written<br />
and oral form. At the meetings of the full Supervisory Board<br />
and its <strong>com</strong>mittees, we had sufficient opportunity to actively<br />
discuss the Board of Management’s reports, motions, and<br />
proposed resolutions. We voted on such matters when it was<br />
required by law, the Company’s Articles of Association, or the<br />
Supervisory Board’s policies and procedure. The Supervisory<br />
Board agreed to the resolutions proposed by the Board of<br />
Management after thoroughly examining and discussing them.<br />
Furthermore, there was a regular exchange of information<br />
between the Chairman of the Supervisory Board and the<br />
Chairman of the Board of Management throughout the entire<br />
financial year. In fulfillment of his duties, the Chairman of the<br />
Supervisory Board also maintained contact with the members<br />
of the Supervisory Board outside of board meetings. The<br />
Supervisory Board was therefore continually informed about the<br />
current operating performance of the major Group <strong>com</strong>panies,<br />
significant business transactions, the development of key<br />
financial figures, and relevant decisions under consideration.<br />
Situation in Japan, Energy Policy and Regulatory<br />
Environment, and Proceedings<br />
The Board of Management provided the Supervisory Board<br />
with ongoing, detailed information about the natural disaster<br />
in Japan in March <strong>2011</strong> and the resulting developments at<br />
the country’s nuclear power stations. In this context, the Board<br />
of Management reported on the safety of nuclear power<br />
stations in Germany and the current status of the policy debate<br />
on the future of nuclear energy in Germany and in Europe. Key<br />
topics of the Supervisory Board’s discussions were the amendment<br />
to Germany’s Atomic Energy Act calling for the early and<br />
unplanned shutdown of nuclear power stations, the rescission<br />
of operative-life extensions, the retention of the nuclear-fuel<br />
tax, and the impact of these measures on E.ON. This included<br />
the discussion of the reasons for the legal action taken against<br />
the laws and ordinances relating to the transformation of<br />
Germany’s energy system.<br />
In addition, we regularly held thorough discussions of the<br />
current status of significant investment projects, particularly<br />
the developments connected with the generating units<br />
under construction in Datteln und Maasvlakte. The Board of<br />
Management also reported regularly and in detail about<br />
ongoing antitrust proceedings.<br />
Strategy and Implementation<br />
We intensively scrutinized and thoroughly discussed the<br />
main aspects of the E.ON Group’s strategic development and<br />
up<strong>com</strong>ing investment and divestment projects. We support<br />
the necessary change processes.<br />
The Board of Management reported in detail about the implementation<br />
of the new strategic course the E.ON Group set in the<br />
previous year and confirmed that this course is the right one,<br />
particularly in view of Germany’s altered energy-policy environment<br />
and the deterioration of Europe’s economic situation.<br />
In this regard, the Board of Management informed us about<br />
E.ON’s numerous activities to expand its renewables capacity<br />
and about its planned activities outside Europe; our thorough<br />
discussions with the Board of Management centered in particular<br />
on the opportunities and risks of different alternatives<br />
in light of E.ON’s international <strong>com</strong>petitive environment. This<br />
included E.ON’s possible participation in the privatization of<br />
Portugal’s energy industry, which in the end did not take<br />
place. During the course of this process, we were informed in<br />
a timely manner about other growth options.<br />
Other measures to optimize E.ON’s portfolio presented by the<br />
Board of Management included primarily the sale of E.ON’s<br />
power distribution network in the United Kingdom. The Board<br />
of Management also reported on the respective status of<br />
the sale process for E.ON’s gas transmission system operator in<br />
Germany (Open Grid Europe) and the disposal of ownership<br />
interests in power and gas <strong>com</strong>panies in other EU countries.<br />
The Supervisory Board dealt thoroughly with the consequences<br />
of the transformation of Germany’s energy system and with<br />
steps to secure E.ON’s future <strong>com</strong>petitiveness. As part of its<br />
response, E.ON launched a restructuring program called E.ON 2.0<br />
whose purpose is to achieve lasting performance improvements<br />
and to reduce E.ON’s controllable costs to €9.5 billion<br />
by 2015 at the latest.
In addition, the Board of Management informed us about its<br />
initial thoughts regarding E.ON AG’s transformation into a<br />
Societas Europaea (“SE”).<br />
Financial Situation and Medium-Term Plan<br />
We discussed in detail the financial situation of the major<br />
Group <strong>com</strong>panies in relation to developments in European and<br />
global energy markets, about which the Board of Management<br />
continually informed us. The full Supervisory Board discussed<br />
E.ON AG’s and the E.ON Group’s current asset, financial, and<br />
earnings situation, workforce developments, and earnings<br />
opportunities and risks.<br />
Topics of our discussions were the impact of Europe’s weaker<br />
economic performance in the wake of the European sovereign<br />
debt crisis and the global economic slowdown on E.ON’s<br />
business situation. We also discussed current developments<br />
in markets relevant for E.ON, the development of global fuel<br />
prices and of power prices, and existing overcapacity in Germany<br />
and E.ON’s other core markets, as well as E.ON’s significantly<br />
altered business environment due to the transformation<br />
of Germany’s energy system. In addition, the Board of Management<br />
informed us about the current status of negotiations<br />
with gas producers regarding the terms of long-term gas<br />
supply contracts.<br />
In our discussions of the E.ON Group’s medium-term plan, we<br />
agreed with the budget presented by the Board of Management<br />
for <strong>2011</strong> and 2012 and took note of the plan for 2013 and<br />
2014, including the investment program, its financing, and<br />
Group-wide human resources. Furthermore, the Board of Management<br />
informed us about the scope of E.ON’s use of derivative<br />
financial instruments and how certain changes to the<br />
regulation of these instruments will affect E.ON’s business.<br />
We also discussed the Company’s ratings situation with the<br />
Board of Management.<br />
In addition, the Board of Management informed us regularly<br />
about developments in E.ON’s individual markets and necessary<br />
impairment charges. In this regard, we thoroughly discussed<br />
the impact on E.ON’s business environment in the context of<br />
a further deterioration of the long-term development of<br />
power prices, the future utilization of power stations, and<br />
increasing regulatory intervention.<br />
Corporate Governance<br />
In the <strong>2011</strong> financial year, we again had intensive discussions<br />
about the implementation of the re<strong>com</strong>mendations of the<br />
German Corporate Governance Code (“the Code”). Together with<br />
the Board of Management, on March 8 we issued an updated<br />
declaration of <strong>com</strong>pliance in view of the re<strong>com</strong>mendation<br />
made to the <strong>Annual</strong> Shareholders Meeting that the Supervisory<br />
Board’s <strong>com</strong>pensation in the future no longer contain a<br />
performance-based <strong>com</strong>ponent. In addition, we assured ourselves<br />
that in the <strong>2011</strong> financial year E.ON AG <strong>com</strong>plied with<br />
the Code’s re<strong>com</strong>mendations pursuant to the declaration of<br />
<strong>com</strong>pliance it had issued on December 13, 2010, and the abovementioned<br />
update in March. Together with the Board of<br />
Management, we issued a declaration that E.ON had fully <strong>com</strong>plied<br />
with all of the re<strong>com</strong>mendations of the most recent<br />
version of the Code from its last declaration on December 13,<br />
2010, until March 8, <strong>2011</strong>; after this date, it <strong>com</strong>plied with one<br />
exception and will so <strong>com</strong>ply in the future. The exception is<br />
the elimination, starting with the <strong>2011</strong> financial year, of the<br />
performance-based <strong>com</strong>ponent from the Supervisory Board’s<br />
<strong>com</strong>pensation.<br />
The Supervisory Board is aware of no indications of conflicts<br />
of interest by members of the Board of Management or the<br />
Supervisory Board.<br />
Furthermore, the Supervisory Board discussed the results of<br />
its efficiency review. In this context, we agreed with the Board<br />
of Management that in the future training and advancedtraining<br />
sessions will be conducted for the Supervisory Board<br />
on selected issues. The new members who joined the Supervisory<br />
Board in <strong>2011</strong> received <strong>com</strong>prehensive information to<br />
prepare them for their duties.<br />
Committee Meetings<br />
CEO Letter<br />
E.ON Stock<br />
Combined Group Management <strong>Report</strong><br />
Consolidated Financial Statements<br />
Corporate Governance <strong>Report</strong><br />
Supervisory Board and Board of Management<br />
Tables and Explanations<br />
To fulfill its duties carefully and efficiently, the Supervisory<br />
Board has created five <strong>com</strong>mittees. Information about the<br />
<strong>com</strong>position of the <strong>com</strong>mittees can be found in the Corporate<br />
Governance <strong>Report</strong> on pages 178 and 179. Within the scope<br />
permissible by law, the Supervisory Board has transferred to<br />
the <strong>com</strong>mittees the authority to pass resolutions on certain<br />
matters. Chairpersons report to the full Supervisory Board, periodically<br />
and without delay, about the agenda and results of<br />
the <strong>com</strong>mittee’s meetings.<br />
The Supervisory Board’s Executive Committee met six times.<br />
In particular, it prepared the meetings of the E.ON AG Supervisory<br />
Board. Among other things, the Executive Committee<br />
thoroughly reviewed the Board of Management’s <strong>com</strong>pensation<br />
plan for <strong>com</strong>pliance with the Act on the Appropriateness of<br />
Management Board Compensation (known by its German acronym,<br />
“VorstAG”) and did <strong>com</strong>prehensive preparatory work<br />
for the Supervisory Board’s resolutions on this matter. In addition,<br />
it discussed the Board of Management’s initial thoughts<br />
regarding E.ON AG’s transformation into an SE.<br />
191
192 Supervisory Board and Board of Management<br />
At its two meetings, the Nomination Committee prepared the<br />
re<strong>com</strong>mendation for the <strong>Annual</strong> Shareholders Meeting for<br />
the election of three shareholder representatives (Baroness<br />
Denise Kingsmill, Bård Mikkelsen, and René Obermann) to<br />
the E.ON AG Supervisory Board.<br />
The Mediation Committee pursuant to Section 27, Paragraph<br />
3, of the Codetermination Act did not meet in <strong>2011</strong>.<br />
The Finance and Investment Committee held four meetings.<br />
The matters addressed by the <strong>com</strong>mittee included the sale of<br />
E.ON’s power distribution network in the United Kingdom and<br />
an opportunity to acquire a shareholding (which ultimately was<br />
not implemented) in conjunction with the privatization of<br />
Portugal’s energy industry. It also dealt conclusively with the<br />
planning for <strong>2011</strong> and dealt in detail with the medium-term<br />
plan for the period 2012–2014. The <strong>com</strong>mittee’s thorough discussions<br />
and the Board of Management’s <strong>com</strong>prehensive<br />
reports focused on issues relating to corporate finance, the<br />
investment plan, and the Company’s rating situation. At its<br />
meetings, the <strong>com</strong>mittee also prepared Supervisory Board resolutions<br />
on trans actions requiring the Supervisory Board’s<br />
approval and on the medium-term plan.<br />
The Audit and Risk Committee met six times. With due attention<br />
to the independent auditors’ audit report and in discussions<br />
with the independent auditors, the <strong>com</strong>mittee devoted particular<br />
attention to the Financial Statements of E.ON AG (prepared<br />
in accordance with the German Commercial Code) and<br />
the E.ON Group’s Consolidated Financial Statements and<br />
Interim <strong>Report</strong>s (prepared in accordance with International<br />
Financial <strong>Report</strong>ing Standards, or “IFRS”). The Interim <strong>Report</strong>s<br />
for <strong>2011</strong> were thoroughly discussed prior to their release. The<br />
<strong>com</strong>mittee discussed the re<strong>com</strong>mendation for selecting<br />
independent auditors for the <strong>2011</strong> financial year and assigned<br />
the tasks for their auditing services, established the audit<br />
priorities, determined the independent auditors’ <strong>com</strong>pensation,<br />
and verified their qualifications and independence in line<br />
with the Code’s re<strong>com</strong>mendations. The <strong>com</strong>mittee assured<br />
itself that the independent auditors have no conflicts of<br />
interest. Topics of particularly detailed discussions included<br />
issues relating to accounting, the internal control system,<br />
and risk management in relation to the accounting process.<br />
In addition, the <strong>com</strong>mittee thoroughly discussed the Combined<br />
Group Management <strong>Report</strong> and the proposal for appropriating<br />
in<strong>com</strong>e available for distribution and prepared<br />
the relevant re<strong>com</strong>mendations for the Supervisory Board and<br />
reported to the Supervisory Board. In this context, the <strong>com</strong>mittee<br />
also discussed in detail the progress of significant investment<br />
projects as well as the results of the goodwill impairment<br />
tests and the necessary impairment charges. Other matters<br />
dealt with by the <strong>com</strong>mittee included the testing and quality<br />
control of E.ON’s risk management system. The <strong>com</strong>mittee<br />
focused on the Company’s risk-monitoring organization as well<br />
as its risk situation and ability to bear risk, in particular with<br />
regard to counterparty, liquidity, country, market and operational<br />
risks. It did this by working with the independent auditors<br />
and by examining documents that included reports from<br />
the Company’s risk <strong>com</strong>mittee. The <strong>com</strong>mittee also discussed<br />
the work done by internal audit including the audit plan in <strong>2011</strong><br />
and the audit priorities for 2012. Furthermore, the <strong>com</strong>mittee<br />
discussed the <strong>com</strong>pliance report and E.ON’s <strong>com</strong>pliance system,<br />
and other issues related to auditing. The Board of Management<br />
also reported on ongoing proceedings and on legal and<br />
regulatory risks for the E.ON Group’s business.<br />
Examination and Approval of the Financial Statements<br />
of E.ON AG, Approval of the Consolidated<br />
Financial Statements, Proposal for Appropriating<br />
In<strong>com</strong>e Available for Distribution<br />
PricewaterhouseCoopers Aktiengesellschaft, Wirtschaftsprüfungsgesellschaft,<br />
Düsseldorf, the independent auditors<br />
chosen by the <strong>Annual</strong> Shareholders Meeting and appointed<br />
by the Supervisory Board, audited and submitted an unqualified<br />
opinion on the Financial Statements of E.ON AG and<br />
the Combined Group Management <strong>Report</strong> for the year ended<br />
December 31, <strong>2011</strong>. The Consolidated Financial Statements<br />
prepared in accordance with IFRS exempt E.ON AG from the<br />
requirement to publish Consolidated Financial Statements in<br />
accordance with the German Commercial Code.<br />
Furthermore, the auditors examined E.ON AG’s risk detection<br />
system. This examination revealed that the Board of Management<br />
has taken appropriate measures to meet the requirements<br />
of risk monitoring and that the risk detection system<br />
is fulfilling its tasks.<br />
At our meeting on March 13, 2012, we examined—in the presence<br />
of the independent auditor and with knowledge of,<br />
and reference to, the Independent Auditor’s <strong>Report</strong> and the<br />
results of the preliminary review by the Audit and Risk Committee—the<br />
Financial Statements of E.ON AG, the Consolidated<br />
Financial Statements, the Combined Group Management<br />
<strong>Report</strong>, and the Board of Management’s proposal regarding<br />
the appropriation of net in<strong>com</strong>e available for distribution.<br />
The independent auditor was available for supplementary questions<br />
and answers. We found no reasons, including after the<br />
conclusion of our examination, for objections regarding these<br />
documents. We therefore noted with approval the Independent<br />
Auditor’s <strong>Report</strong>.<br />
We approved the Financial Statements of E.ON AG prepared by<br />
the Board of Management and the Consolidated Financial Statements.<br />
The Financial Statements are thus adopted. We agree<br />
with the Combined Group Management <strong>Report</strong> and, in particular,<br />
with its statements concerning E.ON’s future development.
We examined the Board of Management’s proposal for appropriating<br />
in<strong>com</strong>e available for distribution, which includes a<br />
cash dividend of €1 per ordinary share, also taking into consideration<br />
the Company’s liquidity and its finance and investment<br />
plans. The proposal is in the Company’s interest with due<br />
consideration for the shareholders’ interests. After examining<br />
and weighing all arguments, we agree with the Board of<br />
Management’s proposal for appropriating in<strong>com</strong>e available<br />
for distribution.<br />
Personnel Changes on the Board of Management<br />
and Supervisory Board<br />
There were no personal changes on the E.ON AG Board of<br />
Management in the <strong>2011</strong> financial year.<br />
There were the following personnel changes on the Supervisory<br />
Board: Ulrich Hartmann and Dr. Wilhelm Simson ended their<br />
service on the Supervisory Board effective the conclusion of<br />
the <strong>Annual</strong> Shareholders Meeting on May 5, <strong>2011</strong>.<br />
This resulted in a change in the Chairmanship of the Supervisory<br />
Board and on various <strong>com</strong>mittees. At its meeting after<br />
the <strong>Annual</strong> Shareholders Meeting, the Supervisory Board<br />
elected Werner Wenning, who was already a member of the<br />
Supervisory Board, to be its new Chairman. This also made<br />
Mr. Wenning Chairman of the Executive Committee and the<br />
Nomination Committee and a member of the Mediation<br />
Committee; he was elected Chairman of the latter <strong>com</strong>mittee<br />
by the Supervisory Board. Mr. Wenning was also elected<br />
Chairman of the Finance and Investment Committee and a<br />
member of the Audit and Risk Committee. In addition,<br />
Dr. Henning Schulte-Noelle was elected a member of the<br />
Finance and Investment Committee.<br />
As successors on the Supervisory Board, the E.ON AG <strong>Annual</strong><br />
Shareholders Meeting elected Baroness Denise Kingsmill and<br />
René Obermann on May 5, <strong>2011</strong>. In addition, the <strong>Annual</strong><br />
Shareholders Meeting elected Bård Mikkelsen to be a member<br />
of the Supervisory Board. He had already succeeded<br />
Jens P. Heyerdahl as a member of the Supervisory Board by<br />
court order effective July 19, 2010. We would like to take this<br />
opportunity to thank Mr. Heyerdahl for his work on the<br />
Supervisory Board. The new members were elected for the<br />
departing members’ remaining term of service, which lasts<br />
until April 30, 2013.<br />
CEO Letter<br />
E.ON Stock<br />
Combined Group Management <strong>Report</strong><br />
Consolidated Financial Statements<br />
Corporate Governance <strong>Report</strong><br />
Supervisory Board and Board of Management<br />
Tables and Explanations<br />
After a long and difficult illness, Wolf-Rüdiger Hinrichsen, for<br />
many years Chairman of the E.ON AG Works Council and an<br />
employee representative on the Supervisory Board, died on<br />
September 30, <strong>2011</strong>. Mr. Hinrichsen had represented the<br />
employees’ interests on the E.ON AG Supervisory Board since<br />
1998. Through his membership on this board and his wise<br />
council, he played a decisive role in shaping the Company’s<br />
culture and development. We will honor his memory.<br />
Mr. Hinrichsen’s successor is Oliver Biniek, Chairman of Works<br />
Council of E.ON Anlagenservice GmbH, who had already<br />
been elected a replacement member and so automatically<br />
took his place on the Supervisory Board. At its meeting on<br />
October 19, <strong>2011</strong>, the Supervisory Board elected Mr. Biniek to<br />
succeed Mr. Hinrichsen as a member of the Finance and<br />
Investment Committee.<br />
The Supervisory Board would like to take this opportunity<br />
to express its sincere thanks to Ulrich Hartmann and Wilhelm<br />
Simson for their outstanding service to the E.ON Group.<br />
Mr. Hartmann worked for our <strong>com</strong>pany for 39 years, much of<br />
it as Chairman of the Board of Management and, later, Chairman<br />
of the Supervisory Board. He thus played a decisive role<br />
in setting the Company’s course and contributing to its success<br />
over several decades. Professor Dr. Simson served the Company<br />
for more than 20 years as Chairman of the Board of Management<br />
and, later, as a member of the Supervisory Board.<br />
By merging VEBA and VIAG, Mr. Hartmann and Mr. Simson<br />
forged the world’s first truly international energy supply<br />
<strong>com</strong>pany. After ending their service on the Board of Management<br />
in 2003, both served for many years as members of<br />
the Supervisory Board, where their business acumen and sure<br />
judgment played a key role in guiding E.ON’s successful<br />
strategic development and its transformation into a focused<br />
energy <strong>com</strong>pany.<br />
The Supervisory Board wishes to thank the Board of Management,<br />
the Works Councils, and all the employees of the<br />
E.ON Group for their dedication and hard work in the <strong>2011</strong><br />
financial year.<br />
Düsseldorf<br />
March 13, 2012<br />
The Supervisory Board<br />
Werner Wenning<br />
Chairman<br />
193
194<br />
Supervisory Board (and Information on Other Directorships Held by Supervisory Board Members)<br />
Honorary Chairman<br />
Prof. Dr. Günter Vogelsang<br />
Düsseldorf<br />
Supervisory Board<br />
Ulrich Hartmann<br />
Chairman of the Supervisory Board,<br />
E.ON AG (until May 5, <strong>2011</strong>)<br />
Werner Wenning<br />
Chairman of the Supervisory Board,<br />
E.ON AG (since May 5, <strong>2011</strong>)<br />
• Deutsche Bank AG<br />
• HDI V.a.G.<br />
• Talanx AG<br />
• Henkel AG & Co. KGaA<br />
(Shareholders’ Committee)<br />
• Freudenberg & Co. KG<br />
(Shareholders’ Committee)<br />
Erhard Ott<br />
Member of the National Executive<br />
Board, Unified Service Sector Union,<br />
ver.di,<br />
Deputy Chairman of the Supervisory<br />
Board, E.ON AG<br />
• Bremer Lagerhaus-Gesellschaft AG<br />
Werner Bartoschek<br />
Chairman of the Group Works Council,<br />
E.ON Ruhrgas AG<br />
• E.ON Ruhrgas AG<br />
Sven Bergelin<br />
Director of the National Energy Industry<br />
Group, Unified Service Sector Union,<br />
ver.di<br />
• E.ON Energie AG<br />
• E.ON Kernkraft GmbH<br />
Oliver Biniek<br />
(since September 30, <strong>2011</strong>)<br />
Chairman of the Supervisory Board,<br />
E.ON Anlagenservice GmbH<br />
• E.ON Anlagenservice GmbH<br />
• E.ON Generation GmbH<br />
Gabriele Gratz<br />
Chairwoman of the European Works<br />
Council, E.ON AG<br />
• E.ON Ruhrgas AG<br />
Wolf-Rüdiger Hinrichsen<br />
(until September 30, <strong>2011</strong>)<br />
Chairman of the Works Council, E.ON AG<br />
Ulrich Hocker<br />
General Manager, German Investor<br />
Protection Association<br />
• Deutsche Telekom AG<br />
• Feri Finance AG<br />
• Gildemeister AG<br />
• Gartmore SICAV (until June 15, <strong>2011</strong>)<br />
• Phoenix Mecano AG<br />
(Chairman of the Board of Directors)<br />
Baroness Denise Kingsmill, CBE<br />
(since May 5, <strong>2011</strong>)<br />
Attorney, Member of the House of Lords<br />
• Aprenergy plc<br />
• Betfair plc<br />
• International Consolidated Airlines<br />
Group S.A.<br />
• Korn/Ferry International Limited<br />
Prof. Dr. Ulrich Lehner<br />
Member of the Shareholders’<br />
Committee, Henkel AG & Co KGaA<br />
• Deutsche Telekom AG (Chairman)<br />
• Henkel Management AG<br />
• HSBC Trinkaus & Burkhardt AG<br />
(until June 7, <strong>2011</strong>)<br />
• Porsche Automobil Holding SE<br />
• ThyssenKrupp AG<br />
• Dr. Oetker KG (Advisory Board)<br />
• Henkel AG & Co. KGaA<br />
(Shareholders’ Committee)<br />
• Novartis AG (Administrative Council)<br />
Bård Mikkelsen<br />
Businessman, former President and<br />
Chief Executive Officer, Statkraft AS<br />
• Bore Tech AB (Chairman)<br />
• Cermaq ASA (Chairman)<br />
• Clean Energy Invest AS (Chairman)<br />
• Ganger Rolf ASA/Bonheur ASA<br />
(Shareholders’ Committee)<br />
• Powel AS (Chairman)<br />
• Saferoad AS<br />
• Store Norske Spitsbergen<br />
Kulkompani AS (Chairman)<br />
René Obermann<br />
(since May 5, <strong>2011</strong>)<br />
Chief Executive Officer,<br />
Deutsche Telekom AG<br />
• T-Systems International GmbH<br />
(Chairman)<br />
• T-Mobile US Inc. (Chairman) Board of<br />
Directors<br />
Hans Prüfer<br />
Chairman of the Group Works Council,<br />
E.ON AG<br />
Information as of December 31, <strong>2011</strong>, or as of the date on which membership in the E.ON Supervisory Board ended.<br />
• Directorships/supervisory board memberships within the meaning of Section 100, Paragraph 2 of the German Stock Corporation Act.<br />
• Directorships/memberships in <strong>com</strong>parable domestic and foreign supervisory bodies of <strong>com</strong>mercial enterprises.
Klaus Dieter Raschke<br />
Chairman of the Group Works Council,<br />
E.ON Energie AG<br />
• E.ON Energie AG<br />
• E.ON Kernkraft GmbH<br />
Dr. Walter Reitler<br />
Senior Vice President of HSE and Corporate<br />
Responsibility, E.ON Energie AG<br />
• E.ON Energie AG<br />
Hubertus Schmoldt<br />
Economist<br />
• Bayer AG<br />
• BP Europa SE (until May 6, <strong>2011</strong>)<br />
• DOW Olefinverbund GmbH<br />
• RAG Aktiengesellschaft<br />
Dr. Henning Schulte-Noelle<br />
Chairman of the Supervisory Board,<br />
Allianz SE<br />
• Allianz SE (Chairman)<br />
Dr. Karen de Segundo<br />
Attorney<br />
• British American Tobacco plc<br />
• Ensus Ltd. (until September 24, <strong>2011</strong>)<br />
• Koninklijke Ahold N.V.<br />
(until April 20, <strong>2011</strong>)<br />
• Lonmin plc<br />
• Pöyry Oyj<br />
Dr. Theo Siegert<br />
Managing Partner, de Haen-Carstanjen<br />
& Söhne<br />
• Deutsche Bank AG<br />
• Henkel AG & Co. KGaA<br />
• Merck KGaA<br />
• DKSH Holding Ltd.<br />
• E. Merck OHG<br />
Prof. Dr. Wilhelm Simson<br />
Chemist (until May 5, <strong>2011</strong>)<br />
• Hochtief AG (until May 12, <strong>2011</strong>)<br />
• E.ON Energie AG<br />
(since October 9, <strong>2011</strong>)<br />
• Freudenberg & Co. KG<br />
(until June 25, <strong>2011</strong>)<br />
Dr. Georg Frhr. von Waldenfels<br />
Attorney<br />
• Georgsmarienhütte Holding GmbH<br />
• Rothenbaum Sport GmbH (Chairman)<br />
Hans Wollitzer<br />
Chairman of the Company Works Council,<br />
E.ON Energie AG<br />
• E.ON Energie AG<br />
• E.ON Bayern AG<br />
CEO Letter<br />
E.ON Stock<br />
Combined Group Management <strong>Report</strong><br />
Consolidated Financial Statements<br />
Corporate Governance <strong>Report</strong><br />
Supervisory Board and Board of Management<br />
Tables and Explanations<br />
Supervisory Board Committees<br />
Mediation Committee<br />
Werner Wenning, Chairman<br />
Erhard Ott, Deputy Chairman<br />
Hans Prüfer<br />
Dr. Henning Schulte-Noelle<br />
Executive Committee<br />
Werner Wenning, Chairman<br />
Erhard Ott, Deputy Chairman<br />
Hans Prüfer<br />
Dr. Henning Schulte-Noelle<br />
Audit and Risk Committee<br />
Dr. Theo Siegert, Chairman<br />
Klaus Dieter Raschke, Deputy Chairman<br />
Werner Bartoschek<br />
Werner Wenning<br />
Finance and Investment<br />
Committee<br />
Werner Wenning, Chairman<br />
Hans Wollitzer, Deputy Chairman<br />
Oliver Biniek<br />
Gabriele Gratz<br />
Prof. Dr. Ulrich Lehner<br />
Dr. Henning Schulte-Noelle<br />
Nomination Committee<br />
Werner Wenning, Chairman<br />
Prof. Dr. Ulrich Lehner<br />
Dr. Henning Schulte-Noelle<br />
Information as of December 31, <strong>2011</strong>, or as of the date on which membership in the E.ON Supervisory Board ended.<br />
• Directorships/supervisory board memberships within the meaning of Section 100, Paragraph 2 of the German Stock Corporation Act.<br />
• Directorships/memberships in <strong>com</strong>parable domestic and foreign supervisory bodies of <strong>com</strong>mercial enterprises.<br />
195
196<br />
Disclosure of Takeover Barriers<br />
Disclosures Pursuant to Section 289, Paragraph 4,<br />
and Section 315, Paragraph 4, of the<br />
German Commercial Code<br />
(Part of the Combined Group Management <strong>Report</strong>)<br />
Composition of Share Capital<br />
The share capital totals €2,001,000,000.00 and consists of<br />
2,001,000,000 registered shares without nominal value. Each<br />
share of stock grants the same rights and one vote at a<br />
Shareholders Meeting.<br />
Restrictions on Voting Rights or the Transfer of<br />
Shares<br />
Shares acquired by an employee under the Company-sponsored<br />
employee stock purchase program are subject to a blackout<br />
period that begins the day ownership of such shares is transferred<br />
to the employee and that ends on December 31 of the<br />
next calendar year plus one. As a rule, an employee may not<br />
sell such shares until the blackout period has expired.<br />
Pursuant to Section 71b of the German Stock Corporation Act<br />
(known by its German abbreviation, “AktG”), the Company’s<br />
own shares give it no rights, including no voting rights.<br />
Legal Provisions and Rules of the Company’s Articles<br />
of Association Regarding the Appointment and<br />
Removal of Board of Management Members and<br />
Amendments to the Articles of Association<br />
Pursuant to the Company’s Articles of Association, the Board of<br />
Management consists of at least two members. The appointment<br />
of deputy Board of Management members is permissible.<br />
The Supervisory Board decides on the number of members<br />
as well as on their appointment and dismissal.<br />
The Supervisory Board appoints members to the Board of<br />
Management for a term not exceeding five years; a member<br />
may be appointed for another term of office or a member’s<br />
term of office may be extended for an additional term not<br />
exceeding five years. If more than one person is appointed<br />
as a member of the Board of Management, the Supervisory<br />
Board may appoint one of the members as Chairperson of<br />
the Board of Management. If a Board of Management member<br />
is absent, in the event of an urgent matter, the court makes<br />
the necessary appointment upon petition by a concerned<br />
party. The Supervisory Board may revoke the appointment of<br />
a member of the Board of Management and the Chairperson<br />
of the Board of Management for serious cause (for further<br />
details, see Sections 84 and 85 of the AktG and Sections 31 and<br />
33 of the German Codetermination Act).<br />
Pursuant to Section 179 of the AktG, an amendment to the<br />
Articles of Association requires a resolution of the Shareholders<br />
Meeting. Resolutions of the Shareholders Meeting require a<br />
simple majority and, in cases where a majority of the share capital<br />
is required, a simple majority of the share capital represented,<br />
unless the law or the Articles of Association explicitly<br />
prescribe otherwise.<br />
The Supervisory Board is authorized to decide by resolution<br />
on amendments to the Articles of Association that affect<br />
only their wording (Section 24 of the Articles of Association).<br />
Furthermore, the Supervisory Board is authorized to revise<br />
the wording of Section 3 of the Articles of Association upon<br />
utilization of authorized or conditional capital.<br />
Board of Management’s Power to Issue or Buy Back<br />
Shares<br />
Pursuant to a resolution of the Shareholders Meeting of May 6,<br />
2010, the Board of Management is authorized, until May 5, 2015,<br />
to acquire own shares. The shares acquired and other own<br />
shares that are in possession of or to be attributed to the Company<br />
pursuant to Sections 71a et seq. of the AktG must altogether<br />
at no point account for more than 10 percent of the<br />
Company’s share capital.
At the Board of Management’s discretion, the acquisition may<br />
be conducted:<br />
• through a stock exchange<br />
• by means of a public offer directed at all shareholders or<br />
a public solicitation to submit offers<br />
• by means of a public offer or a public solicitation to<br />
submit offers for the exchange of liquid shares that are<br />
admitted to trading on an organized market for Company<br />
shares<br />
• by use of derivatives (put or call options or a <strong>com</strong>bination<br />
of both).<br />
These authorizations may be utilized on one or several occasions,<br />
in whole or in partial amounts, in pursuit of one or<br />
more objectives by the Company and also by affiliated <strong>com</strong>panies<br />
or by third parties for the Company’s account or its<br />
affiliates’ account.<br />
With regard to treasury shares that will be or have been<br />
acquired based on the above-mentioned authorization and/<br />
or prior authorizations by the Shareholders Meeting, the<br />
Board of Management is authorized, subject to the Supervisory<br />
Board’s consent and excluding shareholder subscription<br />
rights, to use these shares—in addition to a disposal through<br />
a stock exchange or an offer granting a subscription right to<br />
all shareholders—as follows:<br />
• to be sold and transferred against cash consideration<br />
• to be sold and transferred against contribution in kind<br />
• to be used in order to satisfy the rights of creditors of<br />
bonds with conversion or option rights or, respectively,<br />
conversion obligations issued by the Company or its<br />
Group <strong>com</strong>panies<br />
• to be offered for purchase and transferred to individuals<br />
who are employed by the Company or one of its affiliates.<br />
CEO Letter<br />
E.ON Stock<br />
Combined Group Management <strong>Report</strong><br />
Consolidated Financial Statements<br />
Corporate Governance <strong>Report</strong><br />
Supervisory Board and Board of Management<br />
Tables and Explanations<br />
These authorizations may be utilized on one or several occasions,<br />
in whole or in partial amounts, separately or collectively<br />
by the Company and also by Group <strong>com</strong>panies or by third<br />
parties for the Company’s account or its affiliates’ account.<br />
In addition, the Board of Management is authorized to cancel<br />
treasury shares, without such cancellation or its implementation<br />
requiring an additional resolution by the Shareholders<br />
Meeting.<br />
In each case, the Board of Management will inform the<br />
Shareholders Meeting about the reasons for and the purpose<br />
of the acquisition of treasury shares, the number of treasury<br />
shares acquired, the amount of the registered share capital<br />
attributable to them, the portion of the registered share capital<br />
represented by them, and their equivalent value.<br />
Pursuant to Section 3, Paragraph 5 of the Articles of Association,<br />
the Board of Management is authorized, subject to the<br />
Supervisory Board’s consent, to increase the Company’s share<br />
capital until May 5, 2014 by up to €460,000,000 by issuing<br />
new registered shares with no-par value against contribution<br />
in cash and/or in kind once or several times (Authorized<br />
Capital pursuant to Sections 202 et seq. of the AktG). In such<br />
issuances, the Board of Management is authorized, subject<br />
to the Supervisory Board’s consent, to exclude shareholders’<br />
subscription right in the case of an issue of shares against<br />
cash contributions in an amount of up to 10 percent of the<br />
Company’s share capital. The shares applied to the 10-percent<br />
limit will be those issued, under the exclusion of subscription<br />
right, by means of the measures described in the resolution of<br />
the Shareholders Meeting. The Board of Management is<br />
authorized, subject to the Supervisory Board’s consent, to<br />
197
198 Disclosure of Takeover Barriers<br />
exclude the shareholders’ subscription right in the case of<br />
an issue of shares against contributions in kind, but only to<br />
such an extent that the aggregate amount of the shares<br />
issued under this authorization (Section 3, Paragraph 5 of<br />
the Articles of Association) against contribution in kind with<br />
an exclusion of the shareholders’ subscription right does not<br />
exceed 20 percent of the Company’s share capital. In addition,<br />
the total amount of shares issued against contributions in<br />
cash or in kind with an exclusion of the subscription right may<br />
not exceed 20 percent of the Company’s share capital.<br />
Furthermore, the Shareholders Meeting of May 6, 2010, gave<br />
the Board of Management two authorizations to issue bonds<br />
with conversion or option rights and with conversion obligations,<br />
profit participation rights, or participating bonds (or a<br />
<strong>com</strong>bination or these instruments). Under these authorizations,<br />
the Board of Management may, with the Supervisory Board’s<br />
consent, issue, once or several times, until May 5, 2015, registered<br />
option bonds, convertible bonds, profit participation<br />
rights, or participating bonds (or a <strong>com</strong>bination of these instruments)<br />
with a total face value of up to €5 billion and grant<br />
option rights to the holders of option bonds and/or conversion<br />
rights to the holders of convertible bonds for registered<br />
Company shares with a proportionate amount of the Company’s<br />
share capital totaling up to €175,000,000 pursuant to<br />
the details of the terms and conditions of the option and/or<br />
conversion bonds. This ensures that the total face value of up<br />
to €5 billion could only be utilized once through the utilization<br />
of the authorization. In line with the authorization, the<br />
Company’s share capital is conditionally increased by up to<br />
€175,000,000 and again by up to €175,000,000 pursuant to<br />
Section 3, Paragraphs 3 and 4, of the Articles of Association.<br />
Here, too, the Board of Management is authorized, subject to<br />
the Supervisory Board’s consent, to fully exclude the shareholders’<br />
subscription right on bonds (with option or conversion<br />
rights or conversion obligation) issued against contributions<br />
in cash.<br />
Significant Agreements to Which the Company Is a<br />
Party That Take Effect on a Change of Control of the<br />
Company Following a Takeover Bid<br />
The ministerial approval of the German Federal Minister of<br />
Economics and Technology dated July 5/September 18, 2002,<br />
on the proposed mergers of E.ON/Gelsenberg and E.ON/<br />
Bergemann contains the following condition: at the direction<br />
of the Federal Ministry of Economics and Technology, E.ON<br />
must sell to a third party all shares in Ruhrgas AG held by E.ON<br />
or its affiliated <strong>com</strong>panies if another <strong>com</strong>pany acquires a<br />
voting-rights or share-capital majority in E.ON and the acquirer<br />
gives reasonable cause for concern that the Federal Republic<br />
of Germany’s energy policy interests will be negatively affected.<br />
The acquirer of Ruhrgas shares requires the prior approval of<br />
the Federal Ministry of Economics and Technology; such prior<br />
approval may be denied only if the acquirer gives reasonable<br />
cause for concern that the Federal Republic of Germany’s<br />
energy policy interests will be negatively affected. This obligation<br />
is valid for a period of ten years after the mergers’<br />
consummation.<br />
Debt issued since 2007 contains change-of-control clauses<br />
that give the creditor the right of cancellation. This applies,<br />
inter alia, to bonds issued by E.ON International Finance B.V.<br />
and guaranteed by E.ON AG, promissory notes issued by E.ON<br />
AG, and other instruments such as credit contracts. Granting<br />
change-of-control rights to creditors is considered good corporate<br />
governance and has be<strong>com</strong>e standard market practice.
Further information about financial liabilities is contained in<br />
the section of the Combined Group Management <strong>Report</strong><br />
entitled “Financial Condition” and in Note 26 to the Consolidated<br />
Financial Statements.<br />
Settlement Agreements between the Company and<br />
Board of Management Members or Employees in<br />
the Case of a Change-of-Control Event<br />
In the event of a premature loss of a Board of Management<br />
position due to a change-of-control event, the service agreements<br />
of Board of Management members entitle them to<br />
severance and settlement payments (see the detailed presentation<br />
in the Compensation <strong>Report</strong>).<br />
In the case of a change-of-control event, there is an early<br />
settlement of performance rights under the E.ON Share Performance<br />
Plan.<br />
Disclosures Pursuant to Section 289, Paragraph 5,<br />
of the German Commercial Code on the Internal<br />
Control System for the Accounting Process (Part of<br />
the Combined Group Management <strong>Report</strong>)<br />
General Principles<br />
We apply Section 315a (1) of the German Commercial Code and<br />
prepare our Consolidated Financial Statements in accordance<br />
with International Financial <strong>Report</strong>ing Standards (“IFRS”) and<br />
the interpretations of the International Financial <strong>Report</strong>ing<br />
Interpretations Committee that were adopted by the European<br />
Commission for use in the EU as of the end of the fiscal year<br />
and whose application was mandatory as of the balance-sheet<br />
date (see Note 1 to the Consolidated Financial Statements).<br />
Our market units are our IFRS reportable segments.<br />
CEO Letter<br />
E.ON Stock<br />
Combined Group Management <strong>Report</strong><br />
Consolidated Financial Statements<br />
Corporate Governance <strong>Report</strong><br />
Supervisory Board and Board of Management<br />
Tables and Explanations<br />
We prepare the E.ON AG Financial Statements in accordance<br />
with the German Commercial Code (in the version of the<br />
Accounting Law Modernization Act, known by its German acronym,<br />
“BilMoG,” which took effect on May 29, 2009) and the<br />
German Stock Corporation Act.<br />
We prepare a Combined Group Management <strong>Report</strong> which<br />
applies to both the E.ON Group and E.ON AG.<br />
Accounting Process<br />
The Consolidated Financial Statements are prepared in a<br />
multi-step process using the same SAP software throughout<br />
the E.ON Group. The financial statements of our units (prepared<br />
by the respective lead <strong>com</strong>pany and approved by its<br />
independent auditor) are <strong>com</strong>bined at E.ON AG in the Consolidated<br />
Financial Statements. E.ON AG is responsible for maintaining<br />
and providing support for the consolidation software,<br />
for the E.ON-wide standard chart of accounts, and for implementing<br />
central consolidation measures. At several E.ON<br />
entities, shared service centers conduct some processes (like<br />
human resources management) that have an indirect impact<br />
on the accounting process.<br />
All <strong>com</strong>panies included in the Consolidated Financial Statements<br />
must <strong>com</strong>ply with our uniform Accounting and <strong>Report</strong>ing<br />
Guidelines for the <strong>Annual</strong> Consolidated Financial Statements<br />
and the Interim Consolidated Financial Statements. These<br />
guidelines include a description of all general E.ON Group consolidation<br />
processes as well as the applicable IFRS accounting<br />
and valuation principles. They also explain accounting principles<br />
(such as those for provisions for nuclear waste management<br />
and the treatment of regulatory obligations) typical in<br />
the E.ON Group. In addition, all such <strong>com</strong>panies must meet the<br />
deadlines of our balance-sheet closing calendar.<br />
199
200 Internal Control System for the Accounting Process<br />
In conjunction with the closing process, additional qualitative<br />
and quantitative information is <strong>com</strong>piled. Furthermore, dedicated<br />
quality-control processes are in place for all relevant<br />
departments to discuss and ensure the <strong>com</strong>pleteness of relevant<br />
information on a regular basis.<br />
E.ON AG’s Financial Statements are also prepared by using<br />
SAP software. The accounting and preparation processes are<br />
divided into discrete functional steps. Automated or manual<br />
controls are integrated into each process. Defined procedures<br />
ensure that all transactions and the preparation of E.ON AG’s<br />
Financial Statements are recorded, processed, assigned on<br />
an accrual basis, and documented in a <strong>com</strong>plete, timely, accurate<br />
manner. Relevant data from E.ON AG’s Financial Statements<br />
are, if necessary, adjusted to conform with IFRS and<br />
then transferred to the consolidation software system using<br />
SAP-supported transfer technology.<br />
The following explanations about our Internal Control System<br />
and our general IT controls apply to the Consolidated Financial<br />
Statements and E.ON AG’s Financial Statements.<br />
Internal Control and Risk Management System<br />
Internal controls are an integral part of our accounting processes.<br />
Guidelines, called Internal_Controls@E.ON, define uniform<br />
financial-reporting documentation requirements and<br />
procedures for the entire E.ON Group. The guidelines include a<br />
definition of their scope, documentation and evaluation standards,<br />
a Catalog of Management Controls, a Generic Risk Catalog,<br />
a description of the test activities of our Internal Audit<br />
division, and a description of the final Sign-Off process. We<br />
believe that <strong>com</strong>pliance with these rules provides sufficient certainty<br />
to prevent error or fraud from resulting in material misrepresentations<br />
in the Consolidated Financial Statements, the<br />
Combined Group Management <strong>Report</strong>, and the Interim <strong>Report</strong>s.<br />
COSO Model<br />
Our internal control system is based on the globally recognized<br />
COSO model (COSO: The Committee of Sponsoring Organizations<br />
of the Treadway Commission). The Generic Risk Catalog<br />
(which en<strong>com</strong>passes <strong>com</strong>pany- and industry-specific aspects)<br />
defines possible risks for accounting (financial reporting) in the<br />
functional areas of our operating entities and thus serves as<br />
check list and provides guidance for the documentation process.<br />
The Catalog of Management Controls is a key <strong>com</strong>ponent of<br />
a functioning internal control system. It en<strong>com</strong>passes overarching<br />
controls to address risks in a range of issue areas and<br />
processes, such as financial reporting, corporate responsibility,<br />
fraud, the <strong>com</strong>munications process, planning and budgeting,<br />
investment controlling and internal audit.<br />
Central Documentation System<br />
The E.ON <strong>com</strong>panies to which the internal control system<br />
applies use a central documentation system to document key<br />
controls. The system defines the scope, detailed documentation<br />
requirements, requirements for the assessment process<br />
and the final evaluation performed by the Sign-Off process.<br />
Scope<br />
Each year, we conduct a multi-stage process using qualitative<br />
criteria and quantitative materiality metrics to define which<br />
E.ON <strong>com</strong>panies must document and evaluate their financialdisclosure<br />
processes and controls. Selection is based on predefined<br />
line items in the balance sheets, in<strong>com</strong>e statements<br />
and/or notes of each <strong>com</strong>pany’s prior-year financial statements.
Assessment<br />
After <strong>com</strong>panies have documented their processes and controls,<br />
they conduct an annual assessment of the design and<br />
the operational effectiveness of the processes as well as the<br />
controls embedded in these processes.<br />
Tests Performed by Internal Audit<br />
The management of E.ON <strong>com</strong>panies relies on the assessment<br />
performed by their staff and on testing of the internal control<br />
system performed by Internal Audit. These tests are a key part<br />
of the process. Using a risk-oriented testing plan, Internal Audit<br />
tests the E.ON Group’s internal control system and identifies<br />
potential deficiencies (issues). On the basis of its own evaluation<br />
and the results of tests performed by Internal Audit, an<br />
E.ON <strong>com</strong>pany’s management carries out the final signing-off.<br />
Following the preliminary evaluation of the processes and controls<br />
performed by an E.ON <strong>com</strong>pany’s own staff and by<br />
Internal Audit, the market units carry out a second evaluation<br />
process to ensure quality before a final report is made to<br />
E.ON AG. This second evaluation is conducted by a <strong>com</strong>mittee<br />
of market unit staff or by the market unit management itself.<br />
Sign-Off Process<br />
The final step of the internal evaluation process is the submission<br />
of a formal written declaration confirming the system’s<br />
effectiveness. The declaration process is conducted at all levels<br />
of the Group (beginning at the business-unit level) before it<br />
is conducted by the reporting units and, finally, by E.ON AG. It<br />
is therefore a formal mechanism that en<strong>com</strong>passes all levels<br />
of the E.ON Group’s hierarchy. The Chairman of the E.ON AG<br />
Board of Management and the Chief Financial Officer make<br />
the final Sign-Off on the effectiveness of the internal control<br />
system of E.ON AG’s financial reporting.<br />
CEO Letter<br />
E.ON Stock<br />
Combined Group Management <strong>Report</strong><br />
Consolidated Financial Statements<br />
Corporate Governance <strong>Report</strong><br />
Supervisory Board and Board of Management<br />
Tables and Explanations<br />
Internal Audit regularly informs the E.ON AG Supervisory<br />
Board’s Audit and Risk Committee about the internal control<br />
system for financial reporting and any significant issues areas<br />
it identifies in the E.ON Group’s underlying control processes.<br />
General IT Controls<br />
The effectiveness of the automated controls in the standard<br />
accounting software systems and in key additional applications<br />
depends to a considerable degree on the proper functioning<br />
of IT systems. Consequently, IT controls are embedded in our<br />
documentation system. These controls primarily involve<br />
ensuring the proper functioning of access-control mechanisms<br />
of systems and applications, of daily IT operations (such as<br />
emergency intervention), and of the program change process.<br />
In addition, support for the central consolidation system is<br />
conducted at E.ON AG in Düsseldorf. Furthermore, an E.ON<br />
<strong>com</strong>pany called E.ON IT and external service providers provide<br />
<strong>com</strong>prehensive IT services for the majority of our units.<br />
201
202 Explanatory <strong>Report</strong> of the Board of Management on the Disclosures<br />
pursuant to Section 175, Paragraph 2 of the German Stock Corporation Act<br />
Explanatory <strong>Report</strong> of the Board of Management on<br />
the Disclosures Pursuant to Section 289, Paragraph 4,<br />
and Section 315, Paragraph 4, as well as Section 289,<br />
Paragraph 5, of the German Commercial Code<br />
The Board of Management has read and discussed the disclosures<br />
pursuant to Section 289, Paragraph 4 and Section 315,<br />
Paragraph 4 of the German Commercial Code contained in<br />
the Combined Group Management <strong>Report</strong> for the year ended<br />
December 31, <strong>2011</strong>, and issues the following declaration<br />
regarding these disclosures:<br />
The disclosures pursuant to Section 289, Paragraph 4 and<br />
Section 315, Paragraph 4 of the German Commercial Code<br />
contained in the Company’s Combined Group Management<br />
<strong>Report</strong> are correct and conform with the Board of Management’s<br />
knowledge. The Board of Management therefore confines<br />
itself to the following statements:<br />
Beyond the disclosures contained in the Combined Group<br />
Management <strong>Report</strong> (and legal restrictions such as the exclusion<br />
of voting rights pursuant to Section 136 of the German<br />
Stock Corporation Act), the Board of Management is not aware<br />
of any restrictions regarding voting rights or the transfer of<br />
shares. The Company is not aware of shareholdings in the Company’s<br />
share capital exceeding ten out of one hundred voting<br />
rights, so that information on such shareholdings is not necessary.<br />
There is no need to describe shares with special control<br />
rights (since no such shares have been issued) or special<br />
restrictions on the control rights of employees’ shareholdings<br />
(since employees who hold shares in the Company’s share<br />
capital exercise their control rights directly, just like other<br />
shareholders).<br />
To the extent that the Company has agreed to settlement<br />
payments for Board of Management members in the case of<br />
a change of control, the purpose of such agreements is to<br />
preserve the independence of Board of Management members.<br />
The Board of Management also read and discussed the disclosures<br />
in the Combined Group Management <strong>Report</strong> pursuant<br />
to Section 289, Paragraph 5, of the German Commercial Code.<br />
The disclosures contained in the Combined Group Management<br />
<strong>Report</strong> on the key features of our internal control and<br />
risk management system for accounting processes are <strong>com</strong>plete<br />
and <strong>com</strong>prehensive.<br />
Internal controls are an integral part of our accounting processes.<br />
Guidelines define uniform financial-reporting documentation<br />
requirements and procedures for the entire E.ON<br />
Group. We believe that <strong>com</strong>pliance with these rules provides<br />
sufficient certainty to prevent error or fraud from resulting in<br />
material misrepresentations in the Consolidated Financial<br />
Statements, the Combined Group Management <strong>Report</strong>, and<br />
the Interim <strong>Report</strong>s.<br />
Düsseldorf, February 2012<br />
E.ON AG<br />
Board of Management<br />
Dr. Teyssen Kildahl Prof. Dr. Maubach<br />
Dr. Reutersberg Dr. Schenck Stachelhaus
CEO Letter<br />
E.ON Stock<br />
Combined Group Management <strong>Report</strong><br />
Consolidated Financial Statements<br />
Corporate Governance <strong>Report</strong><br />
Supervisory Board and Board of Management<br />
Tables and Explanations<br />
Board of Management (and Information on Other Directorships Held by Board of Management Members)<br />
Dr. Johannes Teyssen<br />
Born 1959 in Hildesheim<br />
Chairman and Chief Executive Officer<br />
Member of the Board of Management<br />
since 2004<br />
Group Executive Human Resources, Corporate<br />
Strategy & Development, Investor<br />
Relations, Group Audit, and Political<br />
Affairs & Corporate Communications,<br />
Düsseldorf<br />
• E.ON Energie AG 1<br />
• E.ON Ruhrgas AG 1<br />
• Deutsche Bank AG<br />
• Salzgitter AG<br />
Jørgen Kildahl<br />
Born 1963 in Bærum, Norway<br />
Member of the Board of Management<br />
since 2010<br />
Upstream/Generation, Trading &<br />
Optimization, Düsseldorf<br />
• E.ON Ruhrgas AG 1 (Chairman)<br />
• E.ON Energy Trading SE 1 (Chairman)<br />
• E.ON Generation GmbH² (Chairman)<br />
• E.ON Sverige AB²<br />
Prof. Dr. Klaus-Dieter Maubach<br />
Born 1962 in Schwelm<br />
Member of the Board of Management<br />
since 2010<br />
Research & Development, New Build &<br />
Technology, Corporate Responsibility, Corporate<br />
Incident & Crisis Management,<br />
Health/Safety & Environment, Düsseldorf<br />
• E.ON Ruhrgas AG 1<br />
• E.ON Energy Trading SE 1<br />
• E.ON New Build & Technology GmbH 1<br />
(Chairman)<br />
• E.ON Czech Holding AG²<br />
• E.ON Sverige AB²<br />
Dr. Bernhard Reutersberg<br />
Born 1954 in Düsseldorf<br />
Member of the Board of Management<br />
since 2010<br />
Management of regional units, management<br />
of distribution and retail businesses,<br />
Düsseldorf<br />
• E.ON Energie AG 1 (Chairman)<br />
• E.ON España S.L.²<br />
• E.ON France S.A.S.² (Chairman)<br />
• E.ON Italia S.p.A.²<br />
• E.ON Sverige AB² (Chairman)<br />
• E.ON Benelux N.V.² (Chairman)<br />
• E.ON Hungaria Zrt.² (Chairman)<br />
• OAO E.ON Russia²<br />
• Nord Stream AG<br />
Dr. Marcus Schenck<br />
Born 1965 in Memmingen<br />
Member of the Board of Management<br />
since 2006<br />
Finance, Accounting, Corporate Planning<br />
& Controlling, Mergers & Acquisitions,<br />
Tax, Düsseldorf<br />
• E.ON Energy Trading SE 1<br />
• E.ON Ruhrgas AG 1<br />
• E.ON IT GmbH 1<br />
• Commerzbank AG<br />
• SMS Group GmbH<br />
• AXA S.A.<br />
Regine Stachelhaus<br />
Born 1955 in Böblingen<br />
Member of the Board of Management<br />
since 2010<br />
Group Human Resources, IT, Group Procurement,<br />
Legal Affairs & Compliance,<br />
Real Estate/Mining, Facility Management,<br />
E.ON Academy, Labor Director, Düsseldorf<br />
• E.ON Energie AG 1<br />
• E.ON Ruhrgas AG 1<br />
• E.ON IT GmbH 1 (Chairwoman)<br />
Information as of December 31, <strong>2011</strong>, or as of the date on which membership in the E.ON Board of Management ended.<br />
• Directorships/supervisory board memberships within the meaning of Section 100, Paragraph 2, of the German Stock Corporation Act.<br />
• Directorships/memberships in <strong>com</strong>parable domestic and foreign supervisory bodies of <strong>com</strong>mercial enterprises.<br />
1 Exempted E.ON Group directorship. 2 Other E.ON Group directorship.<br />
203
204<br />
Tables and Explanations<br />
Summary of Financial Highlights 1<br />
€ in millions 2007 2008 2009 2010 <strong>2011</strong><br />
Sales and earnings<br />
Sales 66,912 84,873 79,974 92,863 112,954<br />
EBITDA 2 11,907 12,836 12,975 13,346 9,293<br />
EBIT 2 8,820 9,483 9,291 9,454 5,438<br />
Net in<strong>com</strong>e/Net loss 7,724 1,621 8,669 6,281 -1,861<br />
Net in<strong>com</strong>e/Net loss attributable to shareholders of E.ON AG 7,204 1,283 8,420 5,853 -2,219<br />
Value measures<br />
ROACE/through 2009 ROCE (%) 15.6 13.6 12.2 14.4 8.4<br />
Cost of capital (%) 9.1 9.1 9.1 8.3 8.3<br />
Value added 3 3,678 3,128 2,362 4,000 90<br />
Asset structure<br />
Non-current assets 105,804 108,622 113,046 106,657 102,221<br />
Current assets 31,490 48,107 39,568 46,224 50,651<br />
Total assets 137,294 156,729 152,614 152,881 152,872<br />
Capital structure<br />
Equity 55,130 38,451 43,986 45,585 39,613<br />
Capital stock 1,734 2,001 2,001 2,001 2,001<br />
Minority interests 5,756 3,960 3,607 3,932 3,876<br />
Non-current liabilities 52,402 66,323 70,775 69,580 67,129<br />
Provisions 20,963 22,757 21,692 23,631 25,672<br />
Financial liabilities 15,915 25,036 30,657 28,880 24,029<br />
Other liabilities and other 15,524 18,530 18,426 17,069 17,428<br />
Current liabilities 29,762 51,955 37,853 37,716 46,130<br />
Provisions 3,992 4,260 4,715 4950 4,985<br />
Financial liabilities 5,549 16,022 7,120 3,611 5,885<br />
Other liabilities and other 20,221 31,673 26,018 31,527 35,260<br />
Total assets 137,294 156,824 152,614 152,881 152,872<br />
Cash flow and investments<br />
Cash provided by operating activities of continuing operations 8,434 6,397 8,590 10,614 6,610<br />
Cash-effective investments 10,616 17,756 8,655 8,286 6,524<br />
Financial ratios<br />
Equity ratio (%) 40 25 29 30 26<br />
Long-term capital as a percentage of non-current assets (%) 102 96 102 108 104<br />
Economic net debt (at year-end) -23,432 -44,946 -44,665 -37,701 -36,385<br />
Debt factor 4 1.9 3.4 3.4 2.8 3.9<br />
Cash provided by operating activities of continuing operations as a percentage of sales 12.7 7.8 11.1 11.4 5.9<br />
Stock 5<br />
Earnings per share attributable to shareholders of E.ON AG (€) 3.69 0.69 4.42 3.07 -1.16<br />
Equity 6 per share (€) 26.06 18.11 21.19 21.86 18.76<br />
Twelve-month high per share (€) 48.69 50.93 30.47 29.36 25.11<br />
Twelve-month low per share (€) 32.02 23.50 18.19 21.13 12.88<br />
Year-end closing price per share 7 (€) 48.53 28.44 29.23 22.94 16.67<br />
Dividend per share 8 (€) 1.37 1.50 1.50 1.50 1.00<br />
Dividend payout 2,560 2,857 2,858 2,858 1,905<br />
Market capitalization 7, 9 (€ in billions) 92.0 54.2 55.7 43.7 31.8<br />
E.ON AG long-term ratings<br />
Moody’s A2 A2 A2 A2 A3<br />
Standard & Poor’s A A A A A<br />
Employees<br />
Employees at year end 84,838 90,428 85,108 85,105 78,889<br />
1 Adjusted for discontinued operations. 2 Adjusted for extraordinary effects. 3 Starting with 2010, the figue is as of the balance-sheet date. 4 Ratio between economic net debt<br />
and EBITDA. 5 All figures subsequent to, or adjusted for, the stock split. 6 Attributable to shareholders of E.ON AG. 7 On December 30. 8 For the respective financial year; the <strong>2011</strong><br />
figure is management’s proposed dividend. 9 Based on shares outstanding.
Glossary of Financial Terms<br />
Actuarial gains and losses<br />
The actuarial calculation of provisions for pensions is based<br />
on projections of a number of variables, such as projected<br />
future salaries and pensions. An actuarial gain or loss is<br />
recorded when the actual numbers turn out to be different<br />
from the projections.<br />
ADR<br />
Abbreviation for American depositary receipt. These are depositary<br />
certificates issued by U.S. banks and traded on U.S. stock<br />
exchanges in place of a foreign stock. ADRs make it easier for<br />
foreign <strong>com</strong>panies to gain access to U.S. investors.<br />
Beta factor<br />
Indicator of a stock’s relative risk. A beta coefficient of more<br />
than one indicates that a stock has a higher risk than the<br />
overall market; a beta coefficient of less than one indicates<br />
that it has a lower risk.<br />
Bond<br />
Debt instrument that gives the holder the right to repayment<br />
of the bond’s face value plus an interest payment. Bonds are<br />
issued by public entities, credit institutions, and <strong>com</strong>panies<br />
and are sold through banks. They are a form of medium- and<br />
long-term debt financing.<br />
Capital employed<br />
Represents the interest-bearing capital tied up in the E.ON<br />
Group. It is equal to a segment’s operating assets less the<br />
amount of non-interest-bearing available capital. Other shareholdings<br />
are included at their acquisition cost, not their fair<br />
value.<br />
Capital stock<br />
The aggregate face value of all shares of stock issued by a <strong>com</strong>pany;<br />
entered as a liability in the <strong>com</strong>pany’s balance sheet.<br />
Cash flow statement<br />
Calculation and presentation of the cash a <strong>com</strong>pany has<br />
generated or consumed during a reporting period as a result<br />
of its operating, investing, and financing activities.<br />
Cash provided by operating activities<br />
Cash provided by, or used for, operating activities of continuing<br />
operations.<br />
CEO Letter<br />
E.ON Stock<br />
Combined Group Management <strong>Report</strong><br />
Consolidated Financial Statements<br />
Corporate Governance <strong>Report</strong><br />
Supervisory Board and Board of Management<br />
Tables and Explanations<br />
Commercial paper (“CP”)<br />
Unsecured, short-term debt instruments issued by <strong>com</strong>mercial<br />
firms and financial institutions. CPs are usually quoted on a<br />
discounted basis, with repayment at par value.<br />
Consolidation<br />
Accounting approach in which a parent <strong>com</strong>pany and its<br />
affiliates are presented as if they formed a single legal entity.<br />
All intra<strong>com</strong>pany in<strong>com</strong>e and expenses, intra<strong>com</strong>pany accounts<br />
payable and receivable, and other intra<strong>com</strong>pany transactions<br />
are offset against each other. Share investments in affiliates<br />
are offset against their capital stock, as are all intra<strong>com</strong>pany<br />
credits and debts, since such rights and obligations do not<br />
exist within a single legal entity. The adding together and consolidation<br />
of the remaining items in the annual financial<br />
statements yields the consolidated balance sheets and the<br />
consolidated statements of in<strong>com</strong>e.<br />
Contractual trust arrangement (“CTA”)<br />
Model for financing pension obligations under which <strong>com</strong>pany<br />
assets are converted to assets of a pension plan administered<br />
by an independent trust that is legally separate from the<br />
<strong>com</strong>pany.<br />
Cost of capital<br />
Weighted average of the costs of debt and equity financing<br />
(weighted average cost of capital: “WACC”). The cost of equity<br />
is the return expected by an investor in a given stock. The<br />
cost of debt is based on the cost of corporate debt and bonds.<br />
The interest on corporate debt is tax deductible (referred to<br />
as the tax shield on corporate debt).<br />
Credit default swap (“CDS”)<br />
A credit derivative used to hedge the default risk on loans,<br />
bonds, and other debt instruments.<br />
Debt factor<br />
Ratio between economic net debt and EBITDA. Serves as a<br />
metric for managing E.ON’s capital structure.<br />
Debt issuance program<br />
Contractual framework and standard documentation for the<br />
issuance of bonds.<br />
Discontinued operations<br />
Businesses or parts of a business that are planned for divestment<br />
or have already been divested. They are subject to special<br />
disclosure rules.<br />
205
206 Glossary of Financial Terms<br />
EBIT<br />
Adjusted earnings before interest and taxes. It is derived from<br />
in<strong>com</strong>e/loss from continuing operations before interest in<strong>com</strong>e<br />
and in<strong>com</strong>e taxes and is adjusted to exclude certain extraordinary<br />
items, mainly other in<strong>com</strong>e and expenses of a nonrecurring<br />
or rare nature (see Other non-operating earnings).<br />
EBITDA<br />
Adjusted earnings before interest, taxes, depreciation, and<br />
amortization. E.ON’s key earnings figure for purposes of internal<br />
management control and as an indicator of our businesses’<br />
long-term earnings power. It is derived from in<strong>com</strong>e/<br />
loss from continuing operations before interest in<strong>com</strong>e and<br />
in<strong>com</strong>e taxes and is adjusted to exclude certain extraordinary<br />
items, mainly other in<strong>com</strong>e and expenses of a non-recurring<br />
or rare nature (see Other non-operating earnings).<br />
Economic net debt<br />
Key figure that supplements net financial position with pension<br />
obligations and asset retirement obligations (less prepayments<br />
to the Swedish nuclear fund). The calculation of economic<br />
net debt includes the fair value (net) of currency derivatives<br />
used for financing transactions (but excluding transactions<br />
relating to our operating business and asset management)<br />
in order to also reflect the foreign-currency effects of financial<br />
transactions which, for accounting reasons, would not be<br />
included in the <strong>com</strong>ponents of net financial position.<br />
Equity method<br />
Method for valuing shareholdings in associated <strong>com</strong>panies<br />
whose assets and liabilities are not fully consolidated. The proportional<br />
share of the <strong>com</strong>pany’s annual net in<strong>com</strong>e (or loss)<br />
is reflected in the shareholding’s book value. This change is<br />
usually shown in the owning <strong>com</strong>pany’s in<strong>com</strong>e statement.<br />
Fair value<br />
The price at which assets, debts, and derivatives pass from a<br />
willing seller to a willing buyer, each having access to all the<br />
relevant facts and acting freely.<br />
Financial derivative<br />
Contractual agreement based on an underlying value (reference<br />
interest rate, securities prices, <strong>com</strong>modity prices) and a<br />
nominal amount (foreign currency amount, a certain number<br />
of stock shares).<br />
Goodwill<br />
The value of a subsidiary as disclosed in the parent <strong>com</strong>pany’s<br />
consolidated financial statements resulting from the consolidation<br />
of capital (after the elimination of hidden reserves and<br />
liabilities). It is calculated by offsetting the carrying amount<br />
of the parent <strong>com</strong>pany’s investment in the subsidiary against<br />
the parent <strong>com</strong>pany’s portion of the subsidiary’s equity.<br />
Impairment test<br />
Periodic <strong>com</strong>parison of an asset’s book value with its fair<br />
value. A <strong>com</strong>pany must record an impairment charge if it<br />
determines that an asset’s fair value has fallen below its<br />
book value. Goodwill, for example, is tested for impairment<br />
on at least an annual basis.<br />
International Financial <strong>Report</strong>ing Standards (“IFRS”)<br />
Under regulations passed by the European Parliament and<br />
European Council, capital-market-oriented <strong>com</strong>panies in<br />
the EU must apply IFRS for fiscal years that begin on or after<br />
January 1, 2005, and by January 1, 2007, at the latest.<br />
Investments<br />
Cash-effective capital investments.<br />
Net financial position<br />
Difference between a <strong>com</strong>pany’s total financial assets (cash<br />
and securities) and total financial liabilities (debts to financial<br />
institutions, third parties, and associated <strong>com</strong>panies).<br />
Option<br />
The right, not the obligation, to buy or sell an underlying asset<br />
(such as a security or currency) at a specific date at a predetermined<br />
price from or to a counterparty or seller. Buy options<br />
are referred to as calls, sell options as puts.<br />
Other non-operating earnings<br />
In<strong>com</strong>e and expenses that are unusual or infrequent, such as<br />
book gains or book losses from significant disposals as well<br />
as restructuring expenses (see EBIT).
Prepayments and accrued in<strong>com</strong>e<br />
Line item used to account for aperiodic expenses and in<strong>com</strong>e.<br />
Prepayments, which are recorded on the liability side of the<br />
balance sheet, occur when payment is made before the balance-sheet<br />
date, but the expense is after the balance-sheet<br />
date. Accrued in<strong>com</strong>e, which is recorded on the liabilities<br />
side of the balance sheet, occurs when payment is received<br />
before the balance-sheet date, but the in<strong>com</strong>e is recorded<br />
after the balance-sheet date.<br />
Purchase price allocation<br />
In a business <strong>com</strong>bination accounted for as a purchase, the<br />
values at which the acquired <strong>com</strong>pany’s assets and liabilities<br />
are recorded in the acquiring <strong>com</strong>pany’s balance sheet.<br />
Rating<br />
Standardized performance categories for an issuer’s short-<br />
and long-term debt instruments based on the probability of<br />
interest payment and full repayment. Ratings provide investors<br />
and creditors with the transparency they need to <strong>com</strong>pare<br />
the default risk of various financial investments.<br />
Return on equity<br />
The return earned on an equity investment (in this case,<br />
E.ON stock), calculated after corporate taxes but before an<br />
investor’s individual in<strong>com</strong>e taxes.<br />
ROACE<br />
Acronym for return on average capital employed. A key indicator<br />
for monitoring the performance of E.ON’s business, ROACE<br />
is the ratio between E.ON’s EBIT and average capital employed.<br />
Average capital employed represents the interest-bearing<br />
average capital tied up in the E.ON Group.<br />
ROCE<br />
Acronym for return on capital employed. ROCE is the ratio<br />
between E.ON’s EBIT and capital employed. Capital employed<br />
represents the interest-bearing capital tied up in the E.ON<br />
Group.<br />
Stock appreciation rights (“SAR”)<br />
Virtual stock options in which <strong>com</strong>pensation is in cash instead<br />
of in stock. At E.ON, the exercise gain equals the difference<br />
between the price of E.ON stock on the exercise date and at<br />
the time the SAR were issued.<br />
CEO Letter<br />
E.ON Stock<br />
Combined Group Management <strong>Report</strong><br />
Consolidated Financial Statements<br />
Corporate Governance <strong>Report</strong><br />
Supervisory Board and Board of Management<br />
Tables and Explanations<br />
Syndicated line of credit<br />
Credit facility extended by two or more banks that is good<br />
for a stated period of time.<br />
Tax shield<br />
Deductions that reduce an enterprise’s tax burden. For example,<br />
the interest on corporate debt is tax deductible. An enterprise<br />
takes this into consideration when choosing between equity<br />
and debt financing (see Cost of capital).<br />
Underlying net in<strong>com</strong>e<br />
An earnings figure after interest in<strong>com</strong>e, in<strong>com</strong>e taxes, and<br />
minority interests that has been adjusted to exclude certain<br />
extraordinary effects. The adjustments include effects from the<br />
marking to market of derivatives, book gains and book losses<br />
on disposals, restructuring expenses, and other non-operating<br />
in<strong>com</strong>e and expenses of a non-recurring or rare nature (after<br />
taxes and minority interests). Underlying net in<strong>com</strong>e also<br />
excludes in<strong>com</strong>e/loss from discontinued operations, net.<br />
Value added<br />
Key measure of E.ON’s financial performance based on residual<br />
wealth calculated by deducting the cost of capital (debt and<br />
equity) from operating profit. It is equivalent to the return<br />
spread (ROCE minus the cost of capital) multiplied by capital<br />
employed, which represents the interest-bearing capital tied<br />
up in the E.ON Group.<br />
Value at risk (“VaR”)<br />
Risk measure that indicates the potential loss that a portfolio<br />
of investments will not exceed with a certain degree of probability<br />
(for example, 99 percent) over a certain period of time<br />
(for example, one day). Due to the correlation of individual<br />
transactions, the risk faced by a portfolio is lower than the sum<br />
of the risks of the individual investments it contains.<br />
Working capital<br />
The difference between a <strong>com</strong>pany’s current assets and<br />
current liabilities.<br />
207
208<br />
Further information E.ON AG<br />
E.ON-Platz 1<br />
40479 Düsseldorf<br />
Germany<br />
T +49 211-4579-0<br />
F +49 211-4579-501<br />
info@eon.<strong>com</strong><br />
www.eon.<strong>com</strong><br />
Media Relations<br />
T +49 211-4579-453<br />
presse@eon.<strong>com</strong><br />
Investor Relations<br />
T +49 211-4579-549<br />
investorrelations@eon.<strong>com</strong><br />
Creditor Relations<br />
T +49 211-4579-563<br />
creditorrelations@eon.<strong>com</strong><br />
Only the German version of this <strong>Annual</strong> <strong>Report</strong> is legally binding.<br />
Production Jung Produktion, Düsseldorf<br />
Typesetting Addon Technical Solutions, Düsseldorf<br />
Printing Druckpartner, Essen<br />
Print <strong>com</strong>pensated<br />
Id-No. 1217782<br />
www.bvdm-online.de<br />
This <strong>Annual</strong> <strong>Report</strong> was printed on paper produced from fiber that <strong>com</strong>es from a responsibly managed forest<br />
certified by the Forest Stewardship Council.
Financial Calendar<br />
May 3, 2012 2012 <strong>Annual</strong> Shareholders Meeting<br />
May 4, 2012 Dividend Payout<br />
May 9, 2012 Interim <strong>Report</strong>: January – March 2012<br />
August 13, 2012 Interim <strong>Report</strong>: January – June 2012<br />
November 13, 2012 Interim <strong>Report</strong>: January – September 2012<br />
March 13, 2013 Release of the 2012 <strong>Annual</strong> <strong>Report</strong><br />
May 3, 2013 2013 <strong>Annual</strong> Shareholders Meeting<br />
May 6, 2013 Dividend Payout<br />
May 8, 2013 Interim <strong>Report</strong>: January – March 2013<br />
August 13, 2013 Interim <strong>Report</strong>: January – June 2013<br />
November 13, 2013 Interim <strong>Report</strong>: January – September 2013