2011 Annual Report - OTCIQ.com
2011 Annual Report - OTCIQ.com
2011 Annual Report - OTCIQ.com

Create successful ePaper yourself
Turn your PDF publications into a flip-book with our unique Google optimized e-Paper software.
4<br />
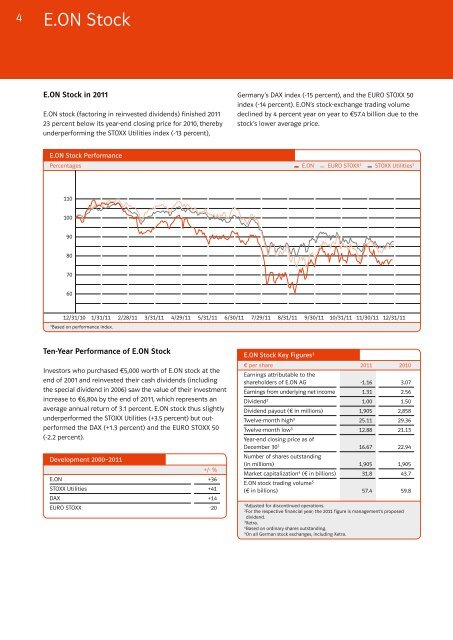
E.ON Stock<br />
E.ON Stock in <strong>2011</strong><br />
E.ON stock (factoring in reinvested dividends) finished <strong>2011</strong><br />
23 percent below its year-end closing price for 2010, thereby<br />
underperforming the STOXX Utilities index (-13 percent),<br />
Ten-Year Performance of E.ON Stock<br />
Investors who purchased €5,000 worth of E.ON stock at the<br />
end of 2001 and reinvested their cash dividends (including<br />
the special dividend in 2006) saw the value of their investment<br />
increase to €6,804 by the end of <strong>2011</strong>, which represents an<br />
average annual return of 3.1 percent. E.ON stock thus slightly<br />
underperformed the STOXX Utilities (+3.5 percent) but outperformed<br />
the DAX (+1.3 percent) and the EURO STOXX 50<br />
(-2.2 percent).<br />
Development 2000–<strong>2011</strong><br />
E.ON<br />
+/- %<br />
+36<br />
STOXX Utilities +41<br />
DAX +14<br />
EURO STOXX -20<br />
Germany’s DAX index (-15 percent), and the EURO STOXX 50<br />
index (-14 percent). E.ON’s stock-exchange trading volume<br />
declined by 4 percent year on year to €57.4 billion due to the<br />
stock’s lower average price.<br />
Percentages E.ON EURO STOXX1 STOXX Utilities1 E.ON Stock Performance<br />
110<br />
100<br />
90<br />
80<br />
70<br />
60<br />
12/31/10 1/31/11 2/28/11 3/31/11 4/29/11 5/31/11 6/30/11 7/29/11 8/31/11 9/30/11 10/31/11 11/30/11 12/31/11<br />
1 Based on performance index.<br />
E.ON Stock Key Figures1 € per share<br />
Earnings attributable to the<br />
<strong>2011</strong> 2010<br />
shareholders of E.ON AG -1.16 3.07<br />
Earnings from underlying net in<strong>com</strong>e 1.31 2.56<br />
Dividend2 1.00 1.50<br />
Dividend payout (€ in millions) 1,905 2,858<br />
Twelve-month high3 25.11 29.36<br />
Twelve-month low3 Year-end closing price as of<br />
12.88 21.13<br />
December 303 Number of shares outstanding<br />
16.67 22.94<br />
(in millions) 1,905 1,905<br />
Market capitalization4 (€ in billions)<br />
E.ON stock trading volume<br />
31.8 43.7<br />
5<br />
(€ in billions) 57.4 59.8<br />
1 Adjusted for discontinued operations.<br />
2 For the respective financial year; the <strong>2011</strong> figure is management’s proposed<br />
dividend.<br />
3 Xetra.<br />
4 Based on ordinary shares outstanding.<br />
5 On all German stock exchanges, including Xetra.