2011 Annual Report - OTCIQ.com
2011 Annual Report - OTCIQ.com
2011 Annual Report - OTCIQ.com

Create successful ePaper yourself
Turn your PDF publications into a flip-book with our unique Google optimized e-Paper software.
Analyzing Value Creation by Means of ROACE and<br />
Value Added<br />
ROACE is a pretax total return on capital. It measures the<br />
sustainable return on invested capital generated by operating<br />
a business. ROACE is defined as the ratio of EBIT to average<br />
capital employed.<br />
Average capital employed represents the interest-bearing<br />
capital tied up in the Group. Capital employed is equal to a<br />
segment’s operating assets less the amount of non-interestbearing<br />
available capital. Depreciable assets are recorded at<br />
half of their original acquisition or production cost. ROACE<br />
is therefore not affected by an asset’s depreciation period.<br />
Goodwill from acquisitions is included at acquisition cost,<br />
as long as this reflects its fair value. Changes to E.ON’s portfolio<br />
during the course of the year are factored into average<br />
capital employed.<br />
Average capital employed does not include the marking to<br />
market of other share investments. The purpose of excluding<br />
this item is to provide us with a more consistent picture of<br />
our ROACE performance.<br />
Value added measures the return that exceeds the cost of<br />
capital employed. It is calculated as follows:<br />
Value added = (ROACE – cost of capital) x average capital<br />
employed.<br />
ROACE and Value Added Performance in <strong>2011</strong><br />
The significant decline in our ROACE, from 14.4 to 8.4 percent,<br />
is primarily attributable to the decline in our EBIT. This effect<br />
was partially counteracted by a slight reduction in our average<br />
capital employed. This resulted from disposals and shutdowns,<br />
which were not entirely offset by ongoing investments. At<br />
8.4 percent, our ROACE again exceeded our pretax cost of capital.<br />
As a result, value added amounted to €90 million.<br />
CEO Letter<br />
E.ON Stock<br />
Combined Group Management <strong>Report</strong><br />
Consolidated Financial Statements<br />
Corporate Governance <strong>Report</strong><br />
Supervisory Board and Board of Management<br />
Tables and Explanations<br />
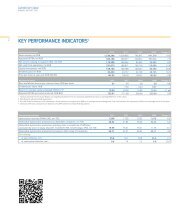
The table below shows the E.ON Group’s ROACE, value added,<br />
and their derivation.<br />
E.ON Group ROACE and Value Added<br />
€ in millions <strong>2011</strong> 2010<br />
EBIT1 5,438 9,454<br />
Goodwill, intangible assets, and property,<br />
plant, and equipment2 + Shares in affiliated and associated<br />
<strong>com</strong>panies and other share<br />
67,987 72,194<br />
investments 8,233 8,543<br />
+ Inventories 4,828 4,064<br />
+ Accounts receivable<br />
+ Other non-interest-bearing assets,<br />
including deferred in<strong>com</strong>e and<br />
4,055 5,184<br />
deferred tax assets 29,331 23,709<br />
- Non-interest-bearing provisions3 - Non-interest-bearing liabilities,<br />
including deferred expenses and<br />
8,231 8,006<br />
deferred tax liabilities 41,132 37,362<br />
- Adjustments4 Capital employed in continuing<br />
1,908 2,614<br />
operations (at year-end) 63,163 65,712<br />
Capital employed in continuing<br />
operations (annual average) 5 64,438 –<br />
ROACE 8.4% 14.4%<br />
Cost of capital before taxes 8.3% 8.3%<br />
Value added 6 90 4,000<br />
1 Adjusted for extraordinary effects.<br />
2 Depreciable assets are included at half their acquisition or production costs.<br />
Goodwill represents final figures following the <strong>com</strong>pletion of the purchase-price<br />
allocation (see Note 4 to the Consolidated Financial Statements).<br />
3 Non-interest-bearing provisions mainly include current provisions, such as those<br />
relating to sales and procurement market obligations. They do not include provisions<br />
for pensions or for nuclear-waste management.<br />
4 Capital employed is adjusted to exclude the mark-to-market valuation of other share<br />
investments, receivables and liabilities from derivatives, and operating liabilities<br />
for certain purchase obligations to minority shareholdings pursuant to IAS 32.<br />
5 In order to better depict intraperiod fluctuations in average capital employed,<br />
annual average capital employed is calculated as the arithmetic average of the<br />
amounts at the beginning of the year and the end of the year.<br />
6 Due to the switch from capital employed to average capital employed, the prioryear<br />
figure reflects cost of capital as of the balance sheet date.<br />
35