2011 Annual Report - OTCIQ.com
2011 Annual Report - OTCIQ.com
2011 Annual Report - OTCIQ.com

Create successful ePaper yourself
Turn your PDF publications into a flip-book with our unique Google optimized e-Paper software.
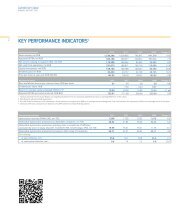
E.ON Group Financial Highlights 1<br />
€ in millions <strong>2011</strong> 2010 +/- %<br />
Electricity sales 2 (billion kWh) 1,144.8 1,030.4 +11<br />
Gas sales 2 (billion kWh) 1,718.1 1,342.4 +28<br />
Sales 112,954 92,863 +22<br />
EBITDA 3 9,293 13,346 -30<br />
EBIT 3 5,438 9,454 -42<br />
Net loss/Net in<strong>com</strong>e -1,861 6,281 -130<br />
Net loss/Net in<strong>com</strong>e attributable to shareholders of E.ON AG -2,219 5,853 -138<br />
Underlying net in<strong>com</strong>e 3 2,501 4,882 -49<br />
Investments 6,524 8,286 -21<br />
Cash provided by operating activities of continuing operations 6,610 10,614 -38<br />
Economic net debt (at year-end) -36,385 -37,701 +1,316 4<br />
Debt factor 5 3.9 2.8 +1.1 4<br />
Equity 39,613 45,585 -13<br />
Total assets 152,872 152,881 –<br />
ROACE (in %) 8.4 14.4 -6.0 6<br />
Pretax cost of capital (%) 8.3 8.3 –<br />
After-tax cost of capital (%) 6.1 6.1 –<br />
Value added 90 4,000 -98<br />
Employees (at year-end) 78,889 85,105 -7<br />
Earnings per share 7, 8 (€) -1.16 3.07 –<br />
Equity per share 7, 8 (€) 18.76 21.87 -14<br />
Dividend per share 9 (€) 1.00 1.50 -33<br />
Dividend payout 1,905 2,858 -33<br />
Market capitalization8 (€ in billions) 31.8 43.7 -27<br />
1 Adjusted for discontinued operations.<br />
2 Includes trading sales volume.<br />
3 Adjusted for extraordinary effects (see Glossary).<br />
4 Change in absolute terms.<br />
5 Ratio of economic net debt and EBITDA.<br />
6 Change in percentage points.<br />
7 Attributable to shareholders of E.ON AG.<br />
8 Based on shares outstanding.<br />
9 For the respective financial year; the <strong>2011</strong> figure is management’s proposed dividend.