2011 Annual Report - OTCIQ.com
2011 Annual Report - OTCIQ.com
2011 Annual Report - OTCIQ.com

Create successful ePaper yourself
Turn your PDF publications into a flip-book with our unique Google optimized e-Paper software.
Macroeconomic Environment<br />
In <strong>2011</strong>, the global economy did not continue its strong recovery<br />
from the prior year. According to the OECD, global gross<br />
domestic product (“GDP”) grew at a rate of 3.8 percent in real<br />
terms in <strong>2011</strong>, down from 5 percent in 2010. This lower growth<br />
rate, however, roughly matches the average growth rate for the<br />
years 1999 to 2008. Following a recession year (2009) and a<br />
boom year (2010), global trade expanded at a rate of 6.7 percent,<br />
which also marks a return to its long-term average.<br />
The OECD attributes the global economy’s weak growth in <strong>2011</strong><br />
to anti-inflationary (and thus growth-dampening) policies,<br />
lower import demand in emerging countries, and a decline in<br />
confidence in OECD countries. Positive trends in the OECD<br />
zone largely fizzled during the course of the year. Surveys<br />
taken since the summer show that economic confidence has<br />
declined, but not to the levels seen during the crisis of 2008.<br />
Weak growth in the OECD zone in <strong>2011</strong> was propelled by private<br />
consumption and investment activity. Growth in domestic<br />
demand declined by nearly 50 percent <strong>com</strong>pared with the<br />
prior year, and growth in net exports, which had helped drive<br />
economic growth in 2010, fell back to its pre-crisis level prior<br />
to 2007.<br />
Economic recovery in the United States slowed significantly.<br />
Because of high unemployment and restrictive fiscal policies,<br />
domestic demand grew at a lower rate despite robust demand<br />
for consumption and investment goods. Growth in U.S. net<br />
exports, which also returned to its normal rate after the boom<br />
of 2010, was not sufficient to offset the decline in domestic<br />
demand.<br />
The economic performance in the euro zone was also tepid<br />
in <strong>2011</strong>. Private investment activity provided some impetus,<br />
but the increase in private consumption was generally weak,<br />
and there was no increase in public consumption due to<br />
restrictive fiscal policies. Little growth impetus came from net<br />
exports. Southern European countries (Greece, Italy, Portugal,<br />
Spain) recorded the lowest growth rates. Buoyed by robust<br />
domestic demand, Sweden’s GDP growth was among the highest<br />
in the EU. The United Kingdom experienced lower domestic<br />
demand despite fiscal policies designed to stimulate it. Its<br />
economy expanded only incrementally thanks to net exports.<br />
CEO Letter<br />
E.ON Stock<br />
Combined Group Management <strong>Report</strong><br />
Consolidated Financial Statements<br />
Corporate Governance <strong>Report</strong><br />
Supervisory Board and Board of Management<br />
Tables and Explanations<br />
Germany was one of the few countries to have a high rate of<br />
economic growth in <strong>2011</strong>. Fueled by net exports and, <strong>com</strong>pared<br />
with recent years, by un<strong>com</strong>monly robust private consumption<br />
demand, Germany’s economy continued its solid recovery<br />
from the recession of 2009 and, almost without interruption,<br />
its upward trend of 2010.<br />
The BRIC countries (Brazil, Russia, India, China) continue to<br />
offer growth potential. Higher oil prices helped stabilize<br />
Russia’s economy, but GDP growth in China was lower due to<br />
restrictive monetary policy.<br />
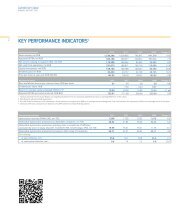
<strong>2011</strong> GDP Growth in Real Terms<br />
<strong>Annual</strong> change in percent<br />
Germany<br />
France<br />
Italy<br />
Spain<br />
Euro zone<br />
Sweden<br />
United<br />
Kingdom<br />
OECD<br />
USA<br />
Russian<br />
Federation<br />
0.7<br />
0.7<br />
0.9<br />
0 1.0 2.0 3.0 4.0 5.0<br />
Source: OECD, <strong>2011</strong>.<br />
1.6<br />
1.6<br />
1.7<br />
1.9<br />
3.0<br />
4.1<br />
4.0<br />
15