2011 Annual Report - OTCIQ.com
2011 Annual Report - OTCIQ.com
2011 Annual Report - OTCIQ.com

You also want an ePaper? Increase the reach of your titles
YUMPU automatically turns print PDFs into web optimized ePapers that Google loves.
20 Corporate Profile and Operating Environment<br />
Power Procurement<br />
The E.ON Group’s owned generation declined by 2 percent, from<br />
276.1 billion kWh in 2010 to 271.2 billion kWh in <strong>2011</strong>. By contrast,<br />
power procured increased by 15 percent to 894.3 billion kWh.<br />
The reduction in Generation’s owned generation is primarily<br />
attributable to the shutdown of Unterweser and Isar 1 nuclear<br />
power stations in Germany after the expiration of the moratorium<br />
period set by the German federal government. The<br />
decline was also due to narrower margins in the United Kingdom,<br />
which made some plant less economic to operate.<br />
Renewables’ owned generation of 24 billion kWh exceeded<br />
the prior-year figure (22.2 billion kWh). Owned generation in<br />
the Hydro reporting unit declined by 0.5 billion kWh due to<br />
lower water levels in nearly all countries, particularly in Germany,<br />
which saw considerably less precipitation than in the prior<br />
year. By contrast, owned generation in Sweden rose due to high<br />
inflows. Owned generation at the Wind/Solar/Other reporting<br />
unit rose by 29 percent to 10.2 billion kWh. Wind farms<br />
accounted for 96 percent of Renewables’ owned generation,<br />
with biomass and micro-hydro facilities accounting for the rest.<br />
Owned generation at the Germany regional unit’s distributed<br />
generating facilities was 6.6 billion kWh, slightly below the<br />
prior-year level. Lower flowthrough was responsible for the<br />
decline in hydro output, warm weather (and the resulting<br />
reduction in the use of cogeneration units) for the decline in<br />
output from natural-gas and oil assets.<br />
Other EU Countries’ owned generation declined by 0.8 billion<br />
kWh, mainly because narrower margins in the United Kingdom<br />
made some gas-fired units less economic to operate.<br />
Owned generation declined in Sweden and the Netherlands<br />
due to less demand from our Trading unit. The <strong>2011</strong> and 2010<br />
figures for this segment include CHP output in the United<br />
Kingdom.<br />
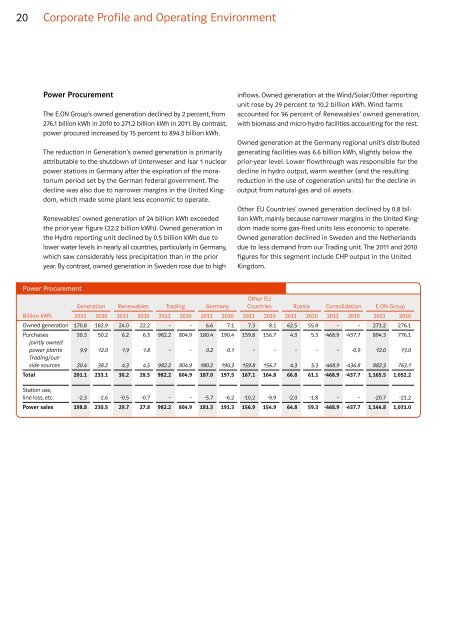
Power Procurement<br />
Generation Renewables Trading Germany<br />
Other EU<br />
Countries Russia Consolidation E.ON Group<br />
Billion kWh <strong>2011</strong> 2010 <strong>2011</strong> 2010 <strong>2011</strong> 2010 <strong>2011</strong> 2010 <strong>2011</strong> 2010 <strong>2011</strong> 2010 <strong>2011</strong> 2010 <strong>2011</strong> 2010<br />
Owned generation 170.8 182.9 24.0 22.2 – – 6.6 7.1 7.3 8.1 62.5 55.8 – – 271.2 276.1<br />
Purchases<br />
Jointly owned<br />
30.3 50.2 6.2 6.3 982.2 804.9 180.4 190.4 159.8 156.7 4.3 5.3 -468.9 -437.7 894.3 776.1<br />
power plants<br />
Trading/out-<br />
9.9 12.0 1.9 1.8 – – 0.2 0.1 – – – – – -0.9 12.0 13.0<br />
side sources 20.4 38.2 4.3 4.5 982.2 804.9 180.2 190.3 159.8 156.7 4.3 5.3 -468.9 -436.8 882.3 763.1<br />
Total 201.1 233.1 30.2 28.5 982.2 804.9 187.0 197.5 167.1 164.8 66.8 61.1 -468.9 -437.7 1,165.5 1,052.2<br />
Station use,<br />
line loss, etc. -2.3 -2.6 -0.5 -0.7 – – -5.7 -6.2 -10.2 -9.9 -2.0 -1.8 – – -20.7 -21.2<br />
Power sales 198.8 230.5 29.7 27.8 982.2 804.9 181.3 191.3 156.9 154.9 64.8 59.3 -468.9 -437.7 1,144.8 1,031.0