2011 Annual Report - OTCIQ.com
2011 Annual Report - OTCIQ.com
2011 Annual Report - OTCIQ.com

Create successful ePaper yourself
Turn your PDF publications into a flip-book with our unique Google optimized e-Paper software.
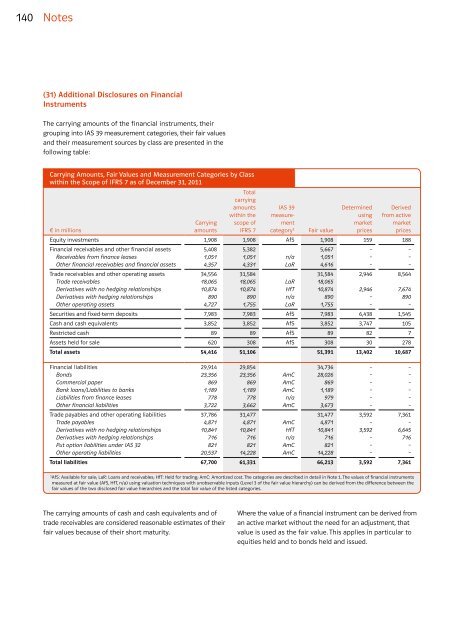
140 Notes<br />
(31) Additional Disclosures on Financial<br />
Instruments<br />
The carrying amounts of the financial instruments, their<br />
grouping into IAS 39 measurement categories, their fair values<br />
and their measurement sources by class are presented in the<br />
following table:<br />
Carrying Amounts, Fair Values and Measurement Categories by Class<br />
within the Scope of IFRS 7 as of December 31, <strong>2011</strong><br />
Total<br />
carrying<br />
amounts IAS 39<br />
within the measure-<br />
Carrying scope of ment<br />
€ in millions<br />
amounts IFRS 7 category1 Determined Derived<br />
using from active<br />
market market<br />
Fair value prices prices<br />
Equity investments 1,908 1,908 AfS 1,908 159 188<br />
Financial receivables and other financial assets 5,408 5,382 5,667 – –<br />
Receivables from finance leases 1,051 1,051 n/a 1,051 – –<br />
Other financial receivables and financial assets 4,357 4,331 LaR 4,616 – –<br />
Trade receivables and other operating assets 34,556 31,584 31,584 2,946 8,564<br />
Trade receivables 18,065 18,065 LaR 18,065<br />
Derivatives with no hedging relationships 10,874 10,874 HfT 10,874 2,946 7,674<br />
Derivatives with hedging relationships 890 890 n/a 890 – 890<br />
Other operating assets 4,727 1,755 LaR 1,755 – –<br />
Securities and fixed-term deposits 7,983 7,983 AfS 7,983 6,438 1,545<br />
Cash and cash equivalents 3,852 3,852 AfS 3,852 3,747 105<br />
Restricted cash 89 89 AfS 89 82 7<br />
Assets held for sale 620 308 AfS 308 30 278<br />
Total assets 54,416 51,106 51,391 13,402 10,687<br />
Financial liabilities 29,914 29,854 34,736 – –<br />
Bonds 23,356 23,356 AmC 28,026 – –<br />
Commercial paper 869 869 AmC 869 – –<br />
Bank loans/Liabilities to banks 1,189 1,189 AmC 1,189 – –<br />
Liabilities from finance leases 778 778 n/a 979 – –<br />
Other financial liabilities 3,722 3,662 AmC 3,673 – –<br />
Trade payables and other operating liabilities 37,786 31,477 31,477 3,592 7,361<br />
Trade payables 4,871 4,871 AmC 4,871 – –<br />
Derivatives with no hedging relationships 10,841 10,841 HfT 10,841 3,592 6,645<br />
Derivatives with hedging relationships 716 716 n/a 716 – 716<br />
Put option liabilities under IAS 32 821 821 AmC 821 – –<br />
Other operating liabilities 20,537 14,228 AmC 14,228 – –<br />
Total liabilities 67,700 61,331 66,213 3,592 7,361<br />
1 AfS: Available for sale; LaR: Loans and receivables; HfT: Held for trading; AmC: Amortized cost. The categories are described in detail in Note 1. The values of financial instruments<br />
measured at fair value (AfS, HfT, n/a) using valuation techniques with unobservable inputs (Level 3 of the fair value hierarchy) can be derived from the difference between the<br />
fair values of the two disclosed fair value hierarchies and the total fair value of the listed categories.<br />
The carrying amounts of cash and cash equivalents and of<br />
trade receivables are considered reasonable estimates of their<br />
fair values because of their short maturity.<br />
Where the value of a financial instrument can be derived from<br />
an active market without the need for an adjustment, that<br />
value is used as the fair value. This applies in particular to<br />
equities held and to bonds held and issued.