2011 Annual Report - OTCIQ.com
2011 Annual Report - OTCIQ.com
2011 Annual Report - OTCIQ.com

You also want an ePaper? Increase the reach of your titles
YUMPU automatically turns print PDFs into web optimized ePapers that Google loves.
26 Earnings Situation<br />
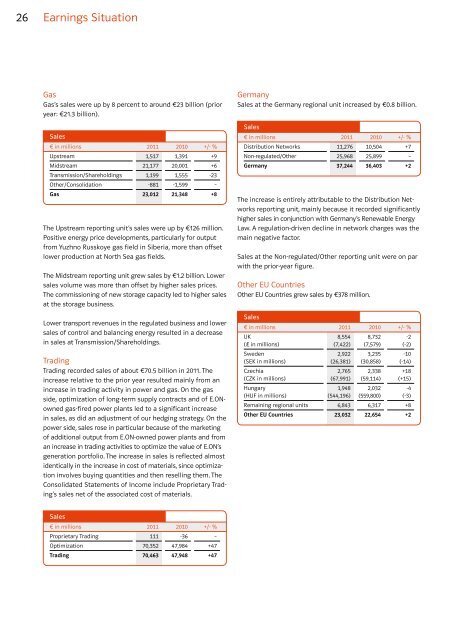
Gas<br />
Gas’s sales were up by 8 percent to around €23 billion (prior<br />
year: €21.3 billion).<br />
Sales<br />
€ in millions <strong>2011</strong> 2010 +/- %<br />
Upstream 1,517 1,391 +9<br />
Midstream 21,177 20,001 +6<br />
Transmission/Shareholdings 1,199 1,555 -23<br />
Other/Consolidation -881 -1,599 –<br />
Gas 23,012 21,348 +8<br />
The Upstream reporting unit’s sales were up by €126 million.<br />
Positive energy price developments, particularly for output<br />
from Yuzhno Russkoye gas field in Siberia, more than offset<br />
lower production at North Sea gas fields.<br />
The Midstream reporting unit grew sales by €1.2 billion. Lower<br />
sales volume was more than offset by higher sales prices.<br />
The <strong>com</strong>missioning of new storage capacity led to higher sales<br />
at the storage business.<br />
Lower transport revenues in the regulated business and lower<br />
sales of control and balancing energy resulted in a decrease<br />
in sales at Transmission/Shareholdings.<br />
Trading<br />
Trading recorded sales of about €70.5 billion in <strong>2011</strong>. The<br />
increase relative to the prior year resulted mainly from an<br />
increase in trading activity in power and gas. On the gas<br />
side, optimization of long-term supply contracts and of E.ONowned<br />
gas-fired power plants led to a significant increase<br />
in sales, as did an adjustment of our hedging strategy. On the<br />
power side, sales rose in particular because of the marketing<br />
of additional output from E.ON-owned power plants and from<br />
an increase in trading activities to optimize the value of E.ON’s<br />
generation portfolio. The increase in sales is reflected almost<br />
identically in the increase in cost of materials, since optimization<br />
involves buying quantities and then reselling them. The<br />
Consolidated Statements of In<strong>com</strong>e include Proprietary Trading’s<br />
sales net of the associated cost of materials.<br />
Sales<br />
€ in millions <strong>2011</strong> 2010 +/- %<br />
Proprietary Trading 111 -36 –<br />
Optimization 70,352 47,984 +47<br />
Trading 70,463 47,948 +47<br />
Germany<br />
Sales at the Germany regional unit increased by €0.8 billion.<br />
Sales<br />
€ in millions <strong>2011</strong> 2010 +/- %<br />
Distribution Networks 11,276 10,504 +7<br />
Non-regulated/Other 25,968 25,899 –<br />
Germany 37,244 36,403 +2<br />
The increase is entirely attributable to the Distribution Networks<br />
reporting unit, mainly because it recorded significantly<br />
higher sales in conjunction with Germany’s Renewable Energy<br />
Law. A regulation-driven decline in network charges was the<br />
main negative factor.<br />
Sales at the Non-regulated/Other reporting unit were on par<br />
with the prior-year figure.<br />
Other EU Countries<br />
Other EU Countries grew sales by €378 million.<br />
Sales<br />
€ in millions <strong>2011</strong> 2010 +/- %<br />
UK<br />
8,554 8,732 -2<br />
(£ in millions)<br />
(7,422) (7,579) (-2)<br />
Sweden<br />
2,922 3,235 -10<br />
(SEK in millions)<br />
(26,381) (30,858) (-14)<br />
Czechia<br />
2,765 2,338 +18<br />
(CZK in millions)<br />
(67,991) (59,114) (+15)<br />
Hungary<br />
1,948 2,032 -4<br />
(HUF in millions)<br />
(544,196) (559,800) (-3)<br />
Remaining regional units 6,843 6,317 +8<br />
Other EU Countries 23,032 22,654 +2